State the volume changes observed when a givenmass of water is heated from to . Sketch a temperature volume graph to show the behaviour.
To solve the question regarding the volume changes of water when heated from 0∘C to 10∘C, we can break it down into the following steps:
Step 1: Understand the Behavior of Water
When water is heated, it exhibits unique volume changes, especially between 0∘C and 4∘C.
Step 2: Heating from 0∘C to 4∘C
- Observation: As water is heated from 0∘C to 4∘C, it actually contracts.
- Volume Change: The volume of water decreases during this temperature range.
Step 3: Heating from 4∘C to 10∘C
- Observation: When water is heated from 4∘C to 10∘C, it expands.
- Volume Change: The volume of water increases during this temperature range.
Step 4: Summarize the Volume Changes
- From 0∘C to 4∘C: Volume decreases (water contracts).
- From 4∘C to 10∘C: Volume increases (water expands).
Step 5: Sketch the Temperature-Volume Graph
1. Axes: Draw a graph with the x-axis representing temperature (in degrees Celsius) and the y-axis representing volume (in cubic centimeters).
2. Plot Points:
- At 0∘C, the volume starts at approximately 1.0000cm3.
- As the temperature increases to 4∘C, the volume decreases slightly.
- At 4∘C, the volume reaches its minimum.
- As the temperature increases from 4∘C to 10∘C, the volume increases again.
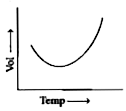
3. Graph Shape: The graph will show a downward slope from 0∘C to 4∘C and an upward slope from 4∘C to 10∘C.
Final Graph Representation
- The graph will have a curve that dips downwards from 0∘C to 4∘C and then rises from 4∘C to 10∘C.
When water is heated, it exhibits unique volume changes, especially between 0∘C and 4∘C.
- Observation: As water is heated from 0∘C to 4∘C, it actually contracts.
- Volume Change: The volume of water decreases during this temperature range.
- Observation: When water is heated from 4∘C to 10∘C, it expands.
- Volume Change: The volume of water increases during this temperature range.
- From 0∘C to 4∘C: Volume decreases (water contracts).
- From 4∘C to 10∘C: Volume increases (water expands).
1. Axes: Draw a graph with the x-axis representing temperature (in degrees Celsius) and the y-axis representing volume (in cubic centimeters).
2. Plot Points:
- At 0∘C, the volume starts at approximately 1.0000cm3.
- As the temperature increases to 4∘C, the volume decreases slightly.
- At 4∘C, the volume reaches its minimum.
- As the temperature increases from 4∘C to 10∘C, the volume increases again.
3. Graph Shape: The graph will show a downward slope from 0∘C to 4∘C and an upward slope from 4∘C to 10∘C.
- The graph will have a curve that dips downwards from 0∘C to 4∘C and then rises from 4∘C to 10∘C.
Topper's Solved these Questions
- HEAT AND ENERGYBOOK - ICSECHAPTER - HEAT AND ENERGYEXERCISE - EXERCISE -6(A) (Multiple Choice Question)
5 Videos
- HEAT AND ENERGYBOOK - ICSECHAPTER - HEAT AND ENERGYEXERCISE - EXERCISE -6(B)
12 Videos
- FLUIDSBOOK - ICSECHAPTER - FLUIDSEXERCISE - TOPIC 2 (4 Marks Questions )
16 Videos
- ICSE ANNUAL EXAMINATION -2020BOOK - ICSECHAPTER - ICSE ANNUAL EXAMINATION -2020EXERCISE - SECTION-II
45 Videos
Similar Questions
Knowledge Check
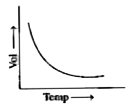
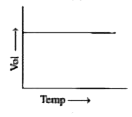
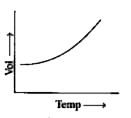
The relation between volume and temperature of a sample of water in the range 0∘C to 100∘C is best represented by
A B
B C
C D
D
On heating water from 0∘C to 100∘C its volume
View SolutionWhen water is heated from O∘C to 10∘C, its density
View SolutionA given mass of water is cooled from 10∘C to 0∘C. State the volume changes observed. Represent these changes on a temperature volume graph.
View SolutionHow does the density of water change when : it is heated from 4∘C to 10∘C ?
View SolutionHow does the density of water change when : it is heated from 0∘C to 4∘C
View SolutionWater is heated from 0∘C ato 10∘C. How does the density of water change with temperature?
View SolutionWhen water is cooled from 4∘C to 0∘C its volume decreases.
View Solution
