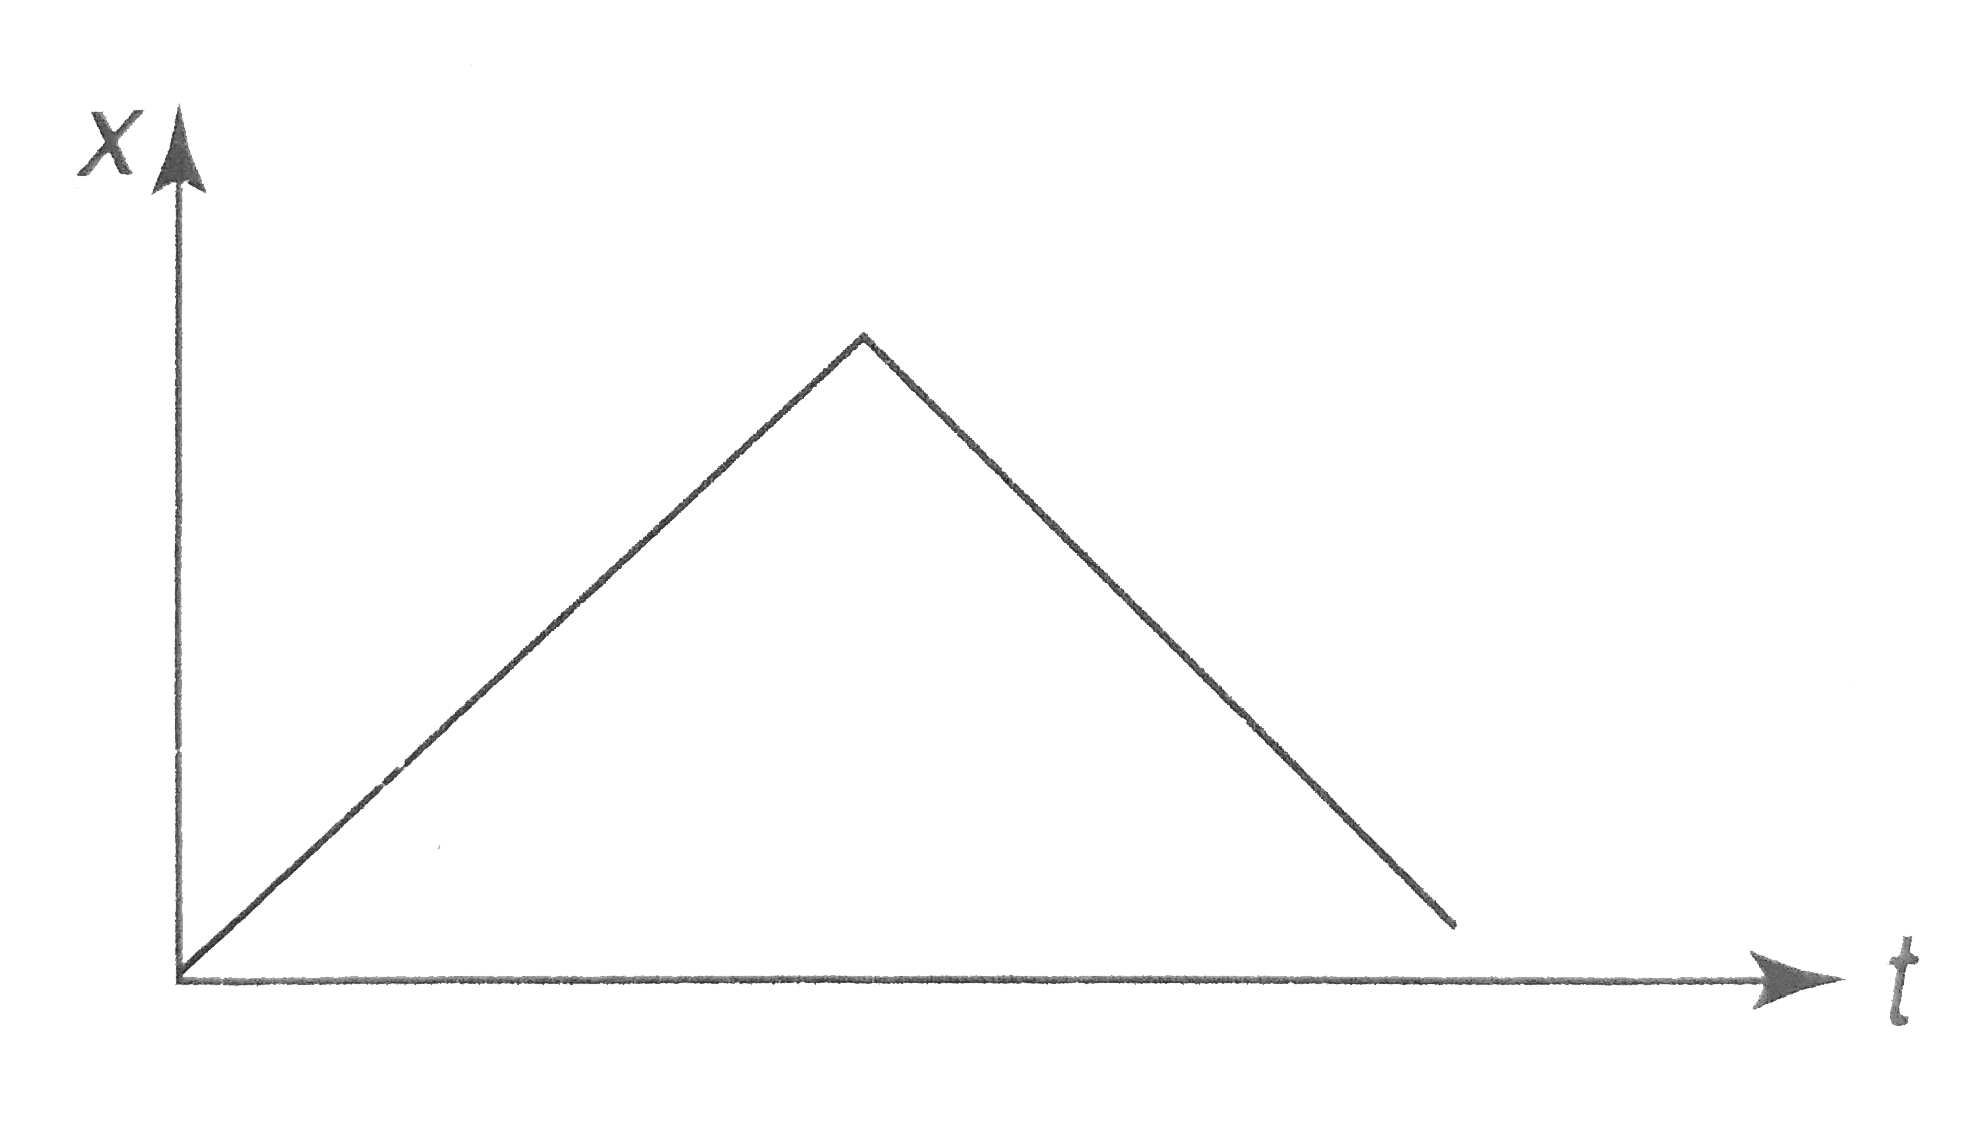
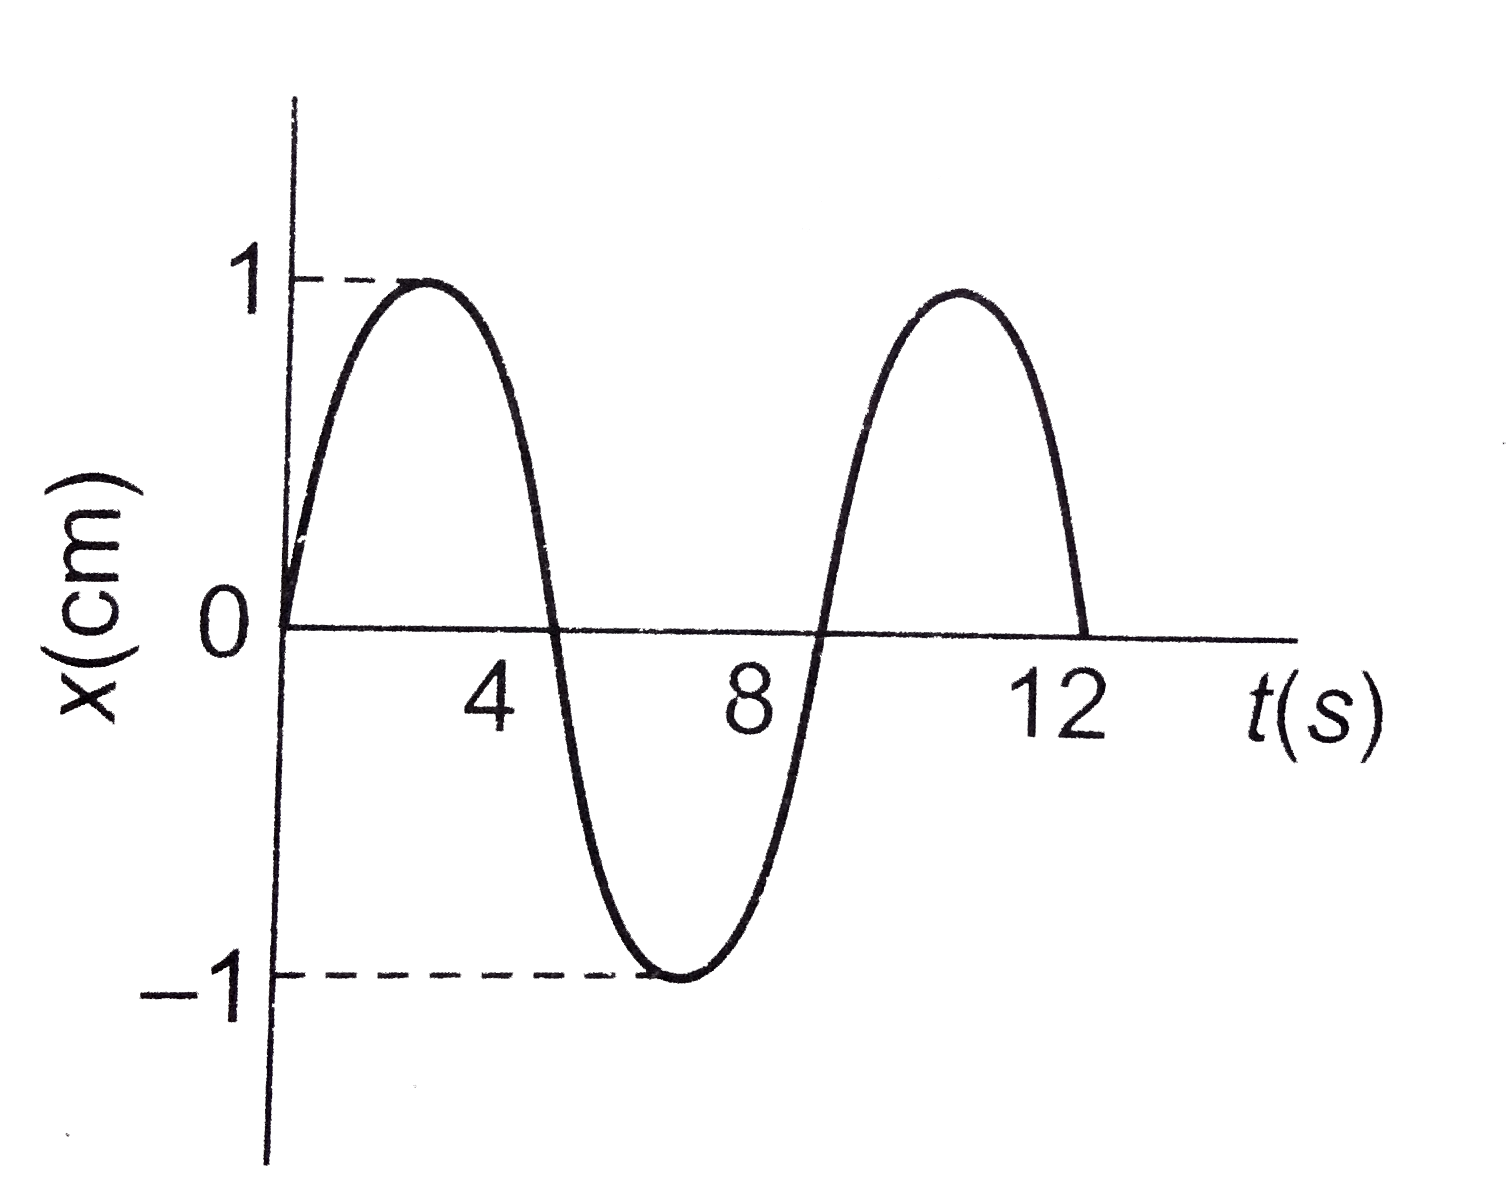
Assertion: x−t graph, for a particle undergoing rectilinear motion, can be as shown in the figure.
Reason: Infinitesimal changes in velocity are physically possible only in infinitesimal time.
Statement -1 is True, Statement-2 is Ture, Statement-2 is a correct explanantion for Statement-1.
Statement-1 is Ture, Statement-2 is Ture, Statement-2 is Not a correct explanantion for Statement-1.
Statement-1 is True, Statement-2 is False.
Statement-1 is False, Statement-2 is True.
The correct Answer is:D
At the high point of the graph velocity (slope of x−t curve) changes suddenly from a positive to a negative value. This is physically impossible.
Similar Questions
Knowledge Check
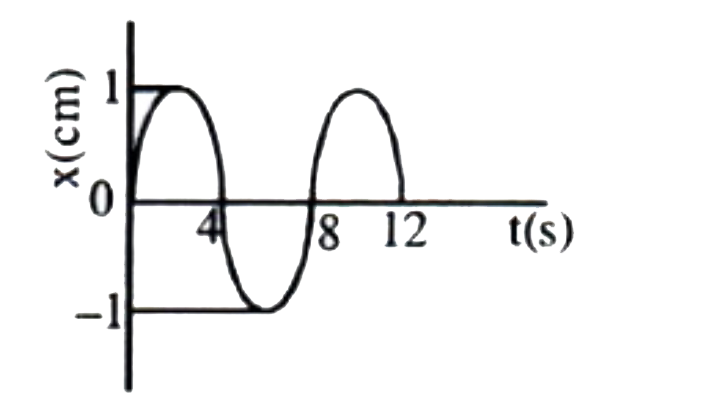
The x−t graph of a particle undergoing simple harmonic motion is shown in figure. Acceleration of particle at t=4/3s is
 A√332π2cm/s2B−π232cm/s2Cπ232cm/s2D−√332π2cm/s2
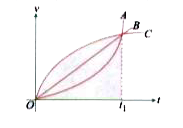
v - t graph for rectilinear motion is given as shown in the figure. Match the column on the basis of the v-t graph.
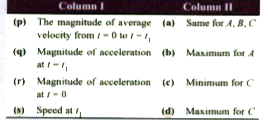 Ap−d,q−b,c,r−d,s−aBp−a,q−c,d,r−b,s−aCp−b,q−b,c,r−b,s−aDNone of these
Veolocity-time graph of a particle undergoing rectilinear motioin is plotted upto t=t4 as shown in the figure. Average acceleration of the particle is zero in the time internal between
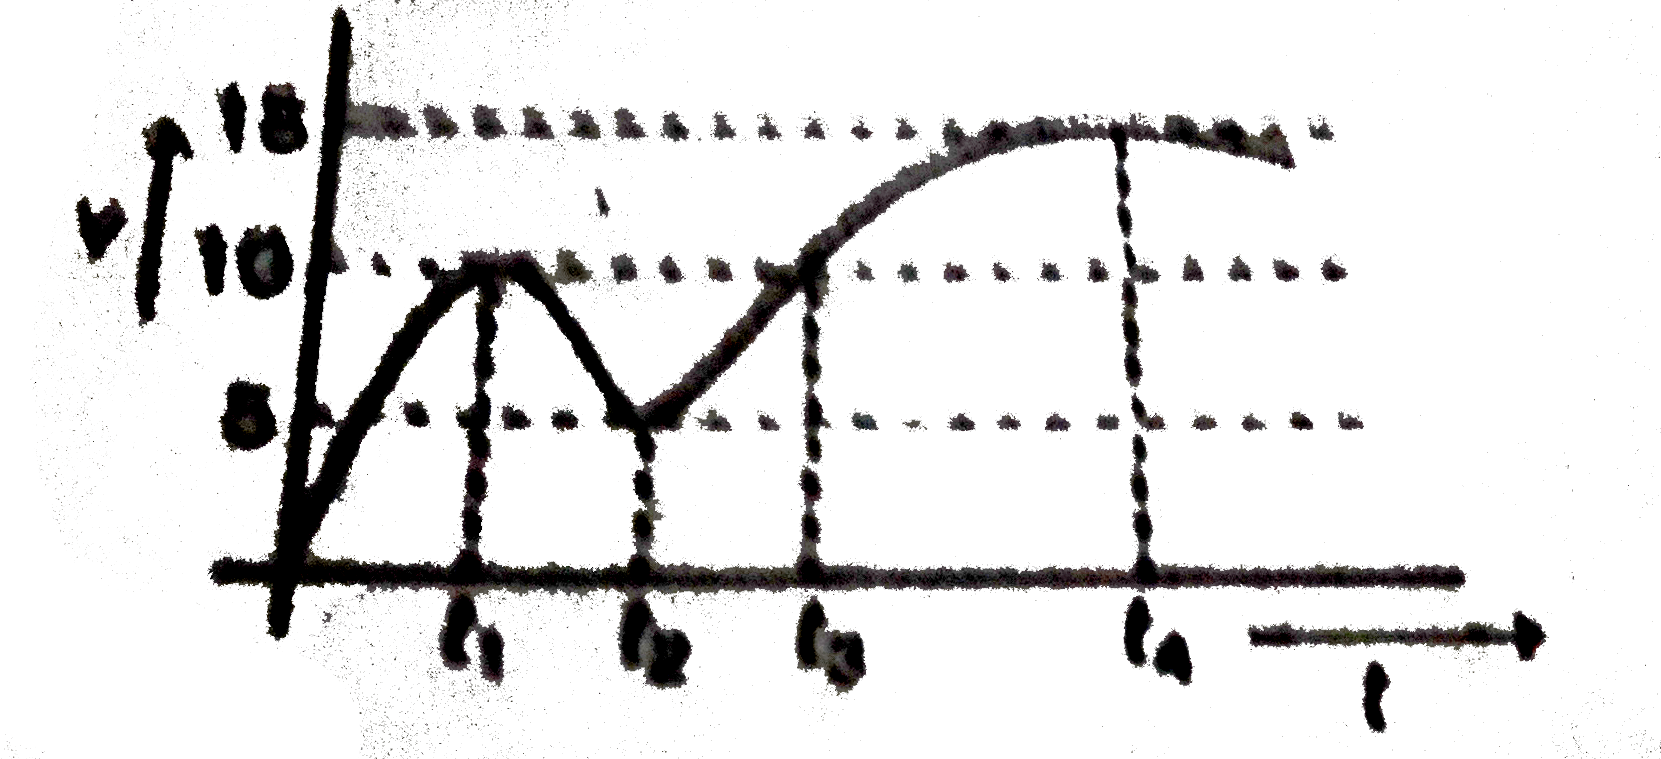 A0 and t1Bt1 and t2Ct1 and t3Dt3 and t4
Veolocity-time graph of a particle undergoing rectilinear motioin is plotted upto t=t4 as shown in the figure. Average acceleration of the particle is zero in the time internal between

View SolutionThe x-t graph of a particle undergoing SHM is as shown in figure. The acceleration of the particle at t=2/3 is
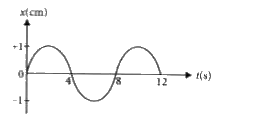
View SolutionThe x−t graph of a particle undergoing simple harmonic motion is shown below. The accelertion of the particle at t=4/3s is
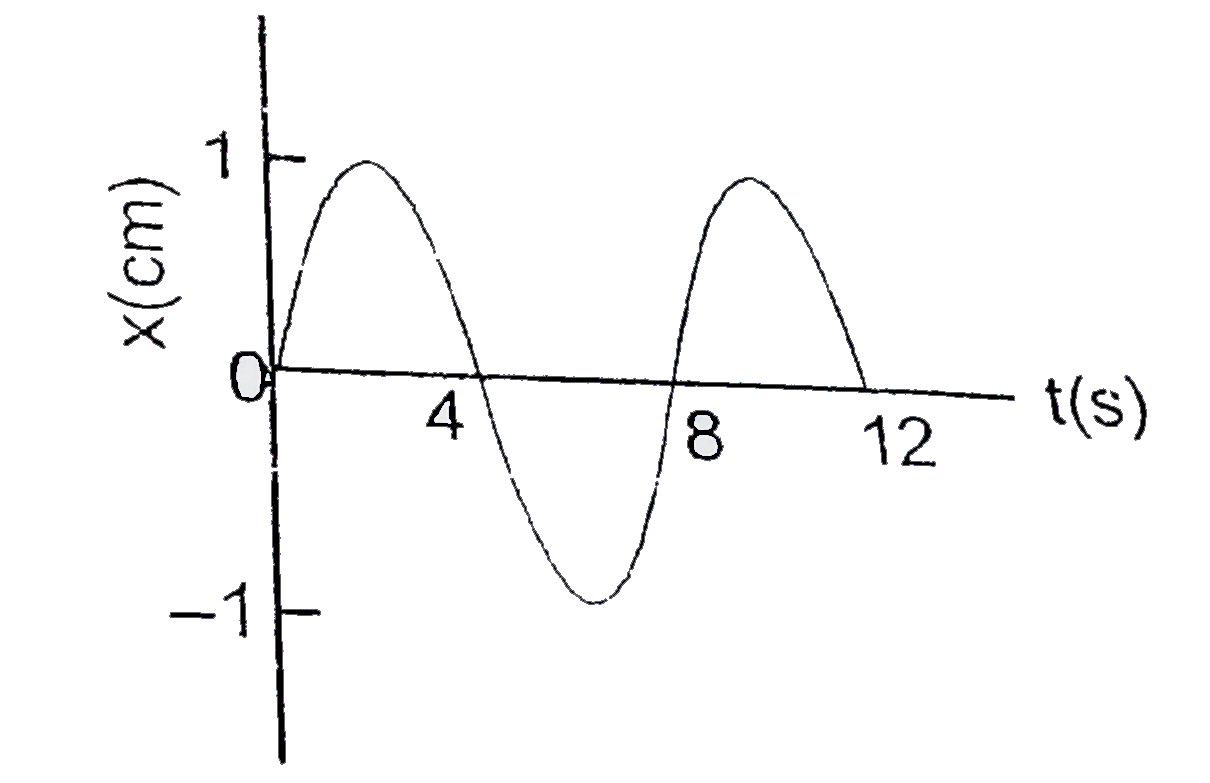
View SolutionThe x-t graph of a particle undergoing simple harmonic motion is shown below. The acceleration of the particle of t=4/3s is
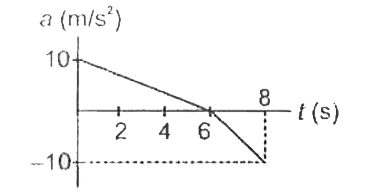
View SolutionThe acceleration - time graph for a particle moving along x - axis is shown in figure, If the initial velocity of particle is −5m/s, the velocity at t = 8 s is
View Solution
