Suppose the two photographs, shown in Figure 1 and Figure 2, had been taken at an interval of 10 seconds. If a distance of 100 metres is shown by 1 cm in these photographs, calculate the speed of the blue car.
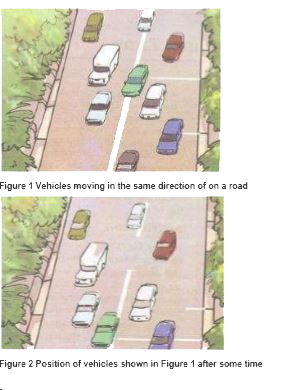
Thedistance covered by the blue car (as evident from the photograph) from one white strip to another, which is measured by scale is 1.4 cm.
It is given that 1 cm is equivalent to 100 m.
Therefore, 1.4 cm is equivalent to 140 m.
Distance travelled by the car = 140 m
Time interval between the two photographs = 10 s
Speed =Distance coveredTime taken=14010=14 m/s
Topper's Solved these Questions
Similar Questions
Knowledge Check
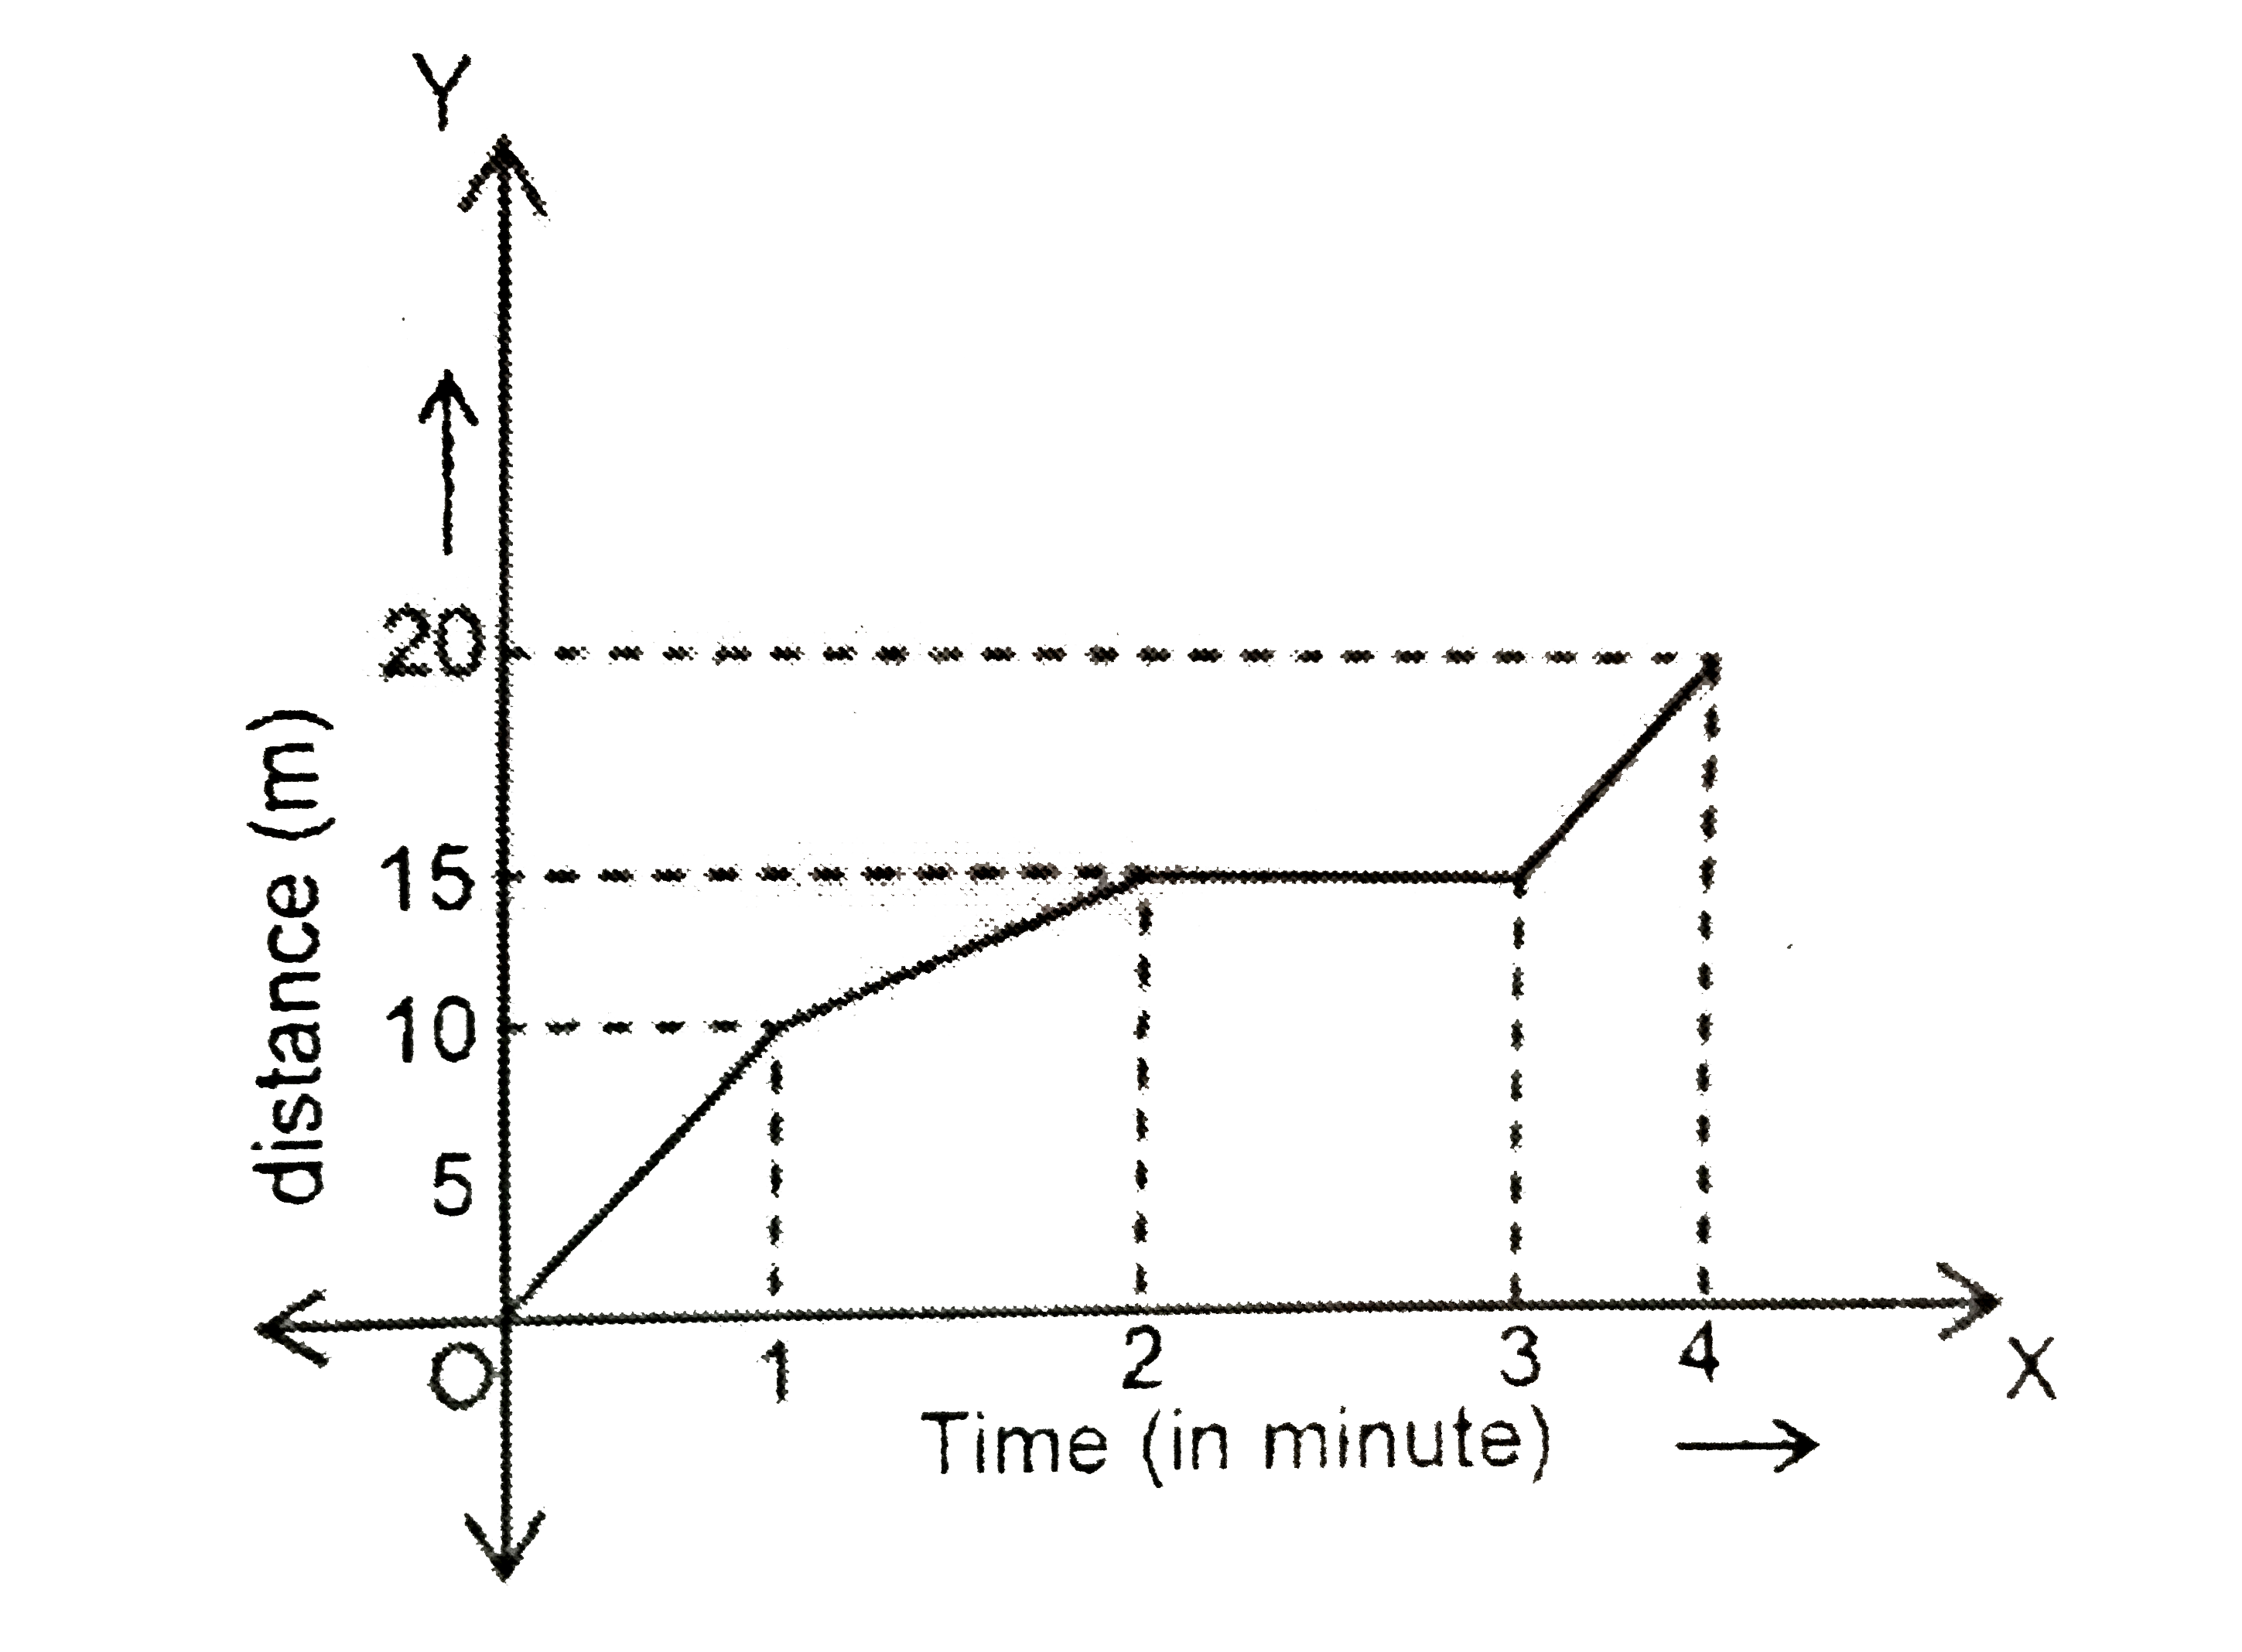
Distance versus time graph of an object is as shown in the figure. The average speed of the object is _____ ms−1
 A0.08B0.5C1D2
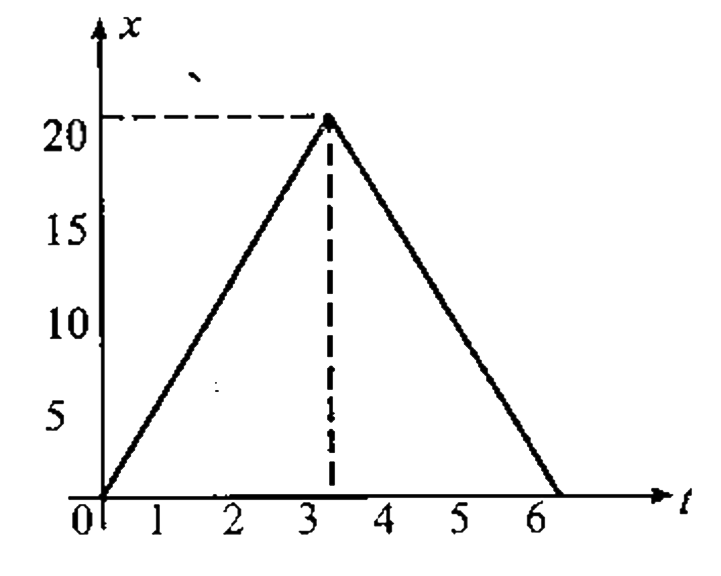
For the displacement time graph shown in figure -1.100, the ratio of the speeds during the first two seconds and the next four second is :
 A1:1B1:2C2:1D3:2
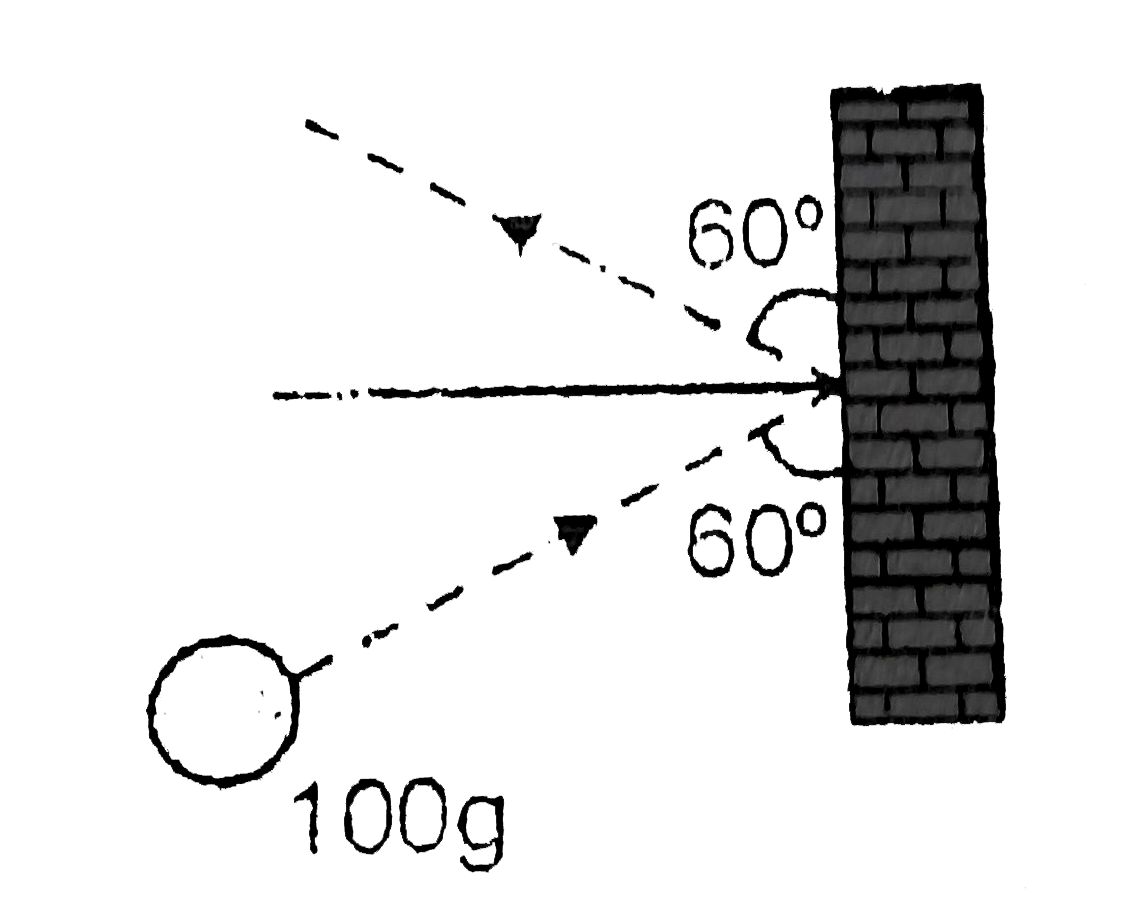
A mass of 100 g strikes the wall with speed 5m/s at an angle as shown in figure and it rebounds with the same speed it the contact time is 2×10⁻³sec. What is the force applied on the mass by the wall :
 A250√3 N to rightB250 N to rightC250√3 N to leftD250 N to left
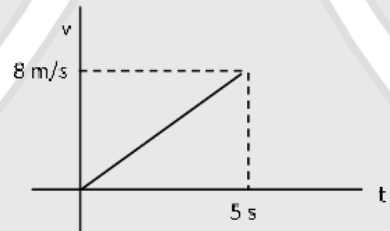
Speed time graph of a particle shown in figure. Find distance travelled by particle in 5second.
View SolutionCalculate the net emf across A and B shown in Figure 1 below

View SolutionA good photographic print is obtained by an exposure of two seconds at a distance of 20 cm from the lamp. Calculate the time of exposure required to get an equally good result at a distance of 40 cm.
View SolutionA good photographic print is obtained by an exposure of two seconds at a distance of 20 cm from the lamp. Calculate the time of exposure required to get an equally good result at a distance of 40 cm.
View SolutionThe distance measured between two points on a map is 2 cm. The corresponding distance on an aerial photograph is 10 cm. Calculate the scale of the photograph when the scale of the map is 1: 50,000. Ans.
View Solution
