Show the shape of the distance-time graph for the motion in the following cases:
A car moving with a constant speed.
To show the shape of the distance-time graph for a car moving with a constant speed, we can follow these steps:
1. Understand the Concept of Constant Speed:
- When a car is moving with a constant speed, it means that it covers equal distances in equal intervals of time.
2. Use the Formula for Speed:
- The formula for speed is given by:
Speed=DistanceTime
- Rearranging this gives us:
Distance=Speed×Time
3. Proportional Relationship:
- Since speed is constant, distance is directly proportional to time. This means if time increases, distance increases at a constant rate.
4. Graph Representation:
- On a distance-time graph, we plot distance on the y-axis and time on the x-axis.
- Because distance is directly proportional to time, the graph will be a straight line.
5. Identify the Characteristics of the Graph:
- The straight line will start from the origin (0,0) because when time is zero, distance is also zero.
- The slope of the line represents the speed of the car. A steeper slope indicates a higher speed, while a gentler slope indicates a lower speed.
6. Draw the Graph:
- Draw a straight line starting from the origin (0,0) and extending upwards to the right. This line represents the distance covered by the car over time.
Final Graph:
- The distance-time graph for a car moving with constant speed is a straight line that starts from the origin and moves upwards.
- When a car is moving with a constant speed, it means that it covers equal distances in equal intervals of time.
- The formula for speed is given by:
Speed=DistanceTime
- Rearranging this gives us:
Distance=Speed×Time
- Since speed is constant, distance is directly proportional to time. This means if time increases, distance increases at a constant rate.
- On a distance-time graph, we plot distance on the y-axis and time on the x-axis.
- Because distance is directly proportional to time, the graph will be a straight line.
- The straight line will start from the origin (0,0) because when time is zero, distance is also zero.
- The slope of the line represents the speed of the car. A steeper slope indicates a higher speed, while a gentler slope indicates a lower speed.
- Draw a straight line starting from the origin (0,0) and extending upwards to the right. This line represents the distance covered by the car over time.
- The distance-time graph for a car moving with constant speed is a straight line that starts from the origin and moves upwards.
Topper's Solved these Questions
Similar Questions
Knowledge Check
- Question 1 - Select One
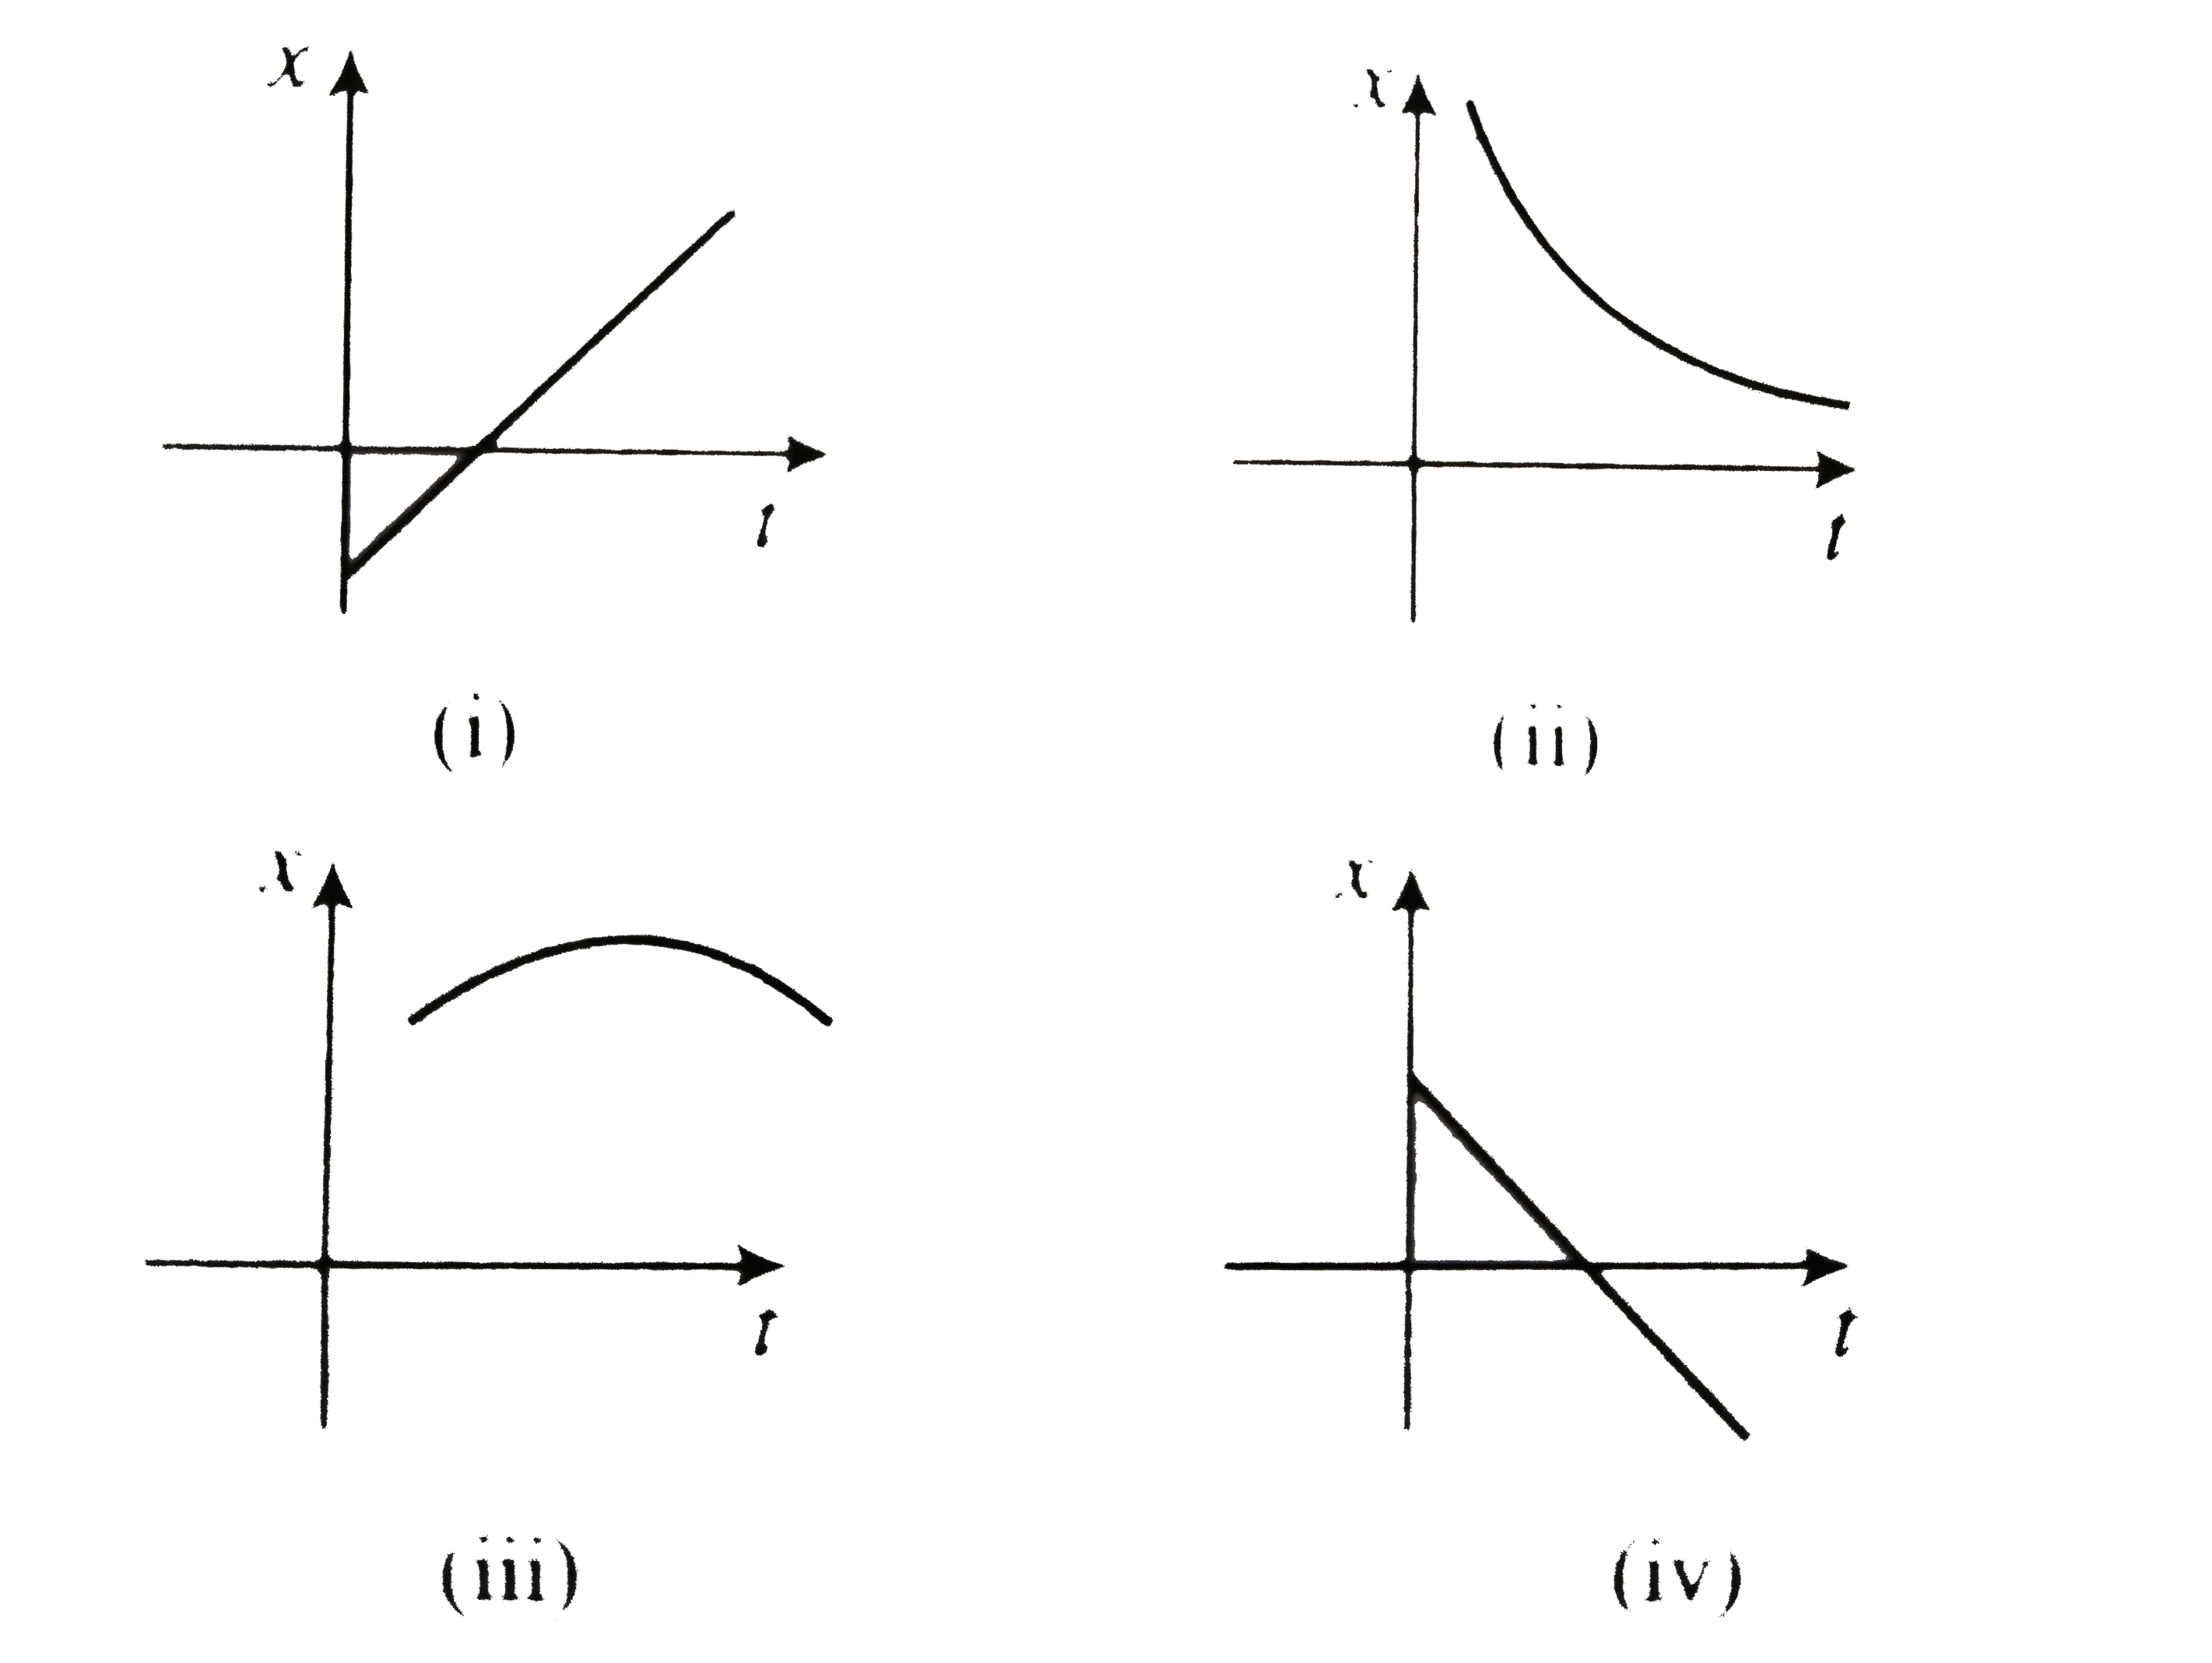
Study the following graph:

The particle is moving with constant speed .AIn graph (i) and (iii)BIn graph (i) and (iv)CIn graph (i) and (ii)DIn graph (i) - Question 2 - Select One
The graph of distance -time graph for uniform motion for an object is
Astraight lineBcurved lineCfirst straight line then curved lineDNone of these - Question 3 - Select One
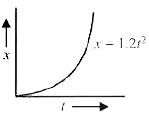
Given figure shows the distance-time graph of the motion of a car. It follows from the,| graph that the car is
 Aat restBin uniform motionCin non-uniform accclerationDunifommly accelerated.
The distance-time graph of the motion of an object moving with a contant speed is a straight line.
View SolutionThe distance-time graph of the motion of an object moving with a contant speed is a straight line.
View SolutionDraw a distance-time graph to show the motion of a car moving with a speed which is not constant (non-uniform speed).
View SolutionA car parked on road draw the shape of distance-time graph for it.
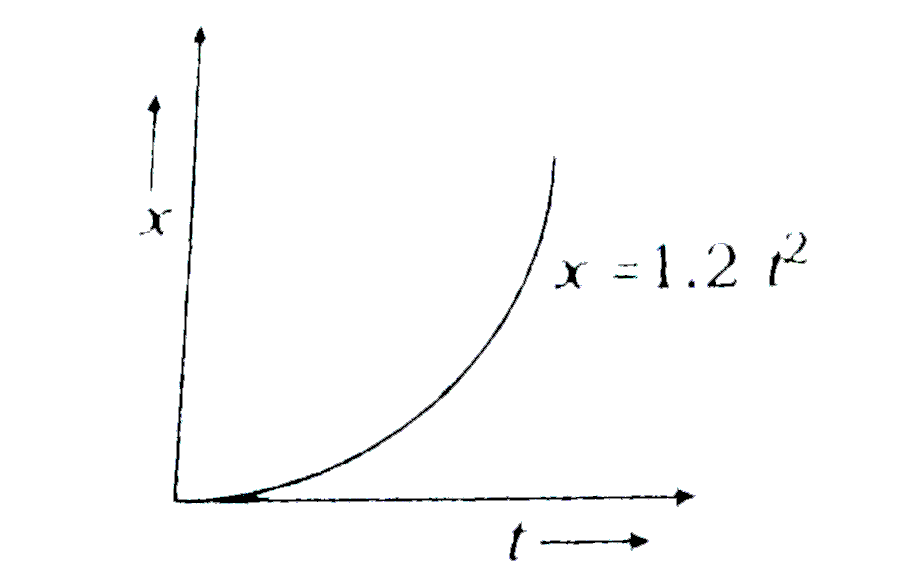
View SolutionFigure given shows the distance - time graph of the motion of a car. It follows from the graph that the car is
 View Solution

