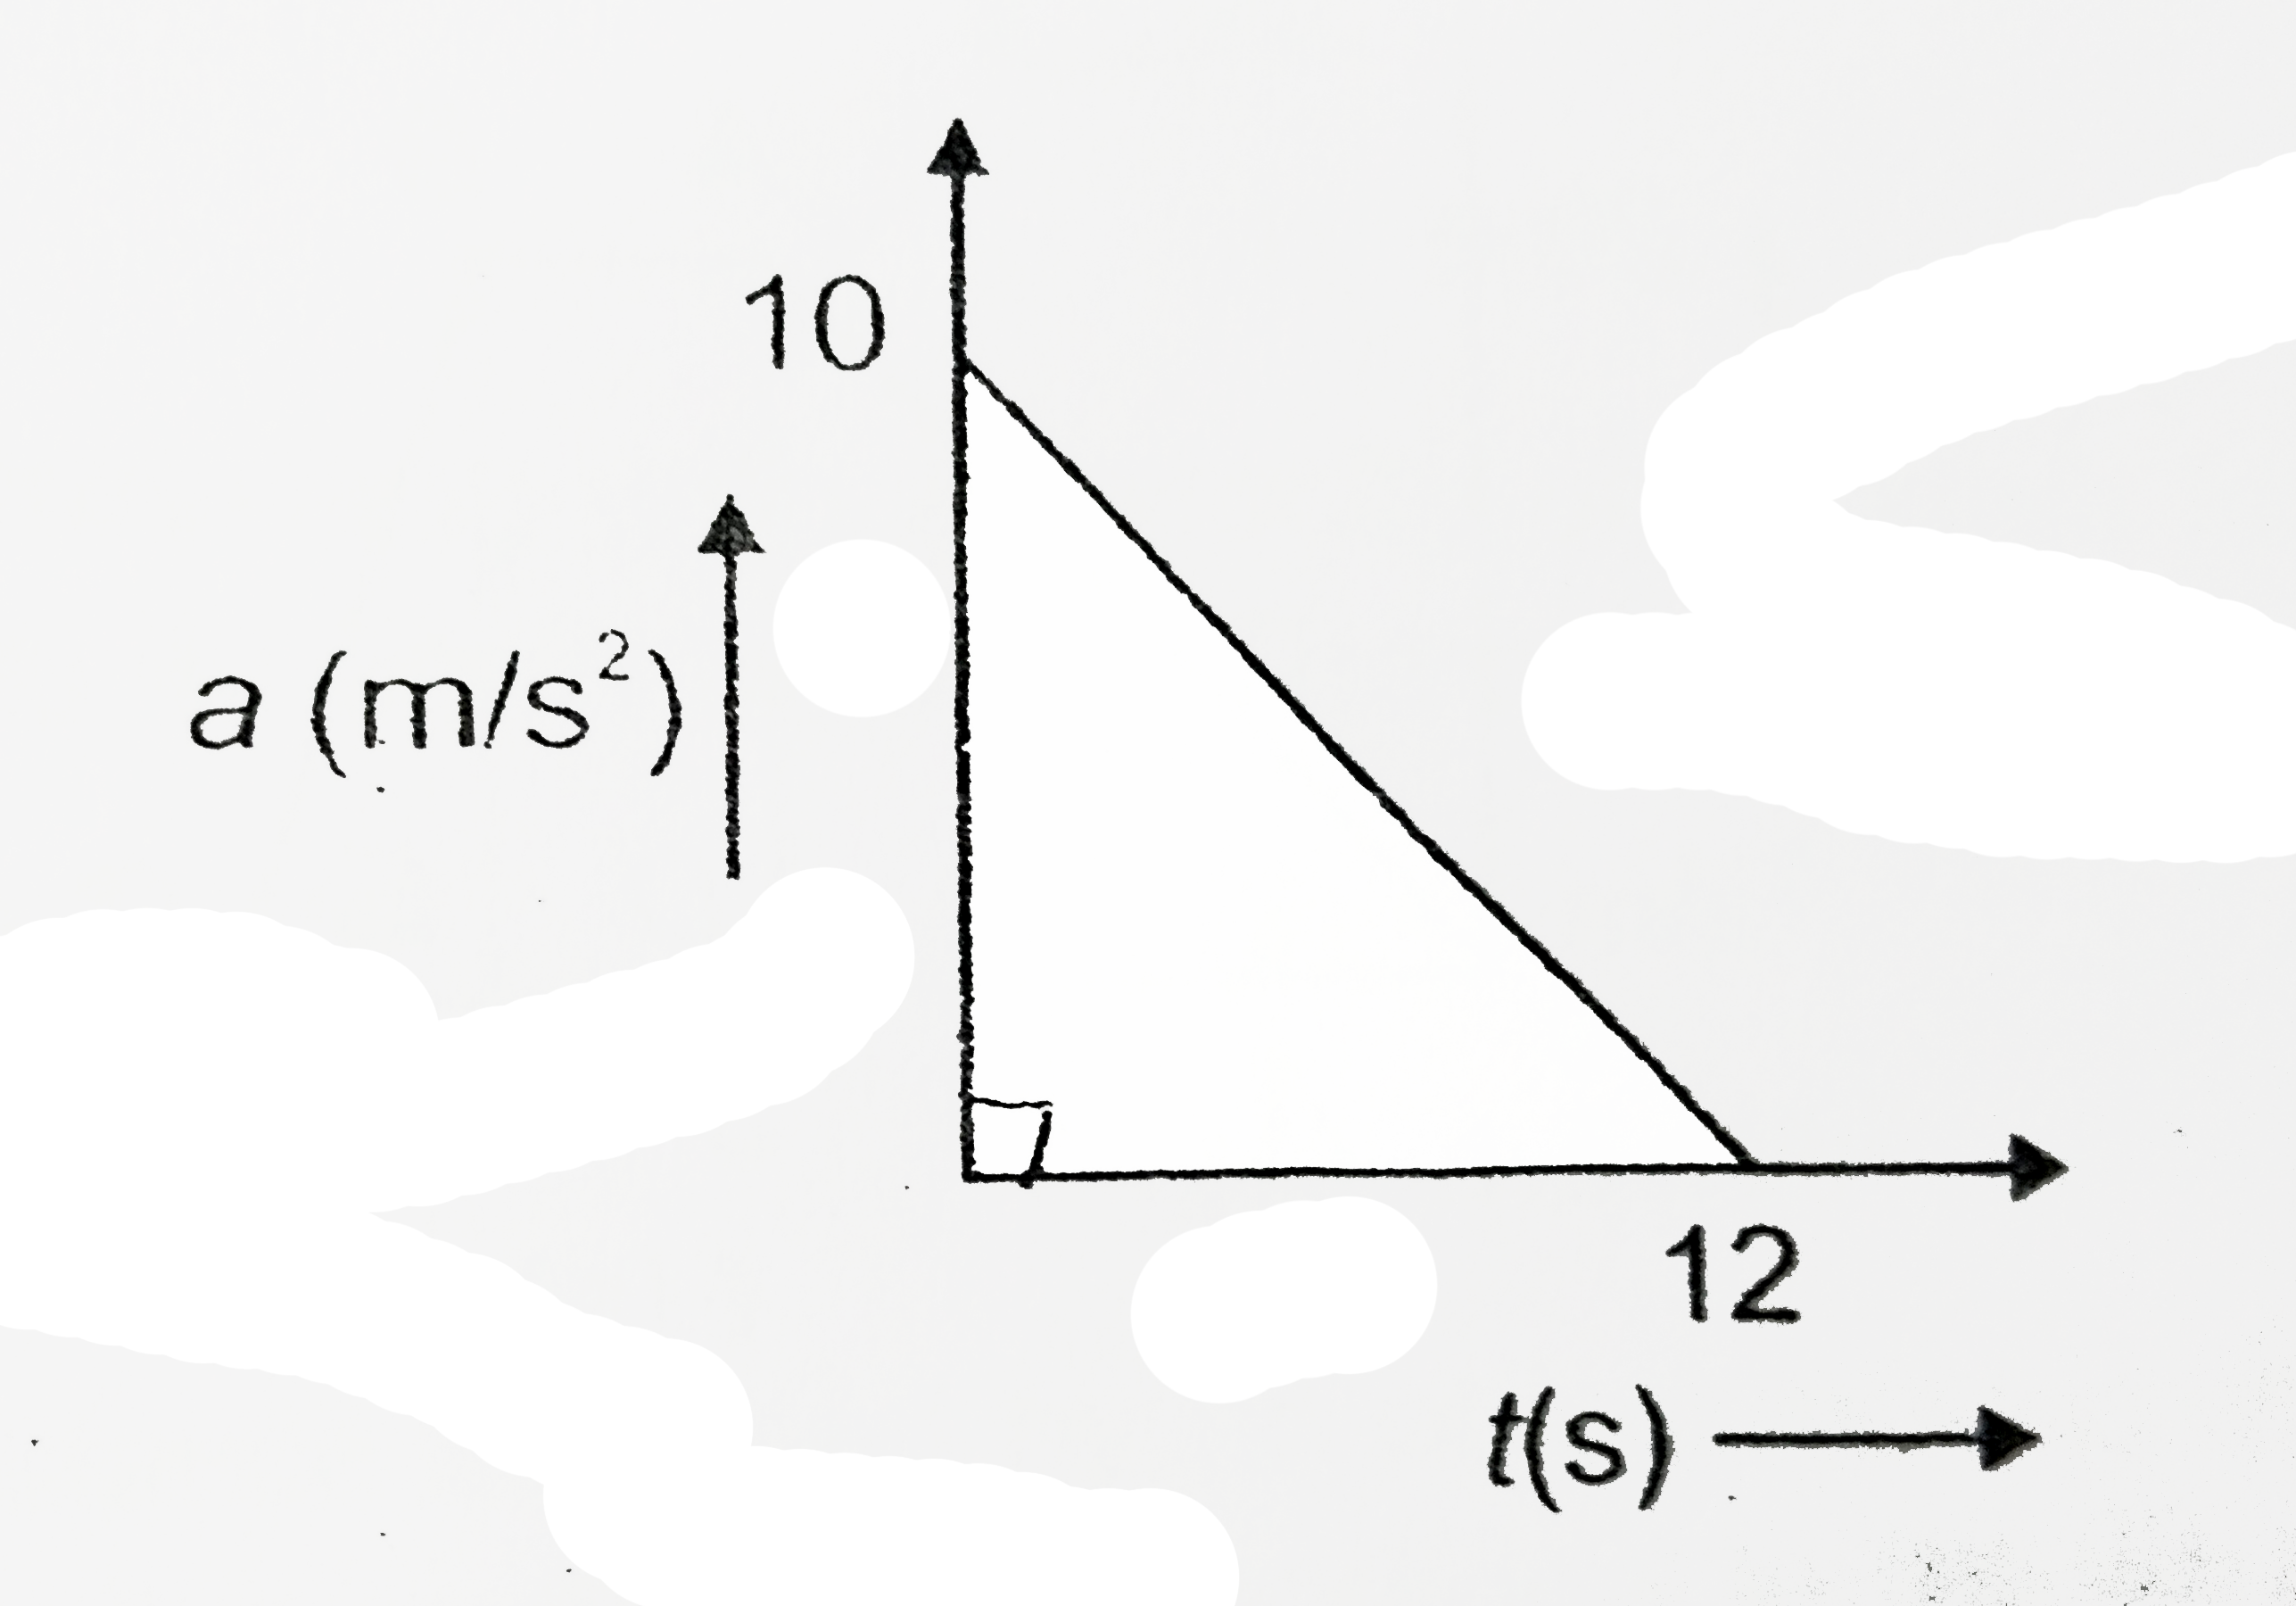
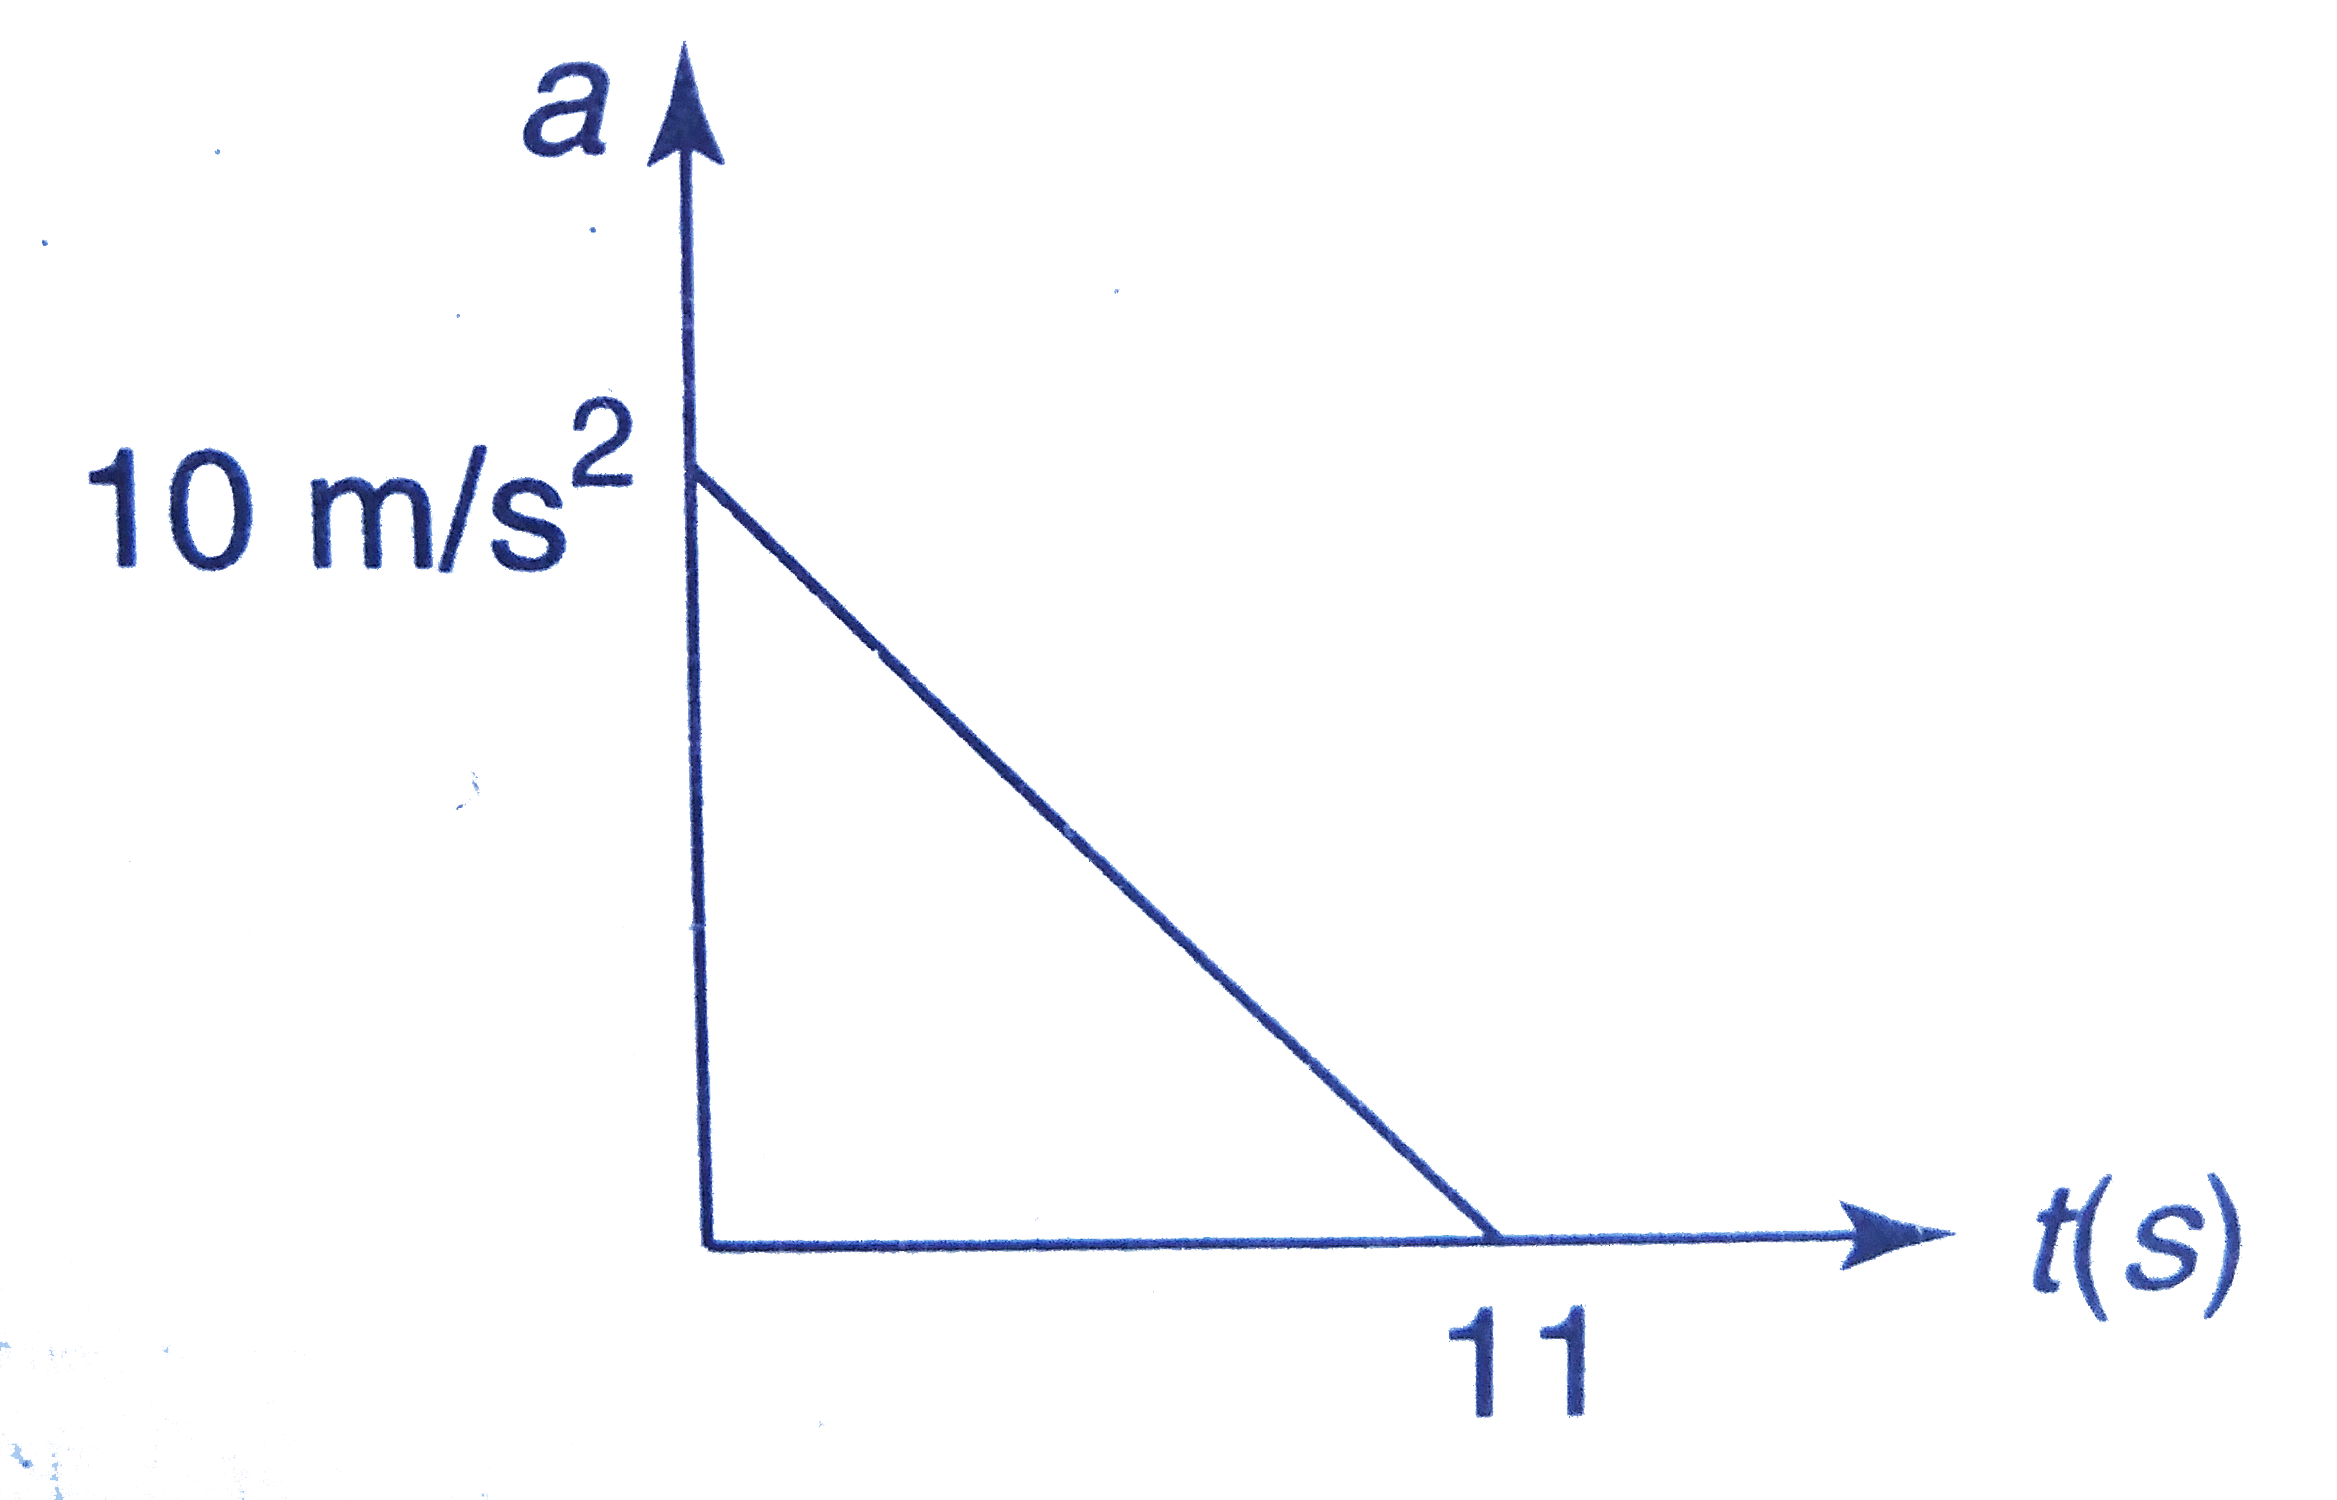
The a -t graph is shown in the figure. The maximum velocity attained by the body from rest will be

Area under acceleration -time graph gives change in velocity
Similar Questions
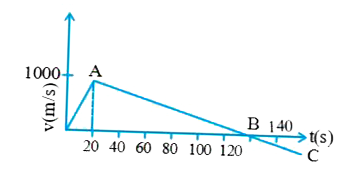
A rocket is projected vertically upwards and its time velocity graph is shown in the figure-1.115. The maximum height attained by the rocket is :
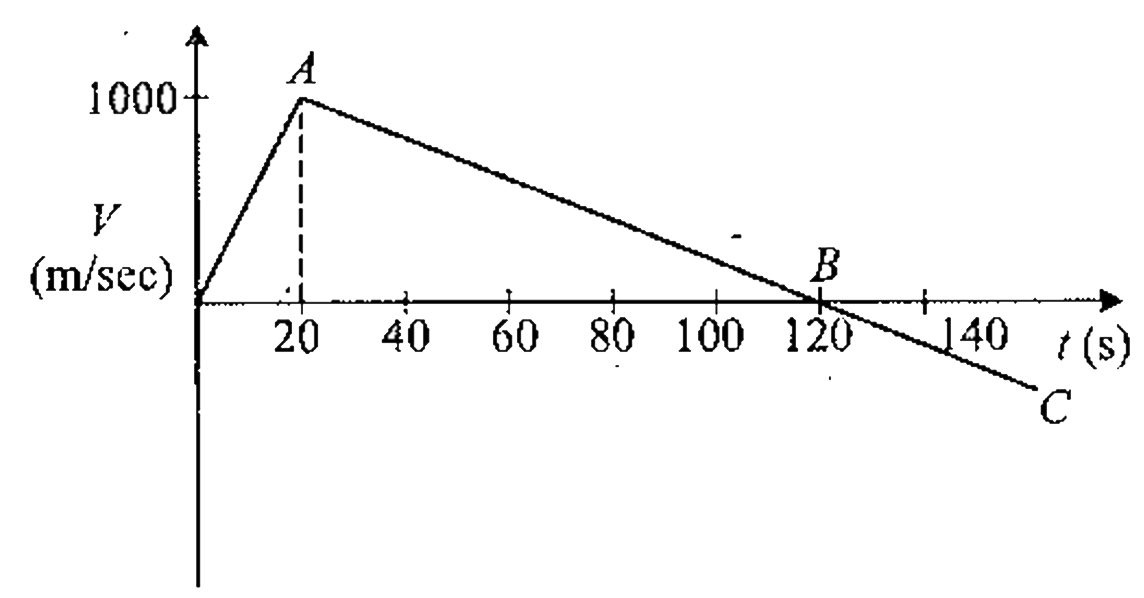
View SolutionA rocket is launched upward from the earth surface whose velocity time graph shown in figure. Then maximum height attained by the rocket is :
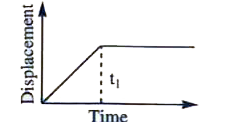
View SolutionThe x-t graph shown in figure represents

View SolutionThe x-t graph shown in figure represents.
View SolutionA particle starting from rest undergoes a rectilinear motion with acceleration a. The variation of a with time t is shown below. The maximum velocity attained by the particle during its motion is
View SolutionA particle starting from rest. Its acceleration (a) versus time (t) is as shown in the figure.
The maximum speed of the particle will be.
View SolutionA particle starting from rest. Its acceleration (a) versus time (t) is as shown in the figure.
The maximum speed of the particle will be.

View SolutionA car accelerates from rest with 2ms−2 for 2s and then decelerates constantly with 4ms−2 for t0 second to come to rest. The graph for the motion is shown in figure.

a. Find the maximum speed attained by the car.
b. Find the value of t0.
View SolutionA body is projected vertically upwards from the surface of the earth with a velocity equal to half of escape velocity of the earth. If R is radius of the earth, maximum height attained by the body from the surface of the earth is
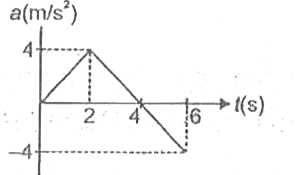
View SolutionFor the acceleration - time (a - t) graph shown in figure, the change in velocity of particle from t = 0 to t = 6 s is
View Solution
