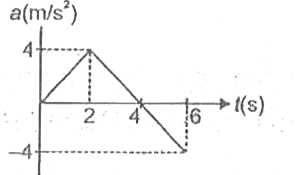
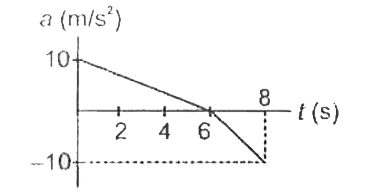
For the acceleration - time (a - t) graph shown in figure, the change in velocity of particle from t = 0 to t = 6 s is
10 m/s
4 m/s
12 m/s
8 m/s
The correct Answer is:B
Step by step video & image solution for For the acceleration - time (a - t) graph shown in figure, the change in velocity of particle from t = 0 to t = 6 s is by Physics experts to help you in doubts & scoring excellent marks in Class 12 exams.
Updated on:21/07/2023Topper's Solved these Questions
- MOTION IN A STRAIGHT LINEBOOK - AAKASH INSTITUTE ENGLISHCHAPTER - MOTION IN A STRAIGHT LINEEXERCISE - ASSIGNMENT (SECTION - B)
33 Videos
- MOTION IN A STRAIGHT LINEBOOK - AAKASH INSTITUTE ENGLISHCHAPTER - MOTION IN A STRAIGHT LINEEXERCISE - ASSIGNMENT (SECTION - C)
36 Videos
- MOTION IN A STRAIGHT LINEBOOK - AAKASH INSTITUTE ENGLISHCHAPTER - MOTION IN A STRAIGHT LINEEXERCISE - EXERCISE
29 Videos
- MOTION IN A PLANEBOOK - AAKASH INSTITUTE ENGLISHCHAPTER - MOTION IN A PLANEEXERCISE - Assignement section -J (Aakash Challengers Questions)
7 Videos
- MOTION IN STRAIGHT LINEBOOK - AAKASH INSTITUTE ENGLISHCHAPTER - MOTION IN STRAIGHT LINEEXERCISE - Assignment (SECTION - J)
2 Videos
Similar Questions
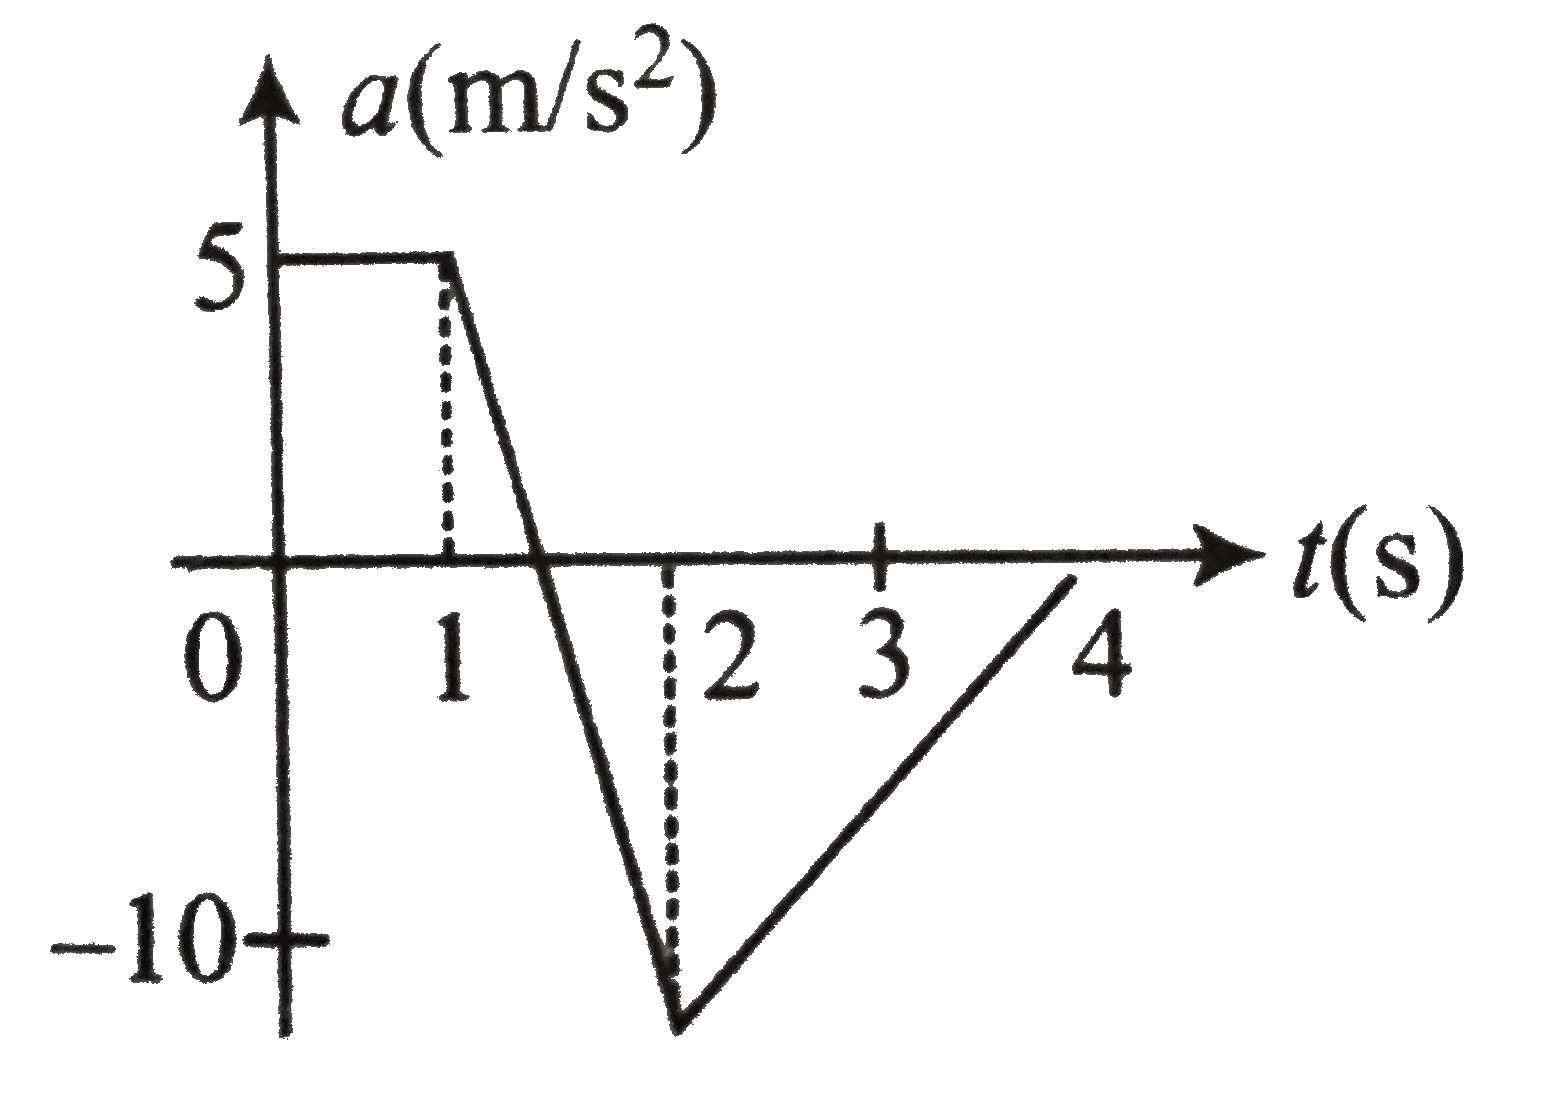
A particle moves vertically with an upwards initial speed v0=10.5ms−1. If its acceleration varies with time as shown in a-t graph in figure, find the velocity of the particles at t = 4s.
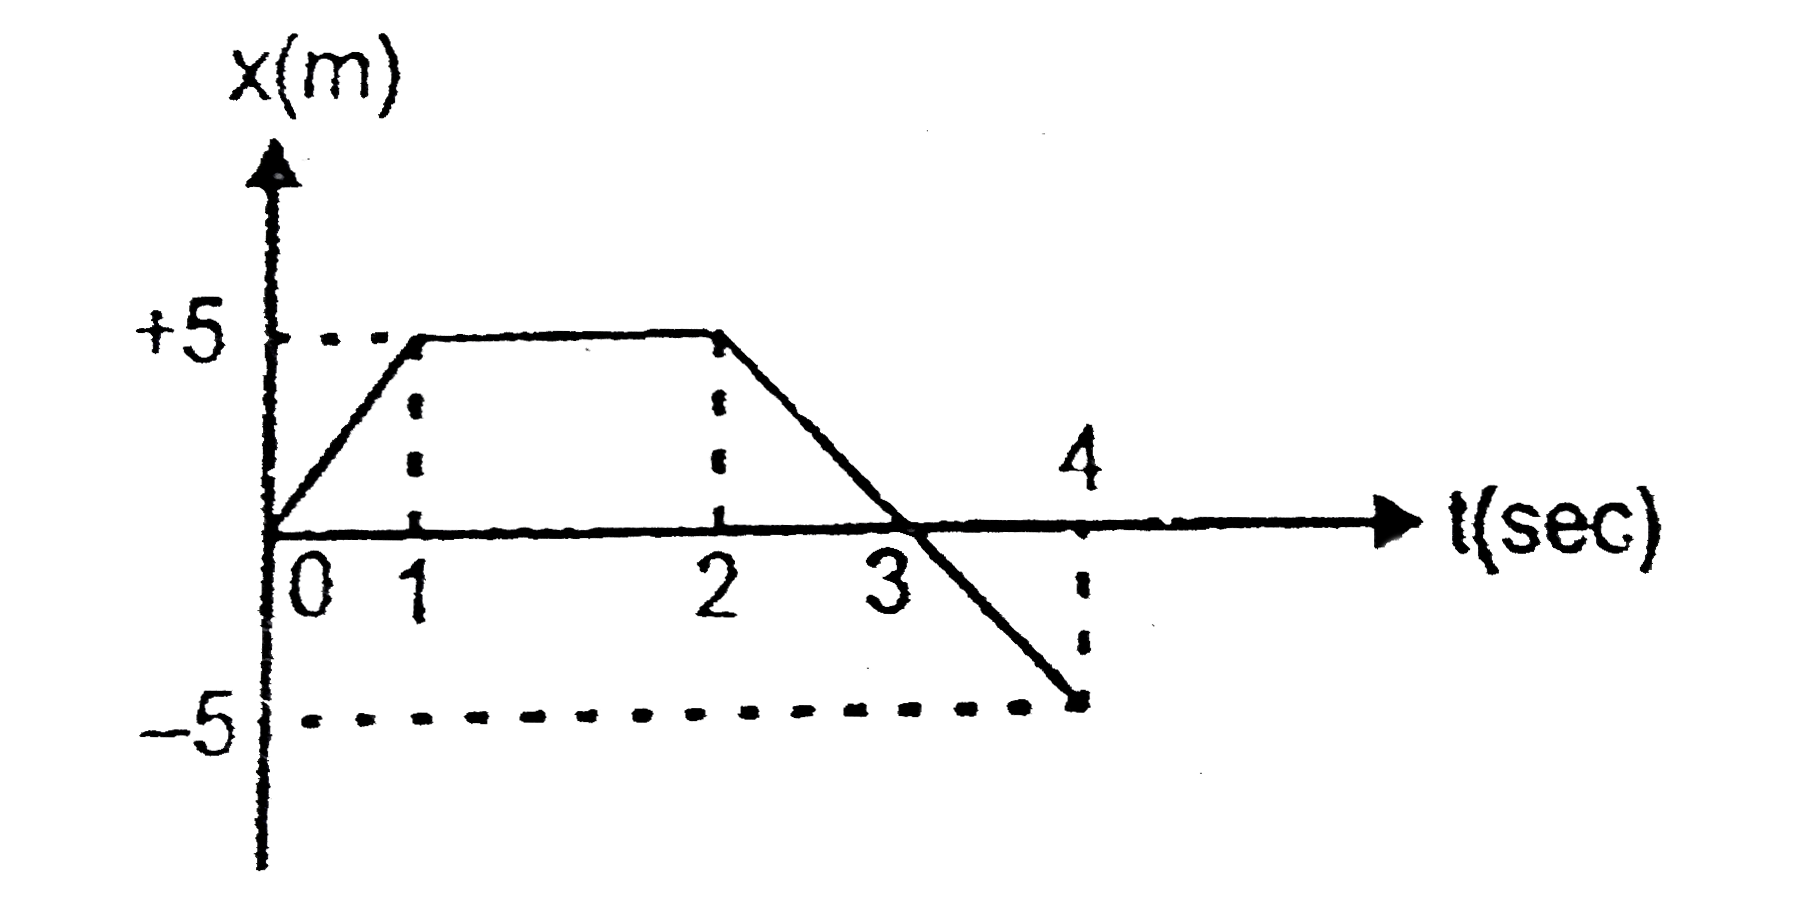
View SolutionPosition-time graph for a particle moving along x− direction is as shown in the figure. Average speed of the particle from t=0 to t=4 is :
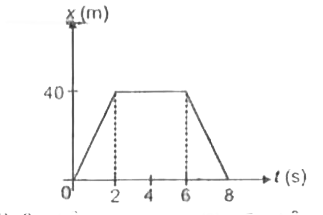
View SolutionThe position (x) of a particle moving along x - axis veries with time (t) as shown in figure. The average acceleration of particle in time interval t = 0 to t = 8 s is
View SolutionForce-time graph of a particle of mass 6 kg is shown in figure, then change in linear momentum during t = 0 to t = 10 s is
View SolutionThe acceleration - time graph for a particle moving along x - axis is shown in figure, If the initial velocity of particle is −5m/s, the velocity at t = 8 s is
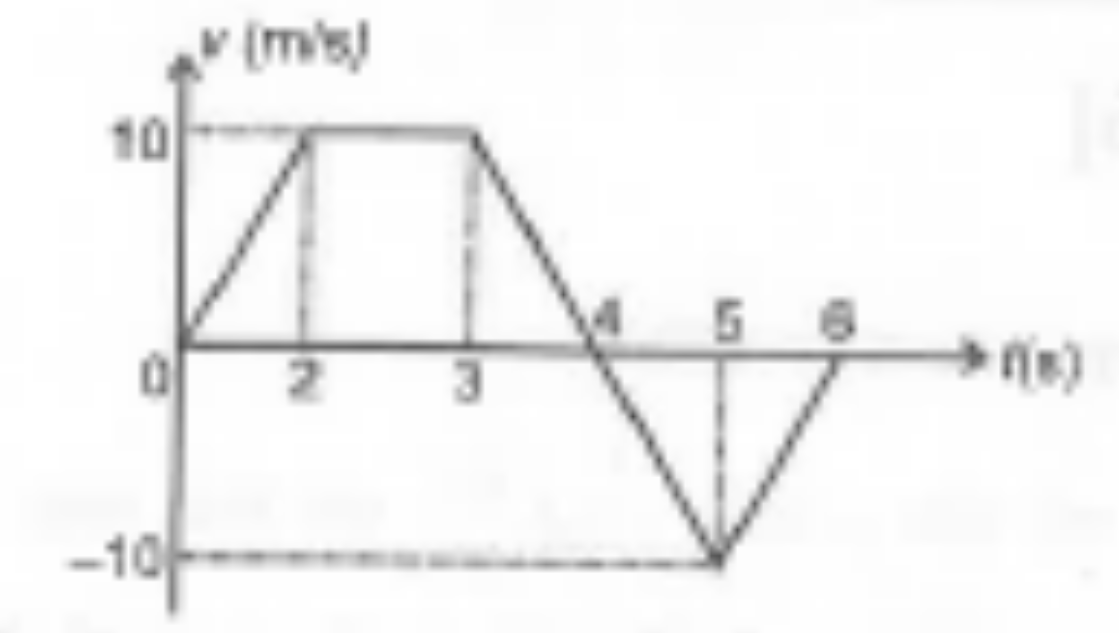
View SolutionThe velocity (v)-time (t) graph of a partide moving along a straight line is as shown in the figure. The displacement of the particle from t = 0 to t = 4 is
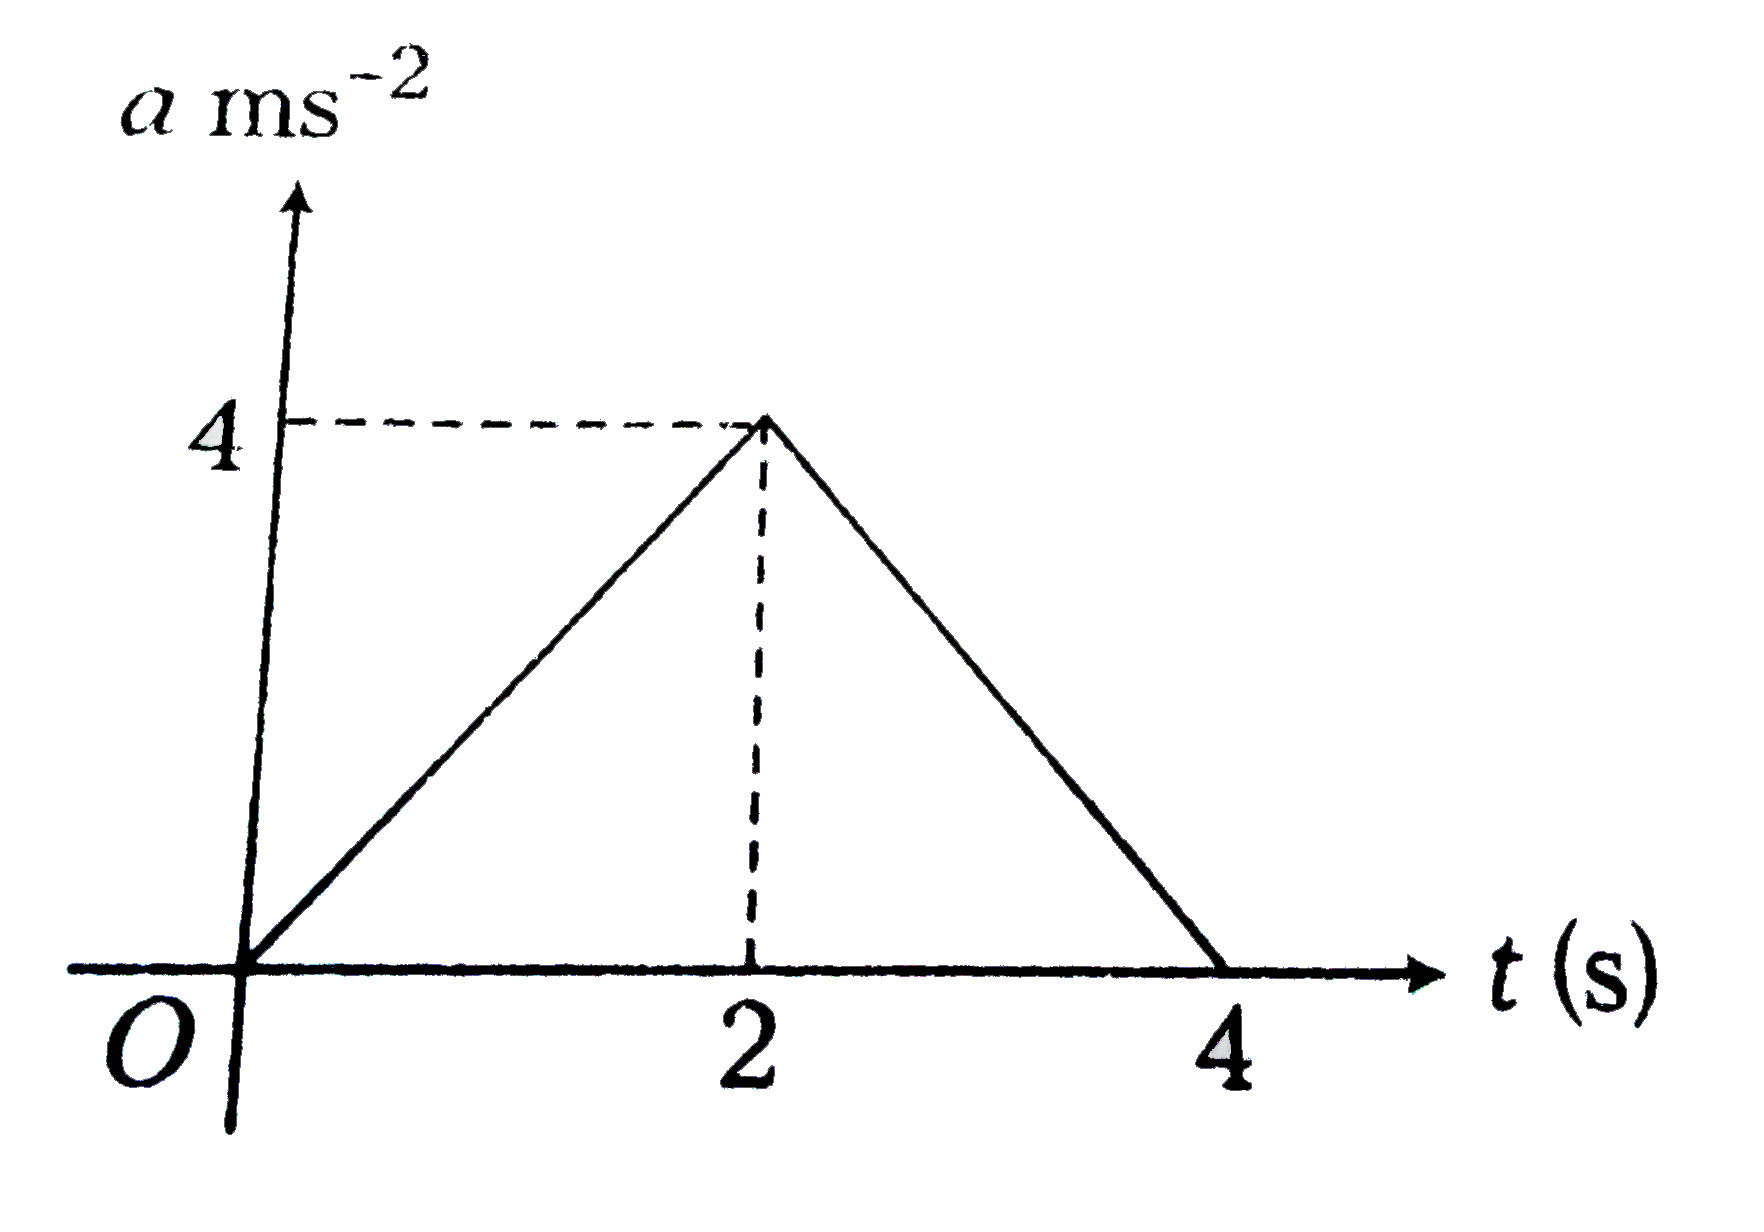
View SolutionAcceleration - time graph of a particle moving in a straight line is shown in figure. Velocity of particle at time t = 0 is 2ms−1. Find velocity at the end of fourth second.
View SolutionA body is performing simple harmonic motion with amplitude a and time period T variation of its acceleration (f) with time(t) is shown in figure If at time t velocity of the body is v which of the following graph is correct?
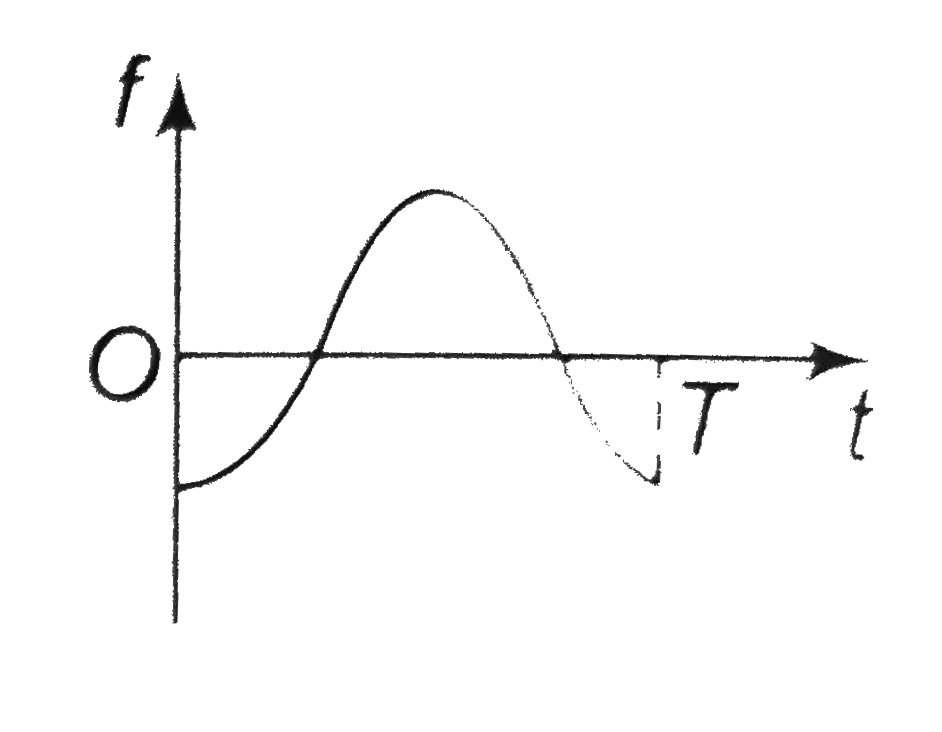
View SolutionA body is performing simple harmonic motion with amplitude a and time period T variation of its acceleration (f) with time(t) is shown in figure If at time t velocity of the body is v which of the following graph is correct?

View SolutionThe a -t graph is shown in the figure. The maximum velocity attained by the body from rest will be

View Solution
