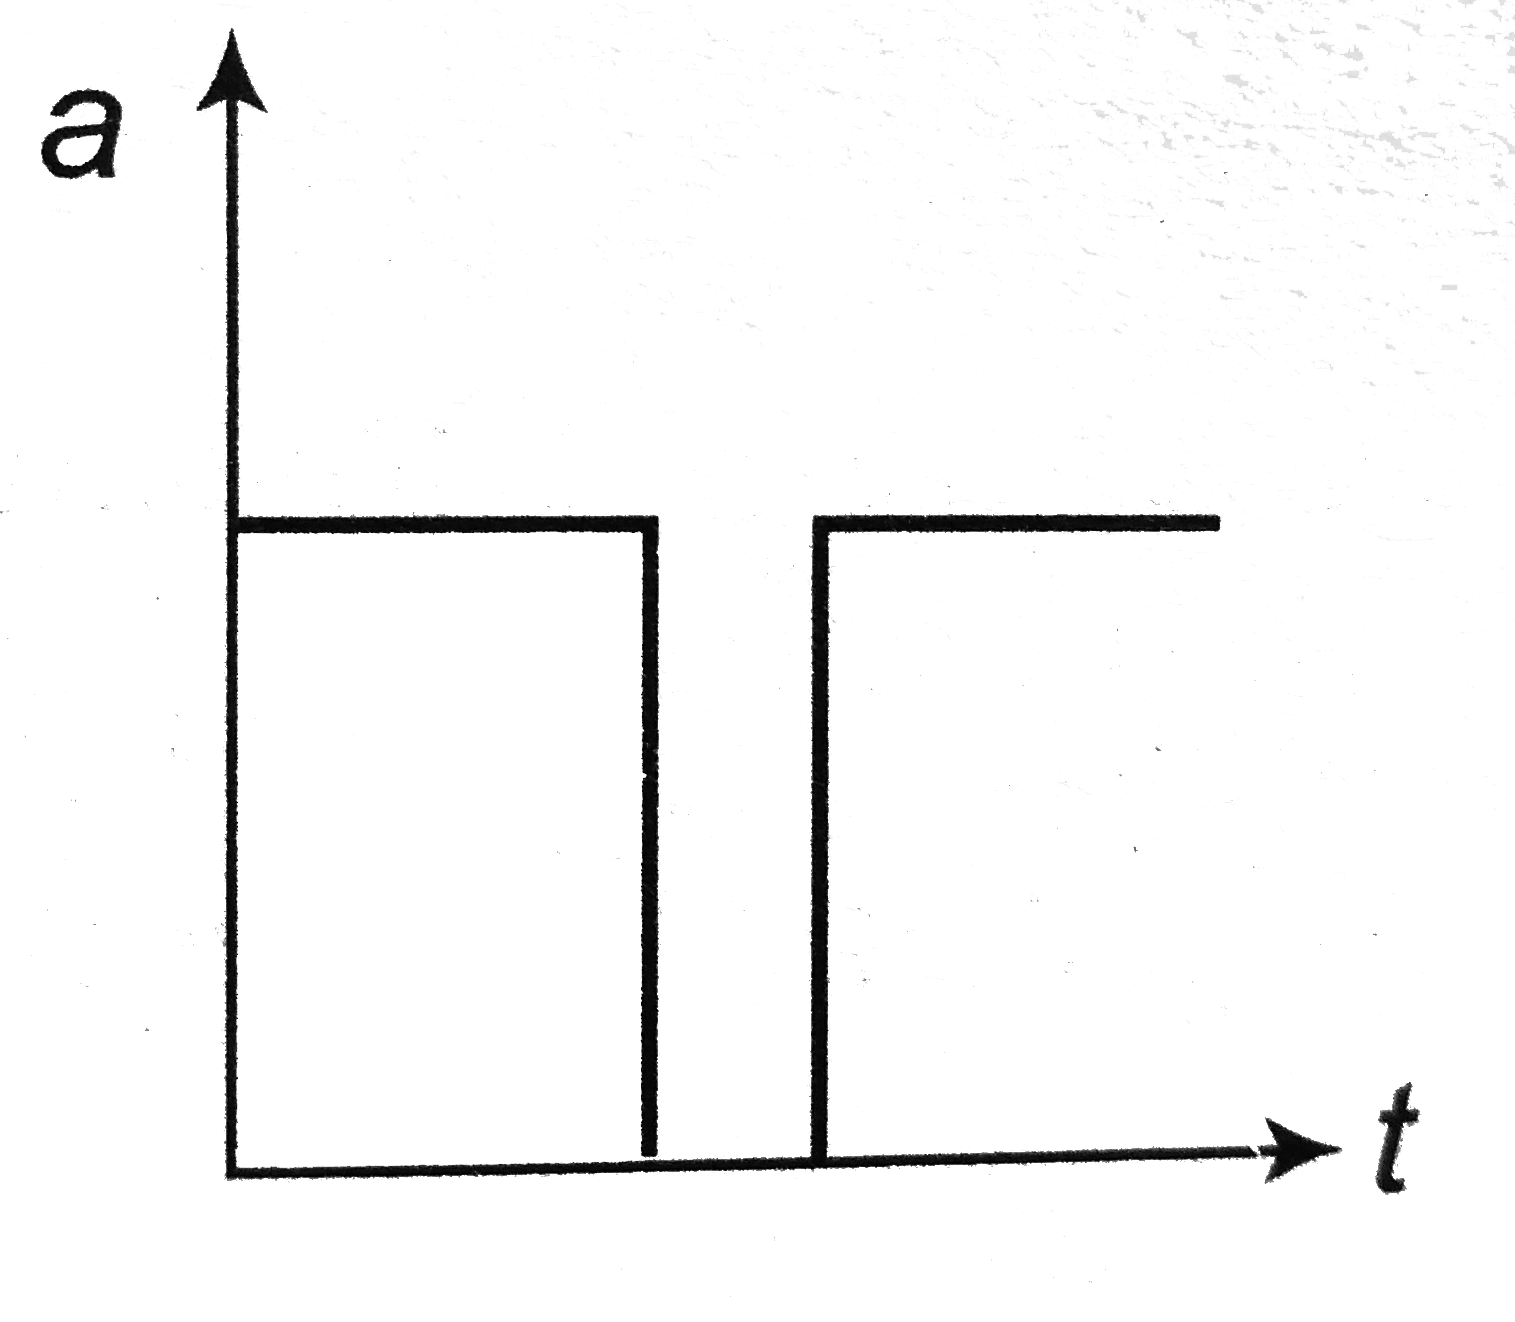
The acceleration-time graph for a body is shown in fig. Plot the corresponding velocity-time graph and draw the inference. The body starts with non-zero positive velocity.

Text Solution
The given figure shows that the acceleration a is a positive constant - it does not change with time. So, this represents a motion under uniform acceleration. Then on the velocity -time graph motion is given by a straight line of positive slope Fig. The velocity increases uniformly from the initial value u to the final value v at time t.

|
Topper's Solved these Questions
- ONE - DIMENSIONAL MOTION BOOK - CHHAYA PUBLICATIONCHAPTER - ONE - DIMENSIONAL MOTION EXERCISE - EXAMINATION ARCHIVE with solutions ( NEET)
1 Videos
- NEWTONIAN GRAVITATION AND PLANETARY MOTIONBOOK - CHHAYA PUBLICATIONCHAPTER - NEWTONIAN GRAVITATION AND PLANETARY MOTIONEXERCISE - CBSE SCANNER
19 Videos
- QUESTION PAPERS OF NEET -2017BOOK - CHHAYA PUBLICATIONCHAPTER - QUESTION PAPERS OF NEET -2017EXERCISE - QUESTION
32 Videos
Similar Questions
Knowledge Check
Acceleration-time graph of a body is shown. The corresponding velocity-time graph of the same body is.
 A2sB1sC32sD12s
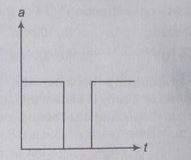
Acceleration time graph of a body is shown below the corresponding velocity time graph of the same body is
 A
A B
B C
C D
D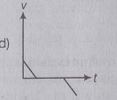
Acceleration time graph of a body is shown below the corresponding velocity time graph of the same body is
 A
A B
B C
C D
D
The velocity time graph of a body is shown in fig. it indicates that :
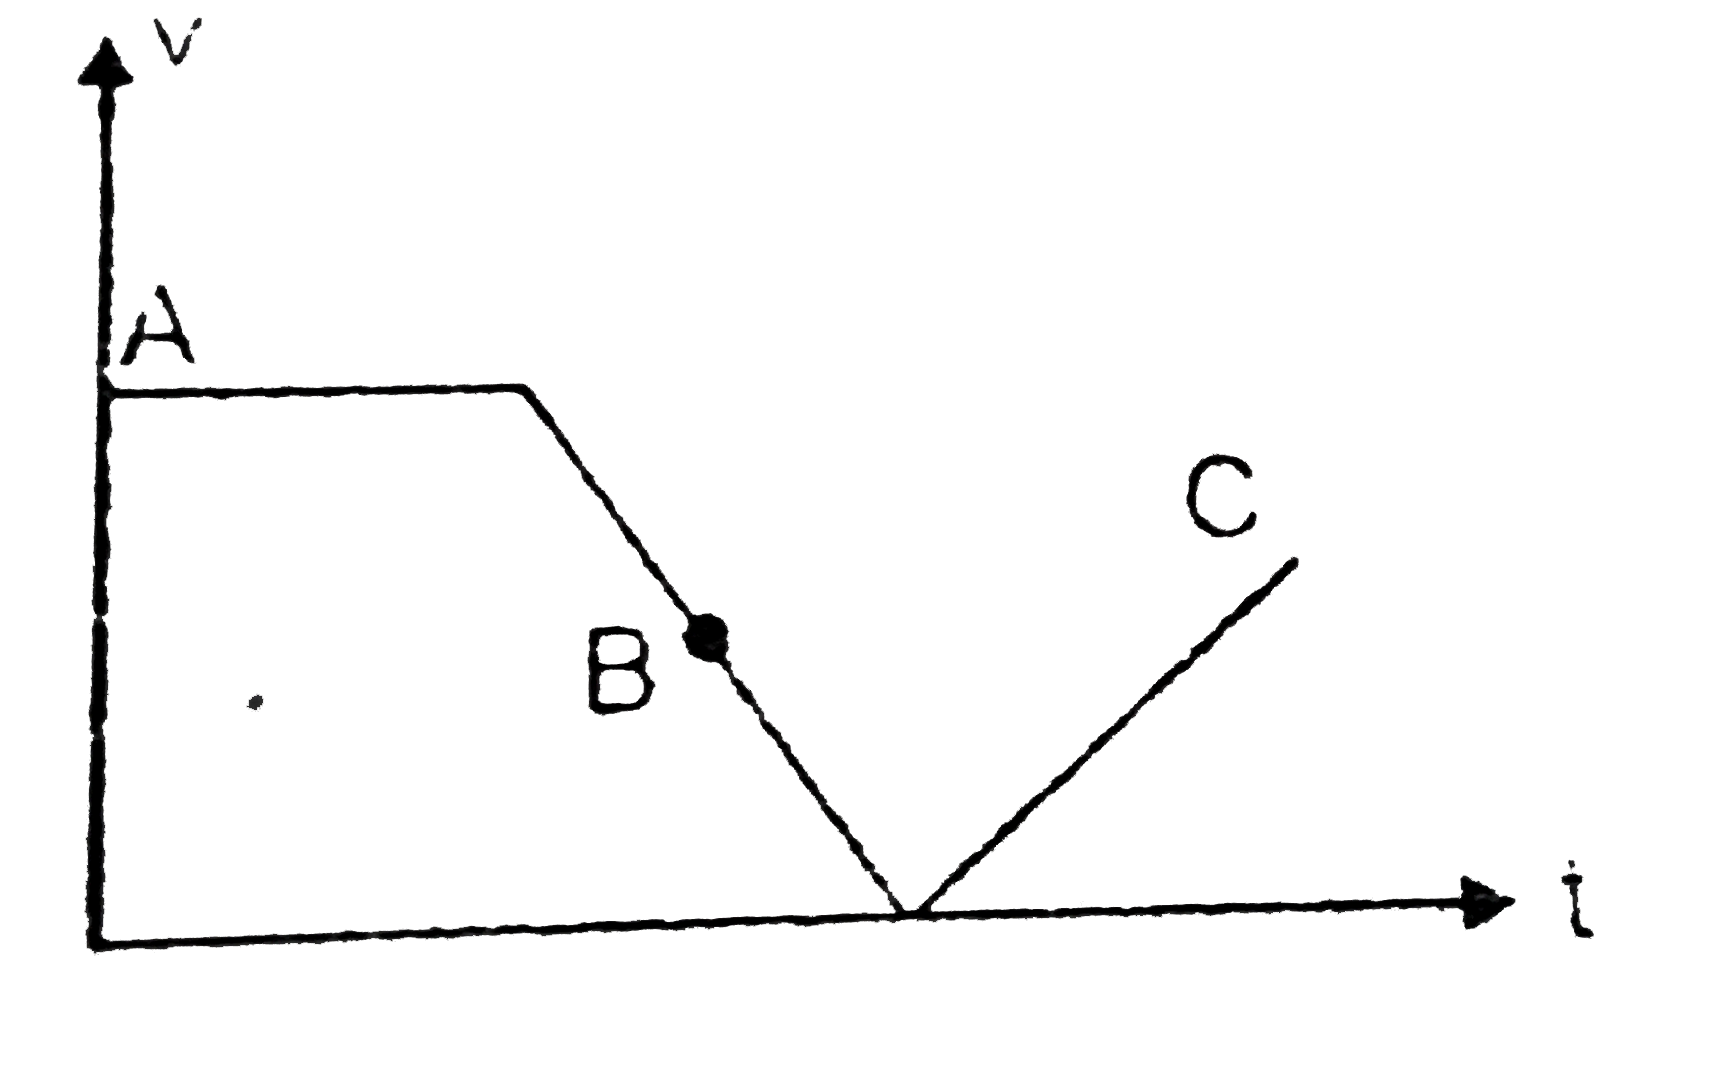
View SolutionThe velocity time graph of a body is shown in fig. it indicates that :

View SolutionThe displacement-time (x - t) graph of a body is given as
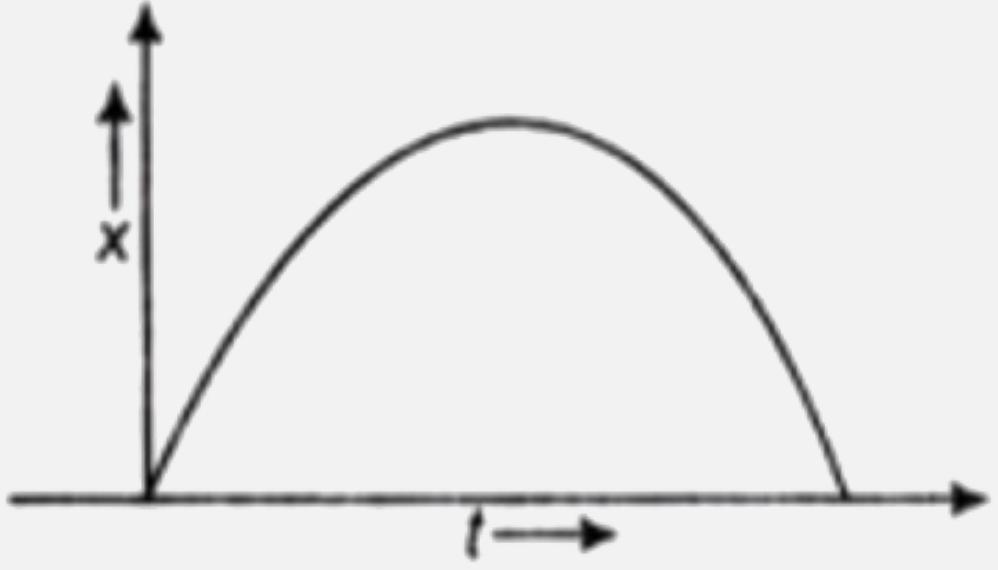
The corresponding velocity -time (v - t) graph will be
View SolutionThe displacement -time (x– t) graph of a body is given as
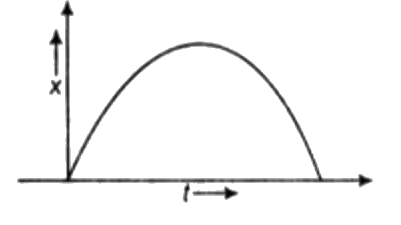
The corresponding velocity -time (v – t ) graph will be
View Solution
The acceleration time graph of a body is shown below the most probable velocity time graph of the body is
View Solution
