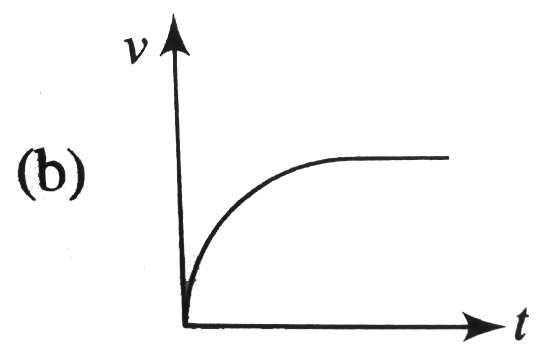
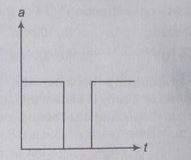
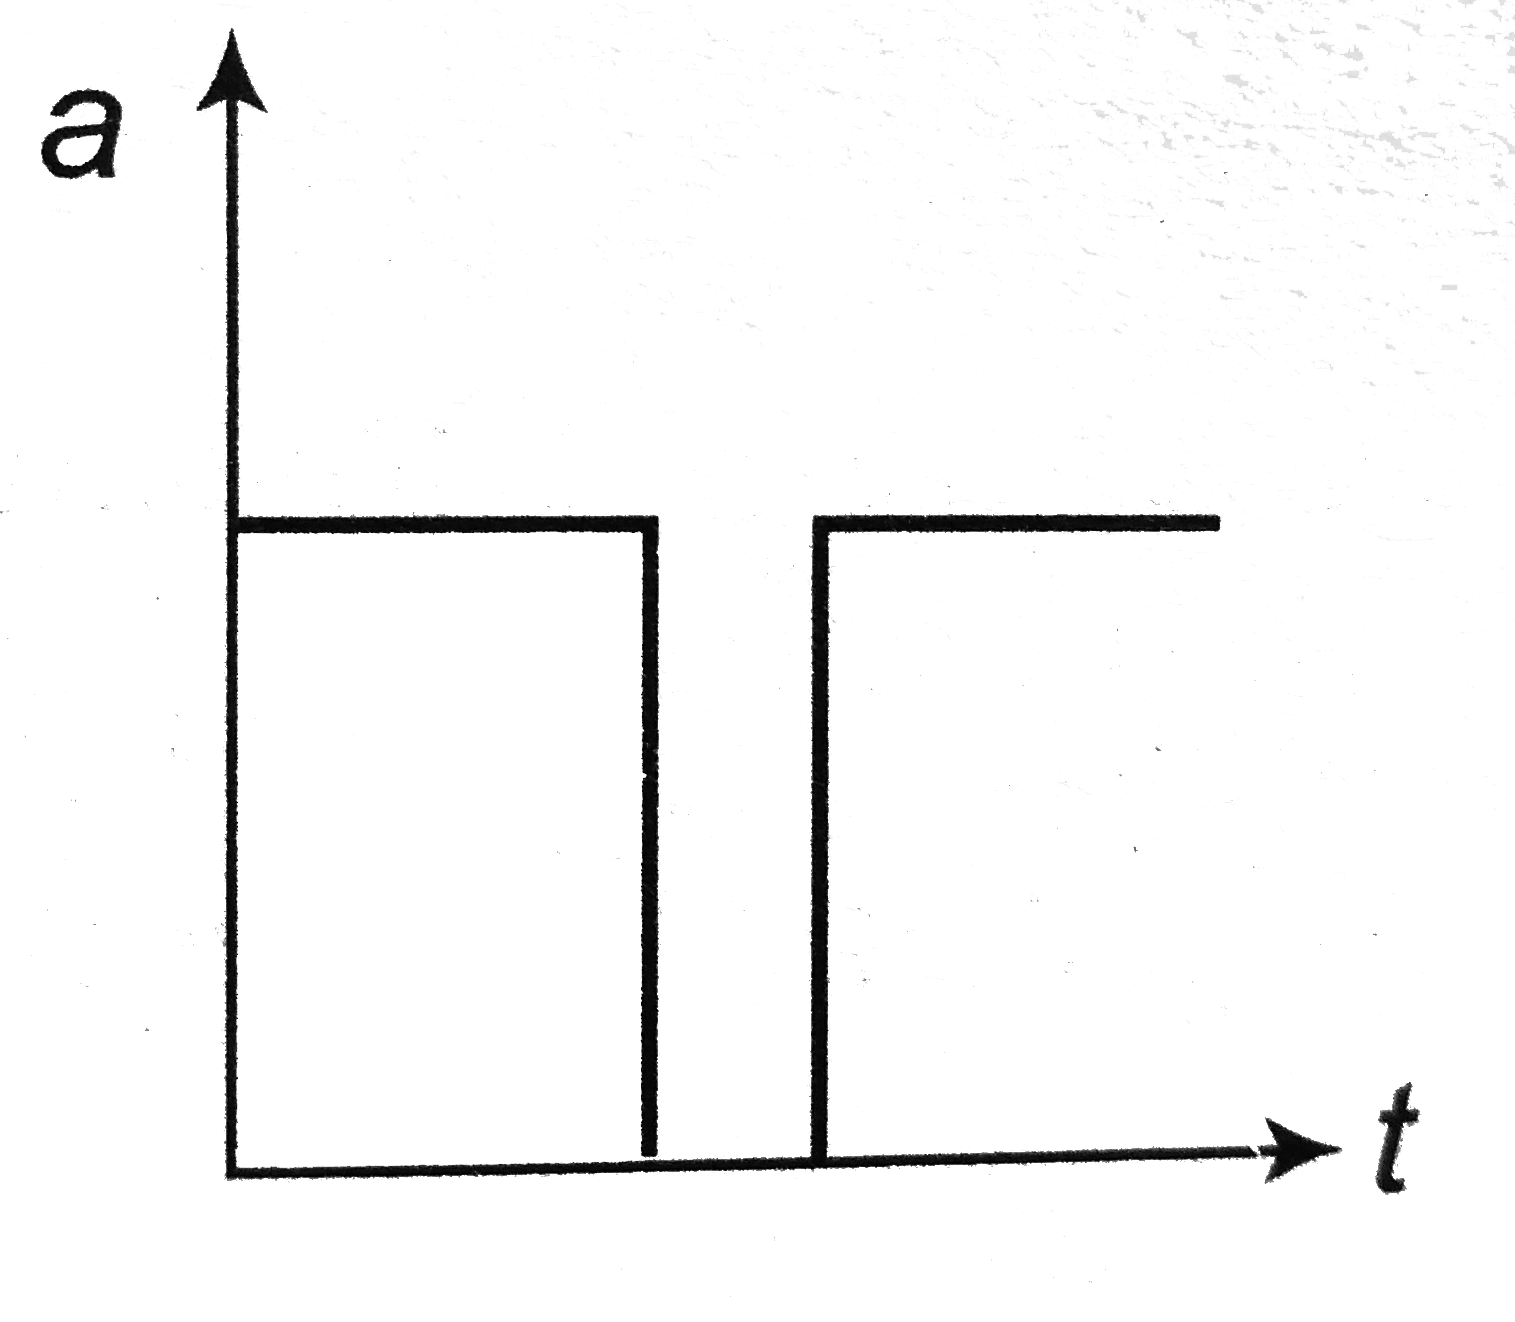
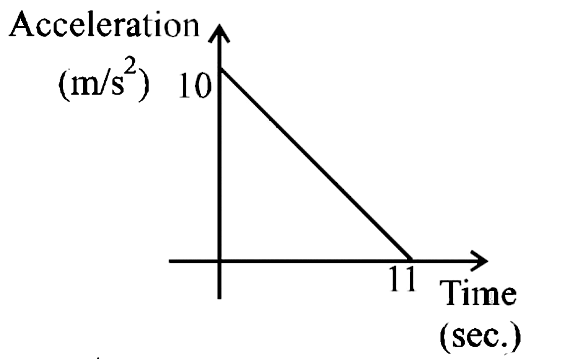
The acceleration time graph of a body is shown below the most probable velocity time graph of the body is
A

B
C

D

Video Solution
Text Solution
The correct Answer is:C
From given a-t graph it is clear that acceleration is increasing at constant rate
(constant)(by integration)
i.e., v is dependent on time parabolically and parabola is symmetric about v-axis. And suddenly acceleration becomes zero, i.e., velocity becomes constant.
Hence (c ) is most probable graph.
|
Updated on:21/07/2023
Similar Questions
Knowledge Check
- Question 1 - Select One
Acceleration time graph of a body is shown below the corresponding velocity time graph of the same body is
 A
A B
B C
C D
D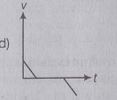
- Question 2 - Select One
Acceleration time graph of a body is shown below the corresponding velocity time graph of the same body is
 A
A B
B C
C D
D
- Question 3 - Select One
Acceleration-time graph of a body is shown. The corresponding velocity-time graph of the same body is.
 A2sB1sC32sD12s
The velocity time graph of a body is as showh in
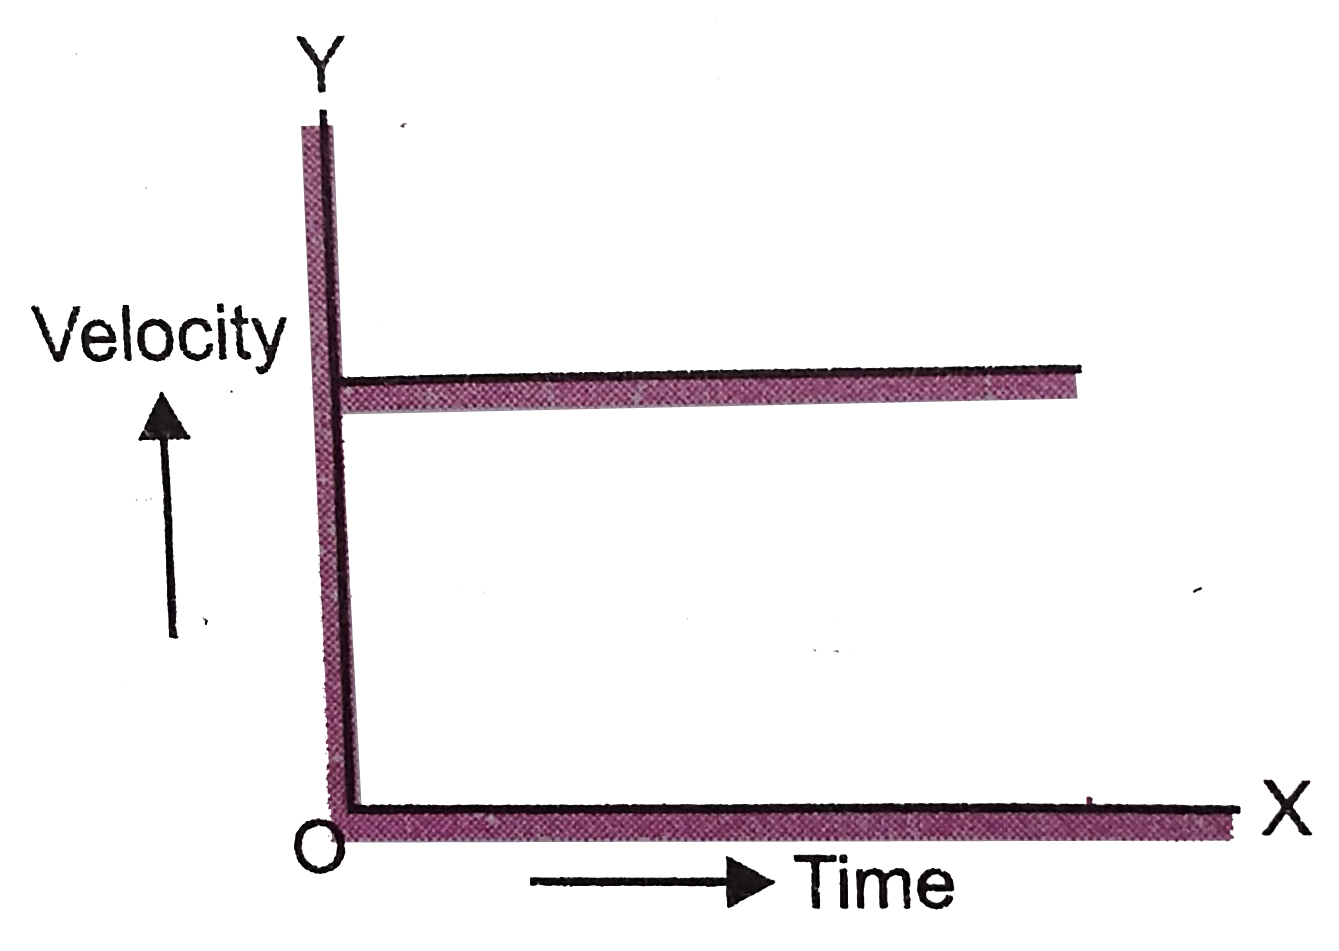
what would be the acceleration of the body ?View SolutionThe displacement-time graph of a body is shown in.
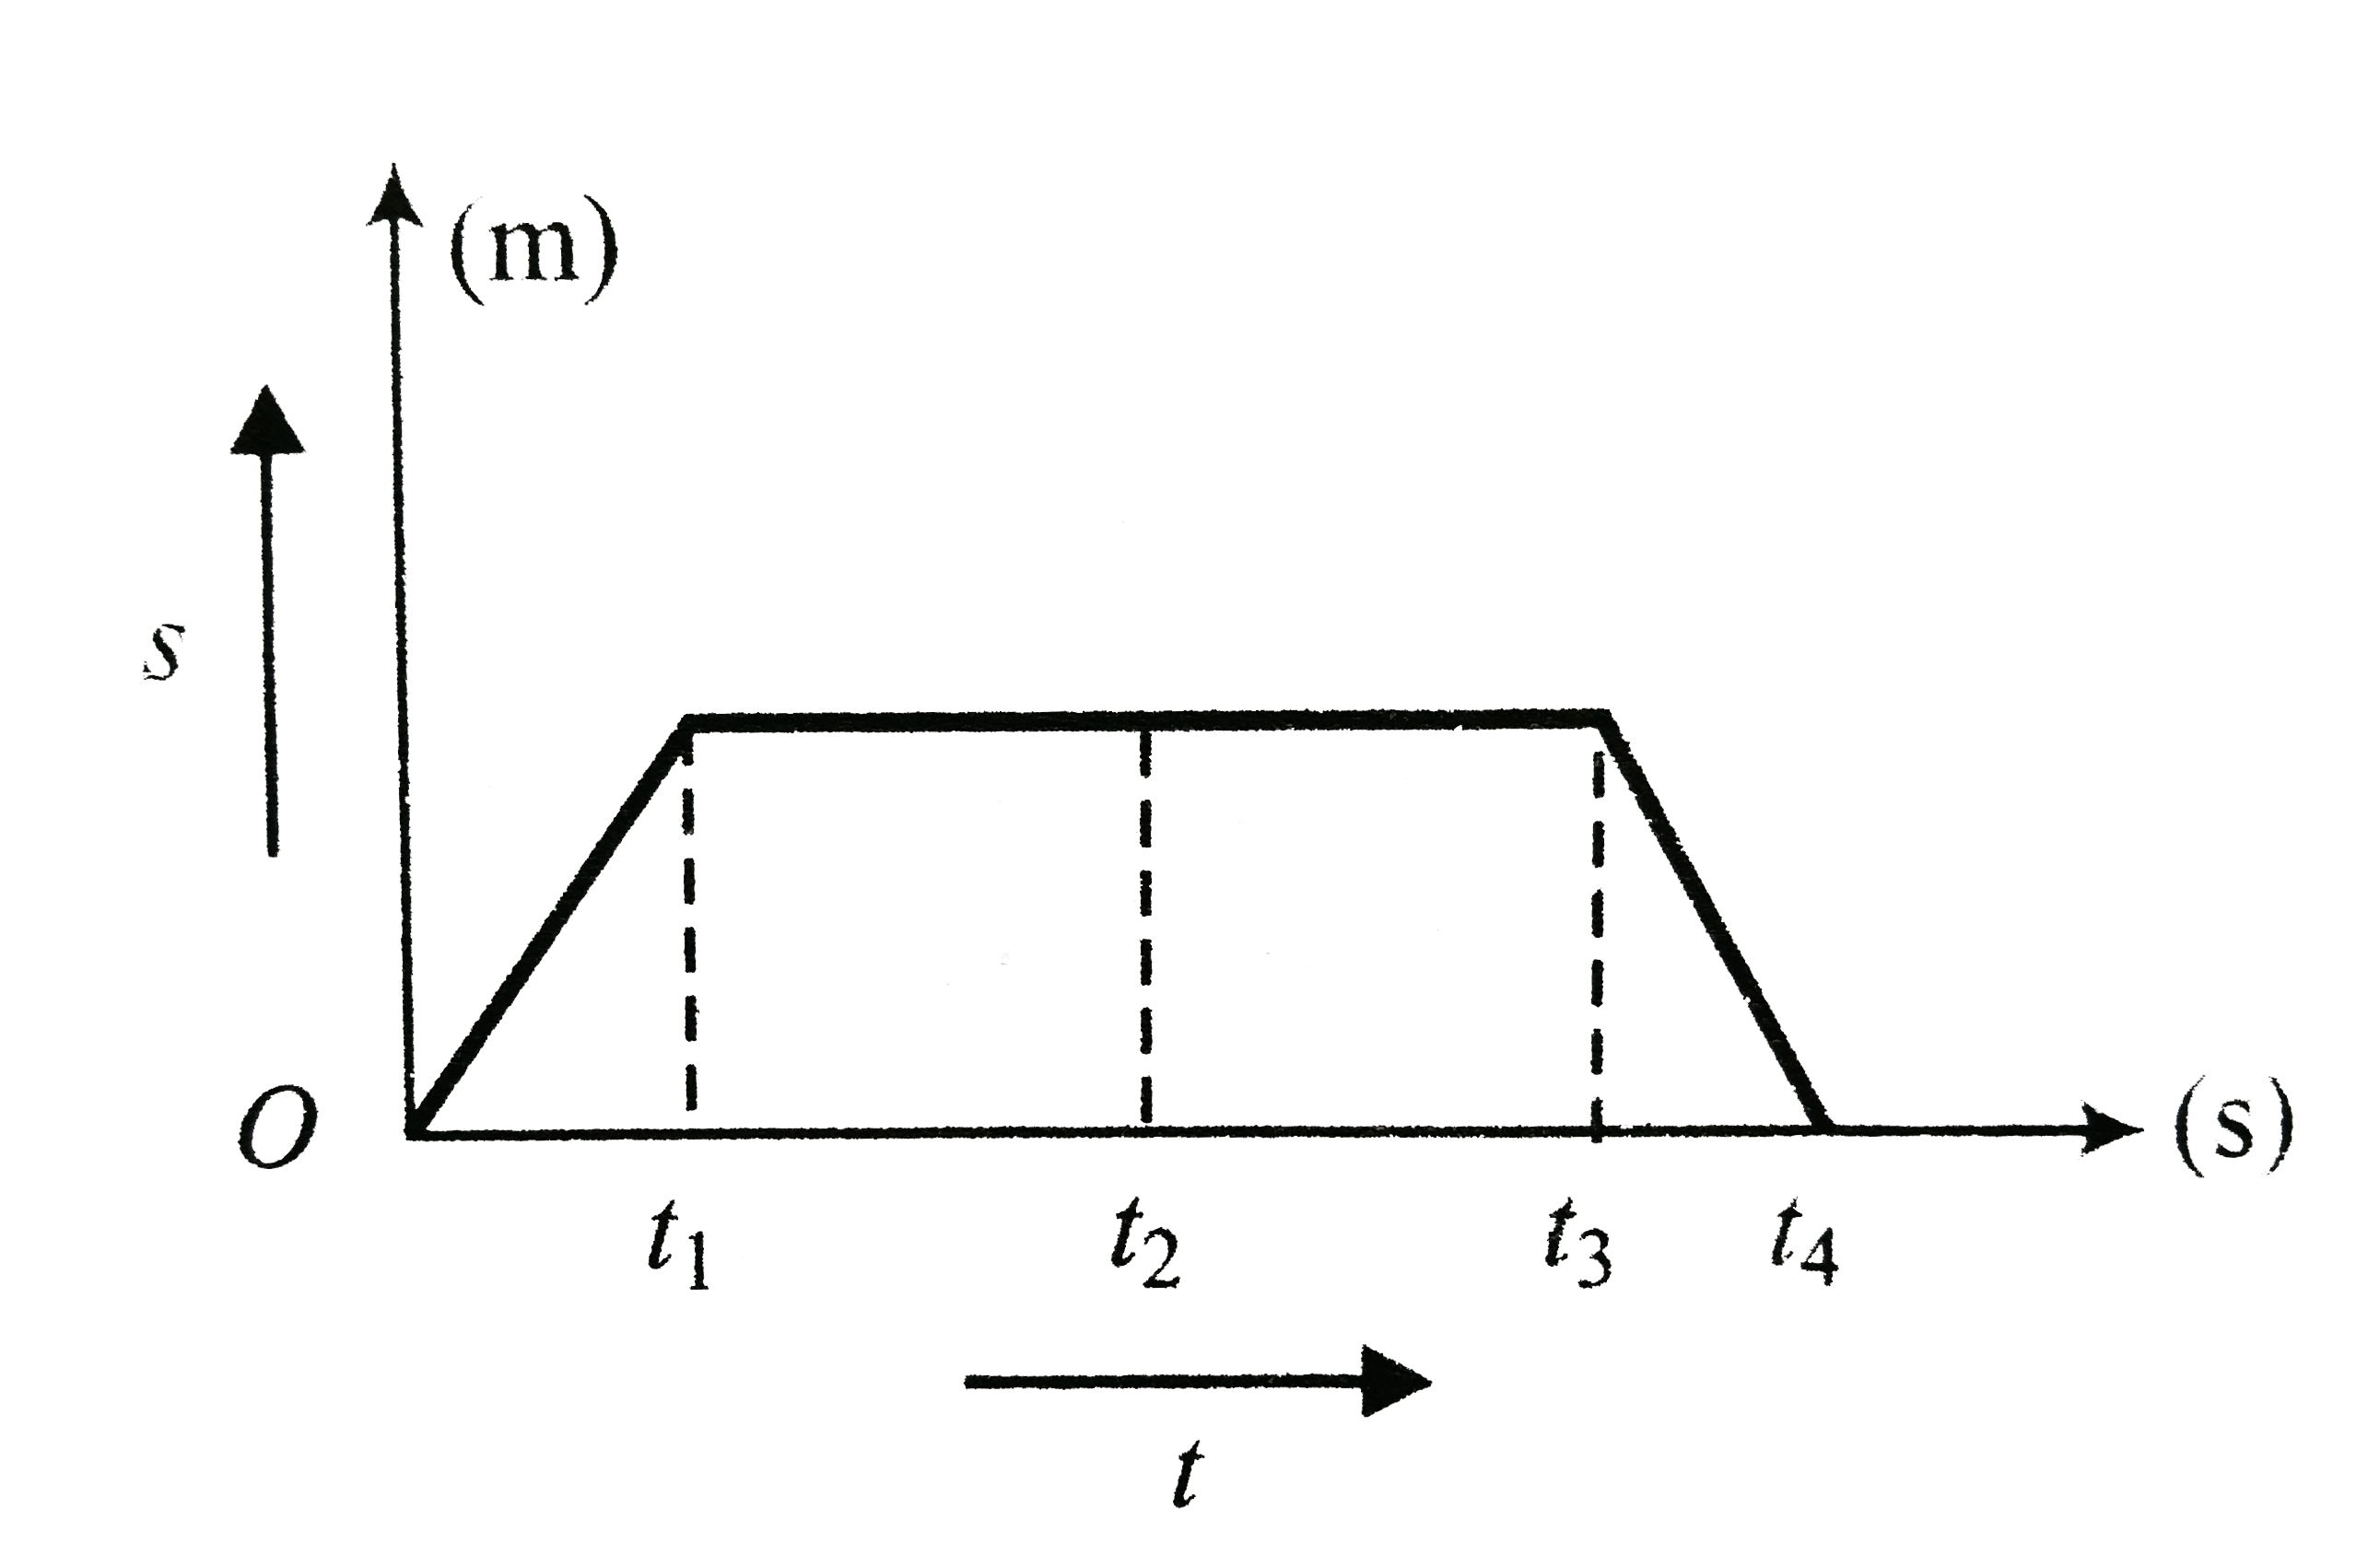 .
.
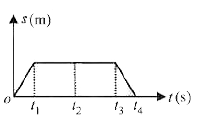
The velocity-time graph of the motion of the body will be .View SolutionThe displacement time graph of a body is shown in figure. The velocity-time graph of the motion of the body will be
 View Solution
A body starts from rest at time t=0 , the acceleration time graph is shown in the figure . The maximum velocity attained by the body will be
 View Solution
The acceleration time graph of a body moving in a straight is shown in figure.
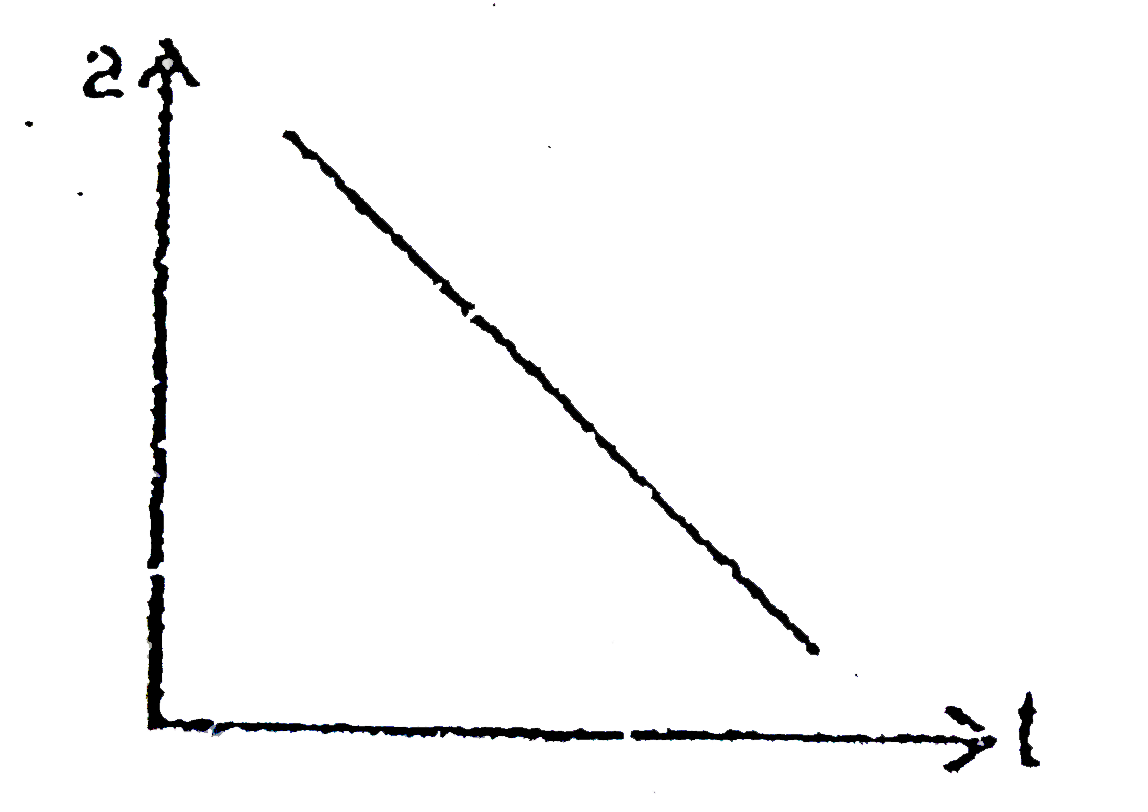
Assertion :− Velocity of the body is continously increasing over the time interval shown.
Reason :− Acceleration is positive for all shown value of t.View Solution


