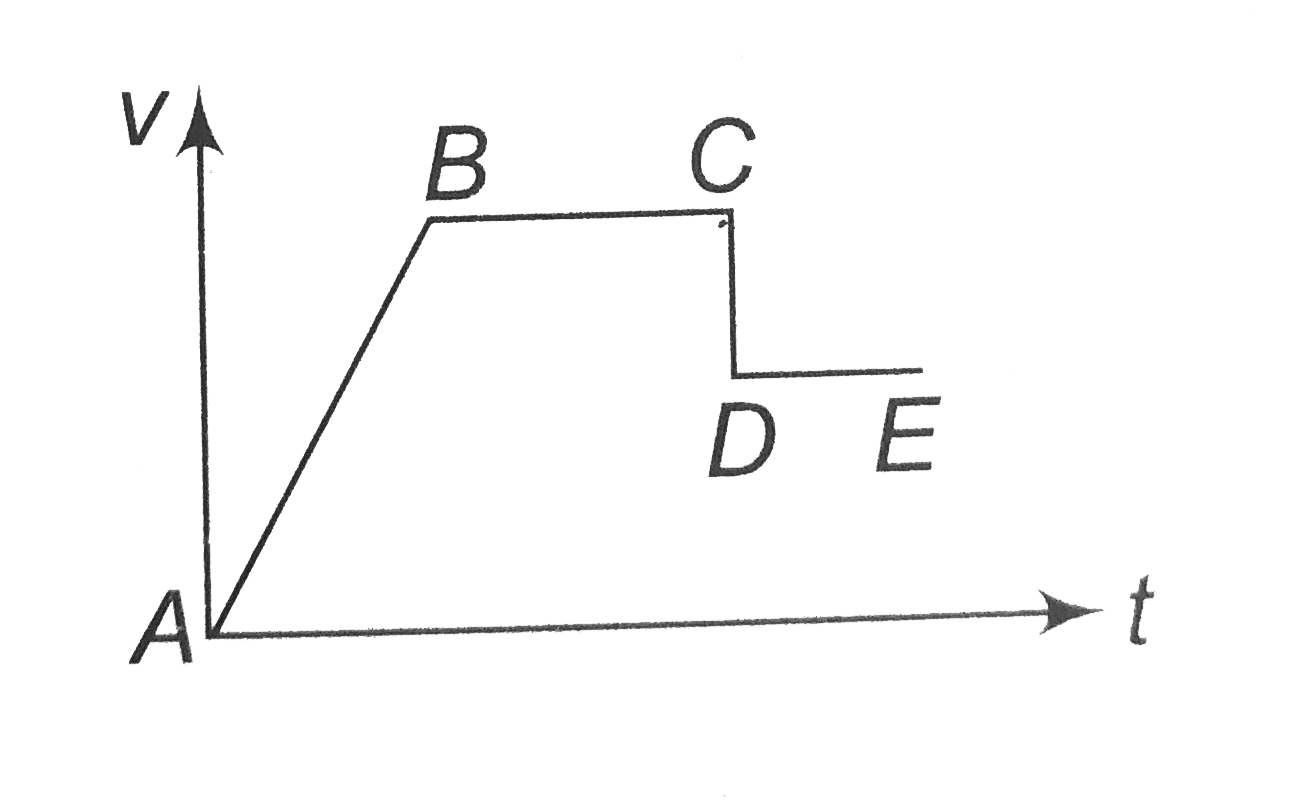
The adojoining diagram showns the velocity versus time plot for a partical . The work done by the force on the partical is positive from
A toB
B to C
C toD
D toE
The correct Answer is:A
From the graph it is clear that force is acting on the partical in the region AB and due to this force kinetic energy (velocity) of the partical increases. So the work done by the force positive.
Topper's Solved these Questions
- WORK, ENERGY, POWER AND COLLISIONBook:A2ZChapter:WORK, ENERGY, POWER AND COLLISIONExercise:Work-Energy Theorem
Explore 27 Videos
- WORK, ENERGY, POWER AND COLLISIONBook:A2ZChapter:WORK, ENERGY, POWER AND COLLISIONExercise:Potential Energy, Conservative And Non-Conservative Forces
Explore 28 Videos
- WAVES AND ACOUSTICSBook:A2ZChapter:WAVES AND ACOUSTICSExercise:Chapter Test
Explore 30 Videos
Similar Questions
Knowledge Check
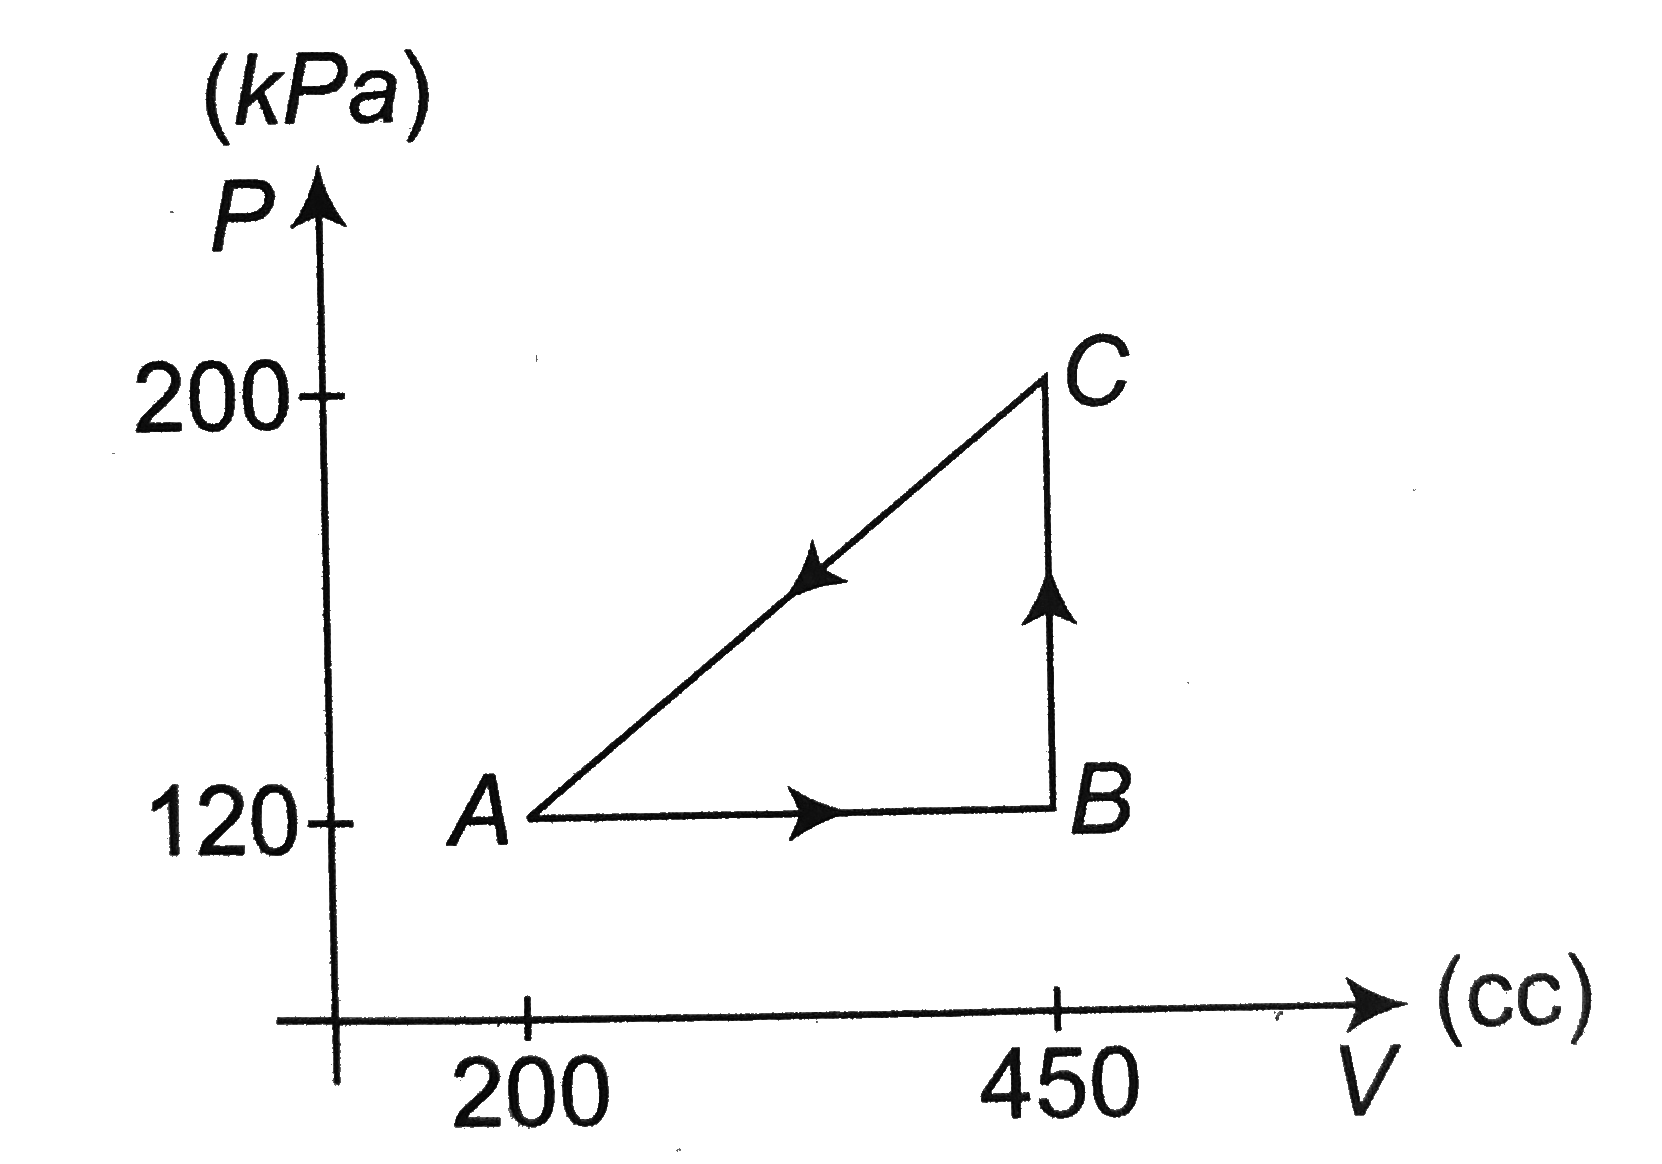
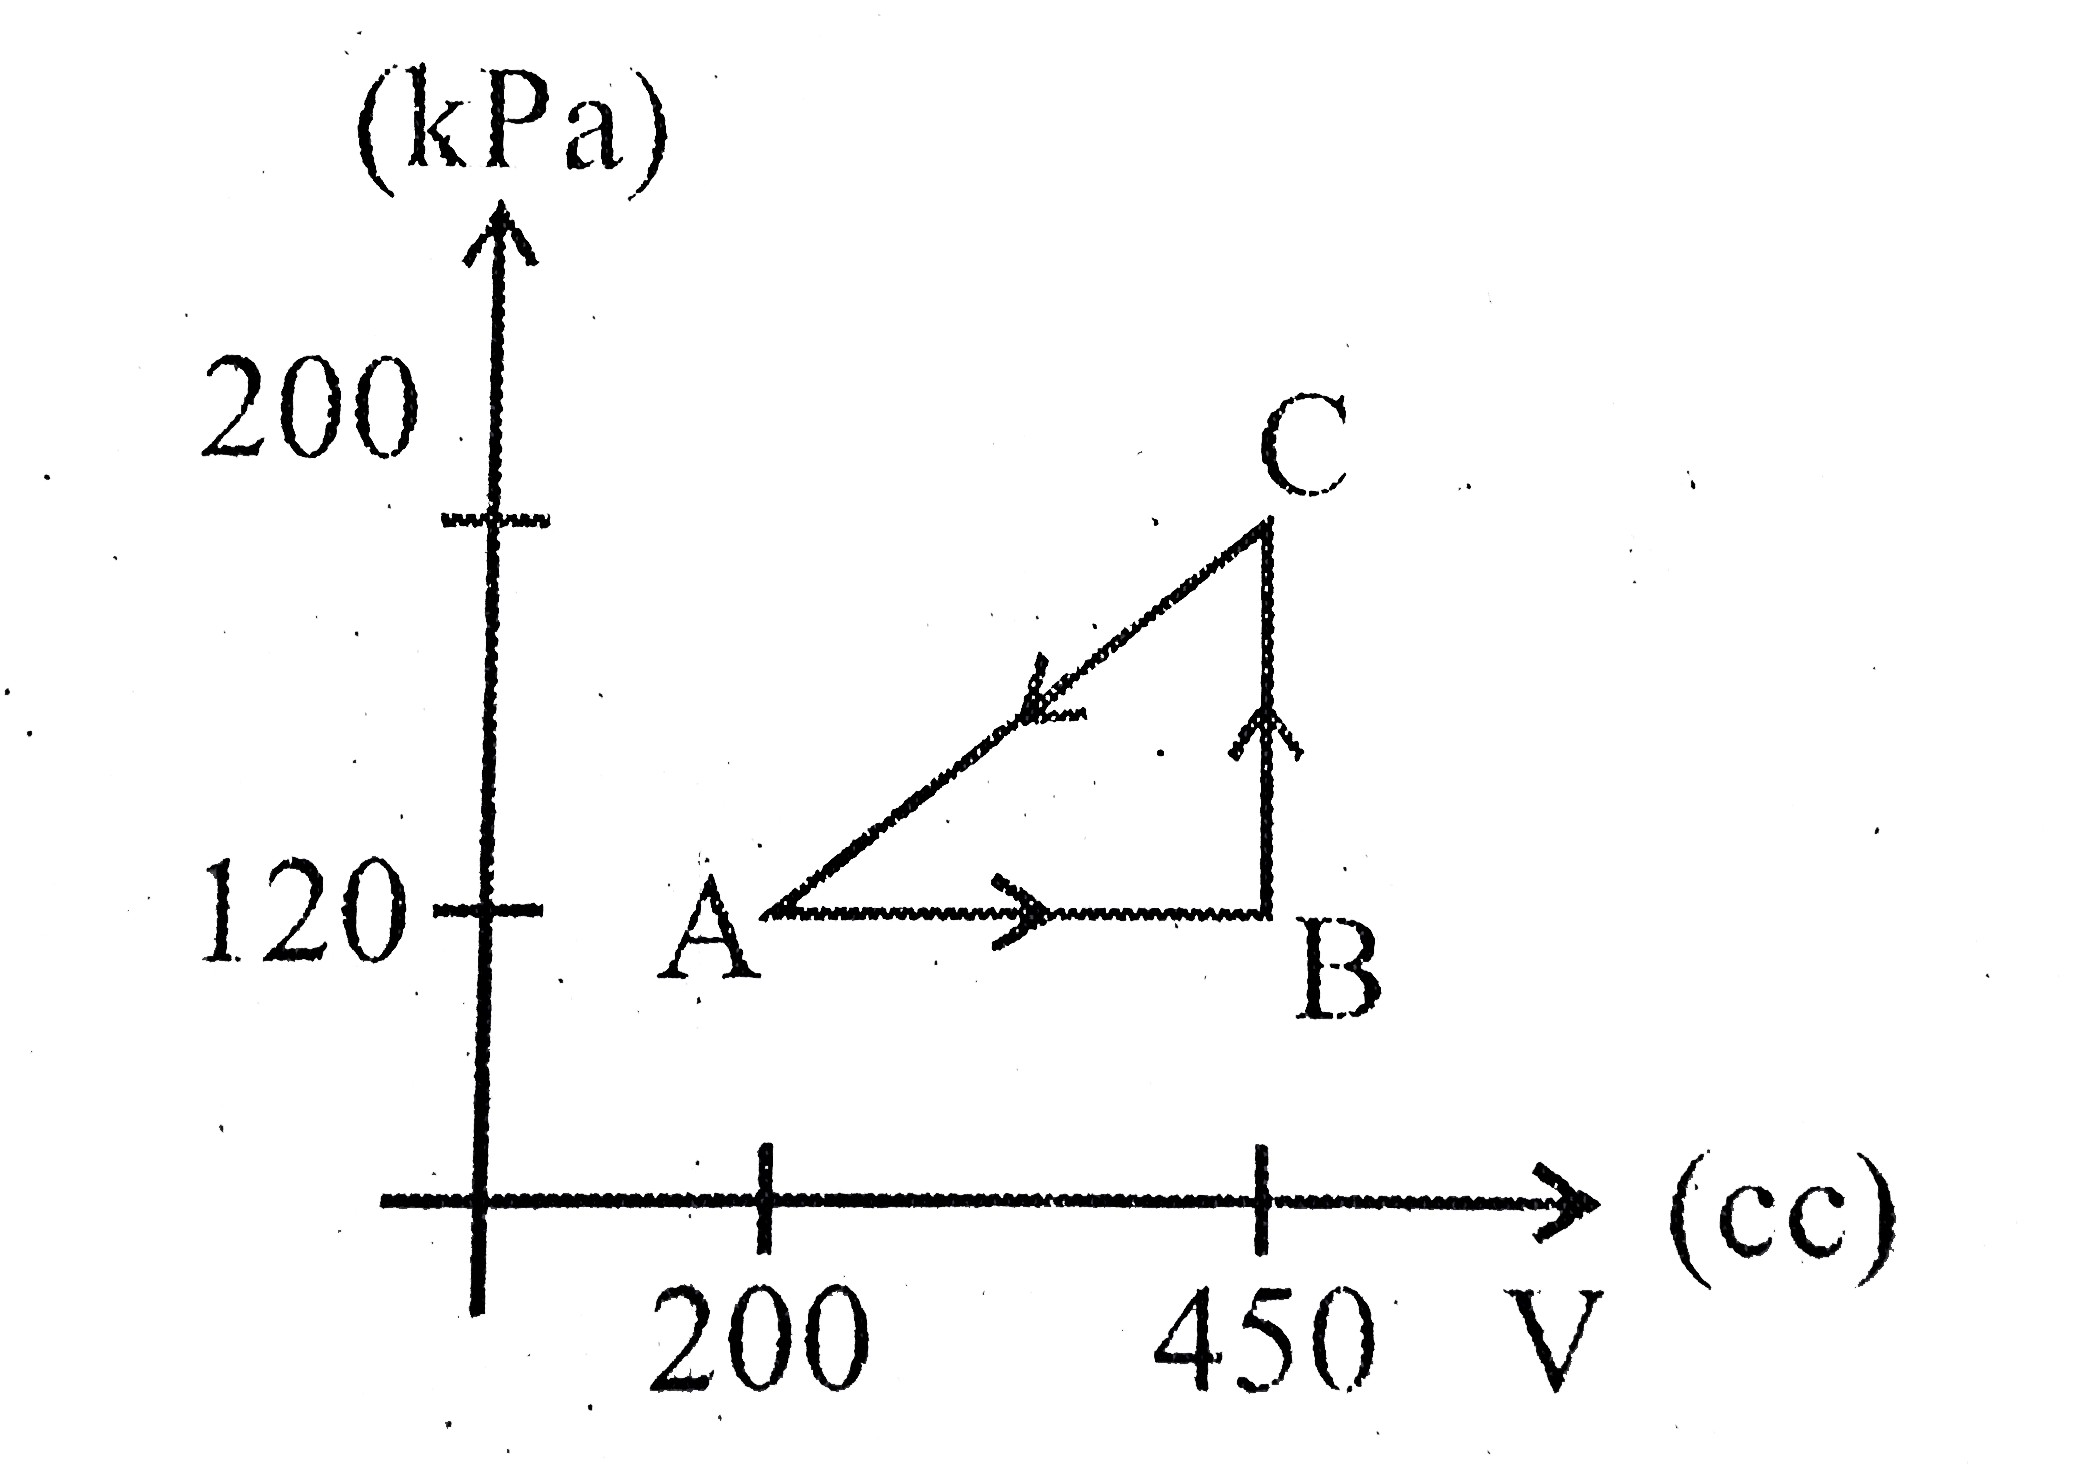
Calculate the work done by the gas in the state diagram shown.
 A30JB20JC−20JD−10J
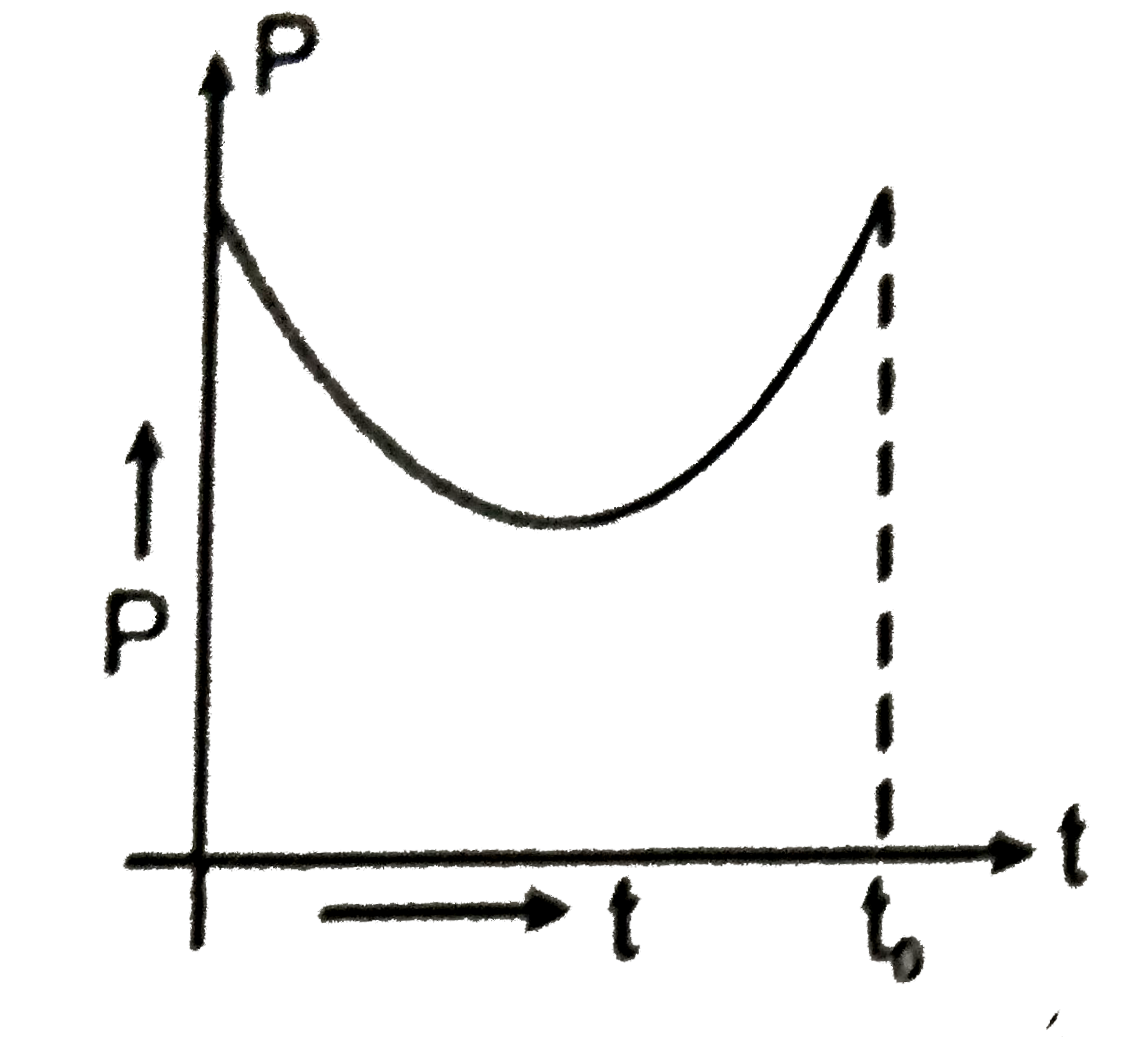
Power versus time graph for a give force is given below. Work done
by the force upto time t(≤t0).
 AFirst decreases then increasesBFirst increases then decreasesCAlways increasesDAlways decreases
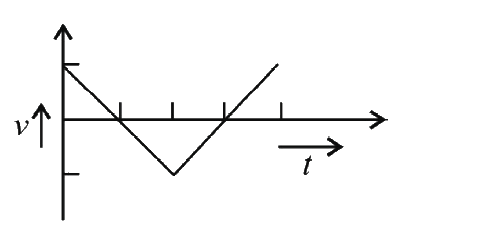
The graph in figure shows the velocity v versus time t for a body. Which of the graphs shown in figure represents the corresponding acceleration versus time graphs ?
 A
A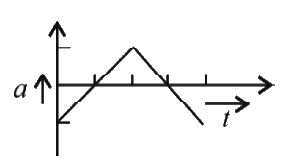 B
B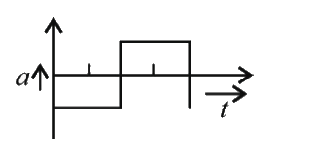 C
C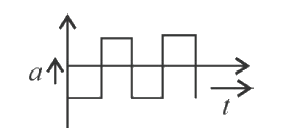 D
D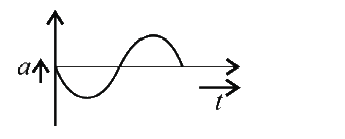
Calculate the work done by the gas in the state diagram shown :
View SolutionA partical experience a force of 10 N which is constant in magnitude and is always acting towards origin. Calculate the work done by the force on the particle during its displacement from (1,2,3) to (−1,−2,3):
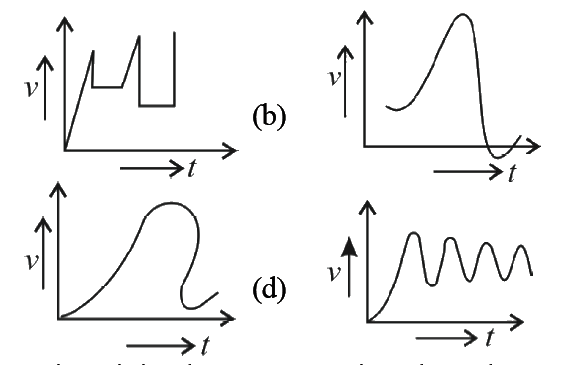
View SolutionThe following fighures show velocity v versus time t curves. But only some of these can be realized in partice. These are
View SolutionA uniform force of (3ˆi+ˆj) newton acts on a partical of mass 2kg. Hence the partical is displaced from position (2ˆi+ˆk) metre to possion (4ˆi+3ˆj−ˆk) meters. The work done by the force on the partical is
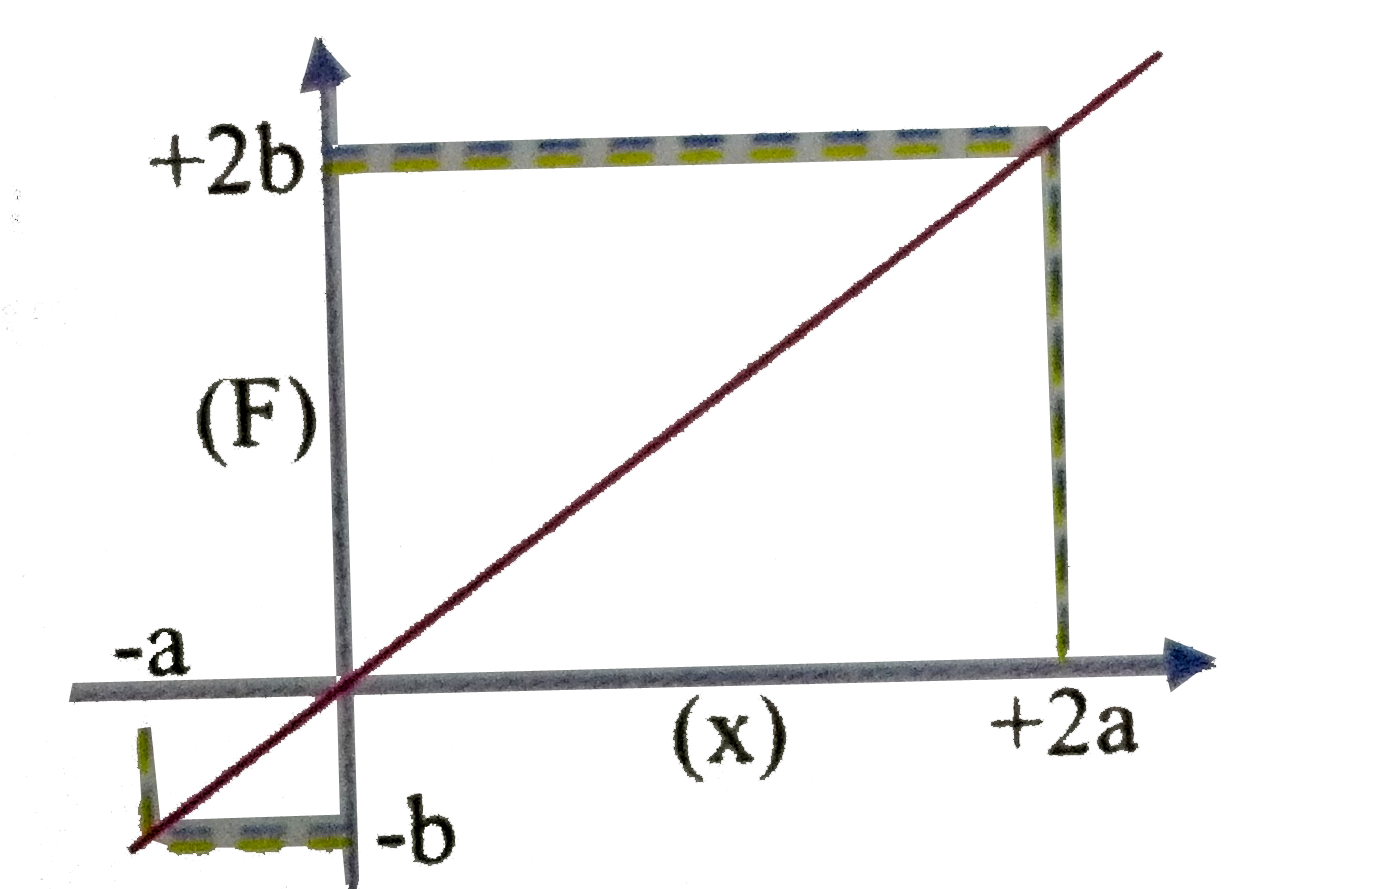
View SolutionA force F acting on a particle varies with the position x as shown in the graph. Find the work done by the force in displacing the particle from x=−a to x=+2a.
 .
.
View Solution

