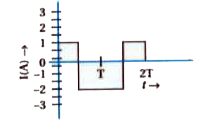
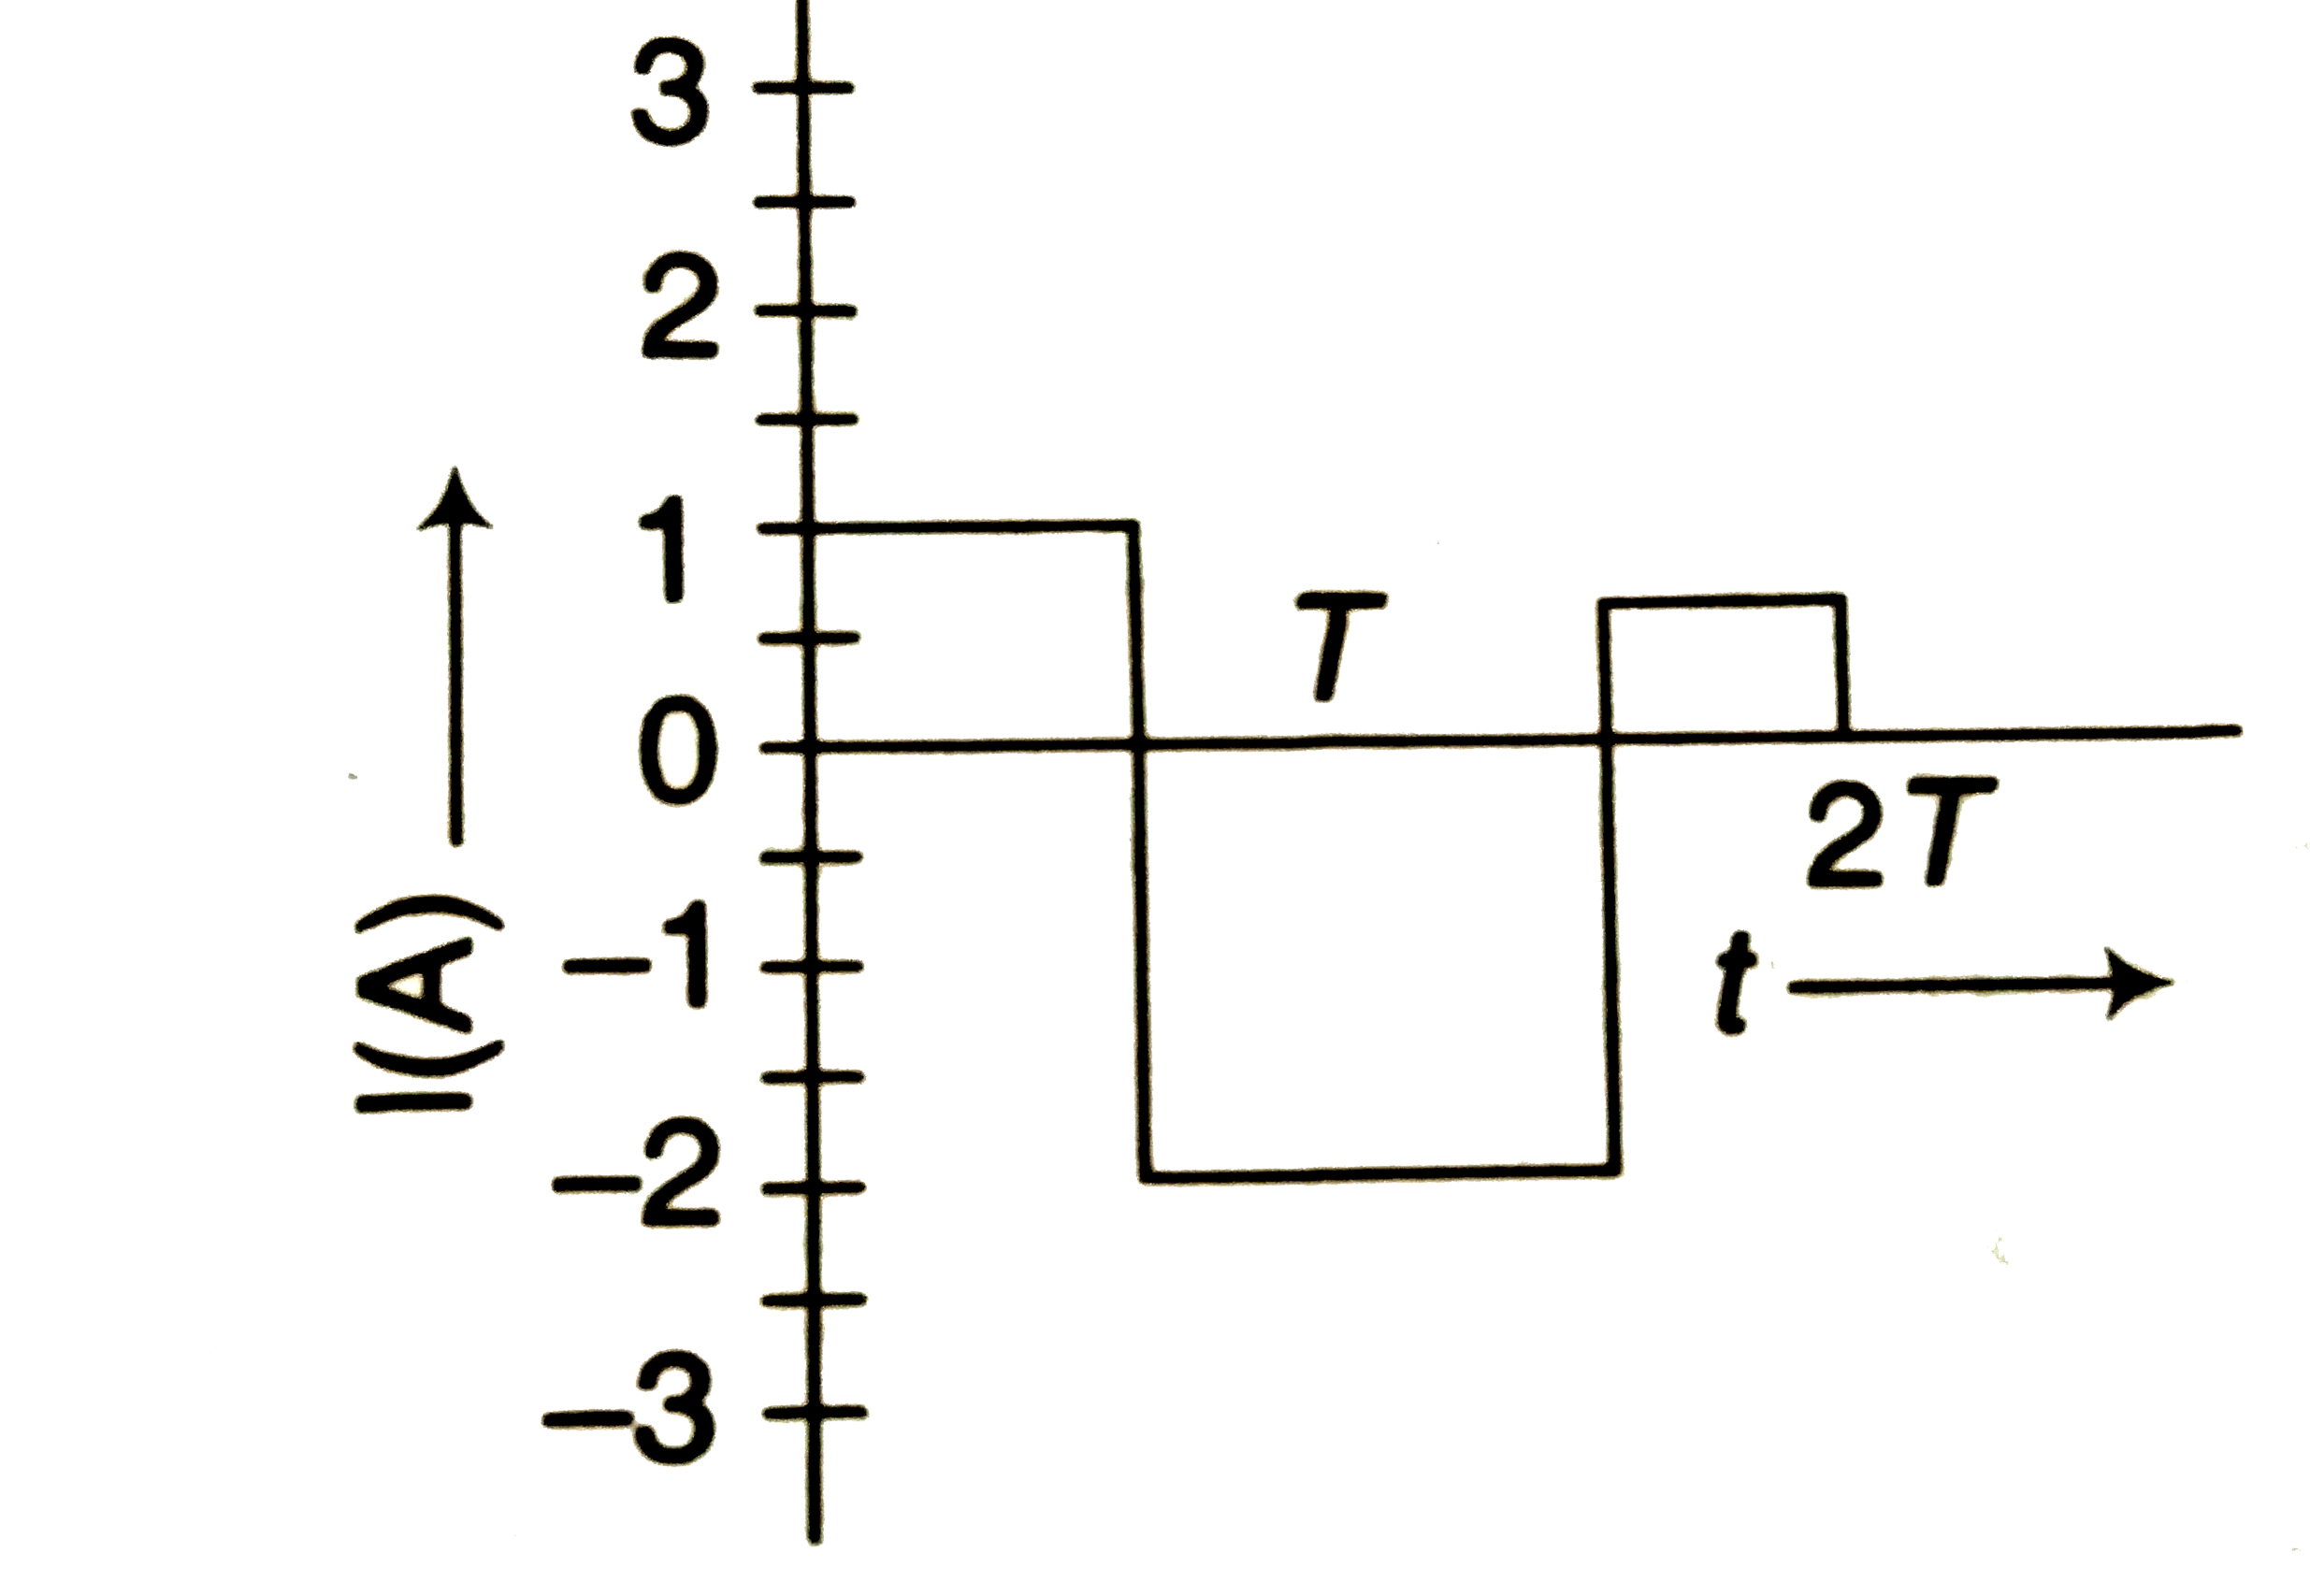
The alternating current in a circuit is described by the graph shown in figure. Show rms current in this graph.
 Solution in Gujrati
From graph diagram maximum current I1=1A and I2=−2A
∴ Average maximum current Im=√(1)2+(−2)2
∴Im=√5A
Now, Irms=Im√2
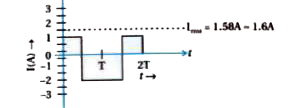
=√5√2=√52=√2.5 =1.58 A
∴Irms≈ 1.6 A is shown in below graph.
Topper's Solved these Questions
- ALTERNATING CURRENTS BOOK - KUMAR PRAKASHANCHAPTER - ALTERNATING CURRENTS EXERCISE - SECTION-C NCERT EXEMPLAR ( Short Answer)
6 Videos
- ALTERNATING CURRENTS BOOK - KUMAR PRAKASHANCHAPTER - ALTERNATING CURRENTS EXERCISE - SECTION-C NCERT EXEMPLAR (Long Answer)
5 Videos
- ALTERNATING CURRENTS BOOK - KUMAR PRAKASHANCHAPTER - ALTERNATING CURRENTS EXERCISE - SECTION-C NCERT EXEMPLAR (More than one Options)
6 Videos
- ATOMSBOOK - KUMAR PRAKASHANCHAPTER - ATOMSEXERCISE - Section-D -MCQs asked in GUJCET / Board Exam
34 Videos
Similar Questions
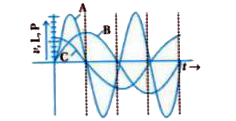
A device 'X' is connected to an ac source. The variation of voltage, current and power in one complete cycle is shown in figure.
(a) Which curve shows power consumption over a full cycle ?
(b) What is the average power consumption over a cycle ?
(c) Identify the device 'X'.
View SolutionAn electrical device draws 2 kW power from AC mains (voltage 223V (rms) Vrms = √50000 V ). The current differs (lags) in phase by (tanϕ=−34)
As compared to voltage. Find (i) R, (ii) XC−XL , and (iii) IM. Another device has twice the values for R, XC and XL. How are the answers affected ?
View SolutionAs the frequency of an ac circuit increases, the current first increases and then decreases. What combination of circuit elements is most likely to comprise the circuit ?
View SolutionThe ratio of longest wavelength and the shortest wavelength observed in the 5 spectral series of emission spectrum of hydrogen is .......
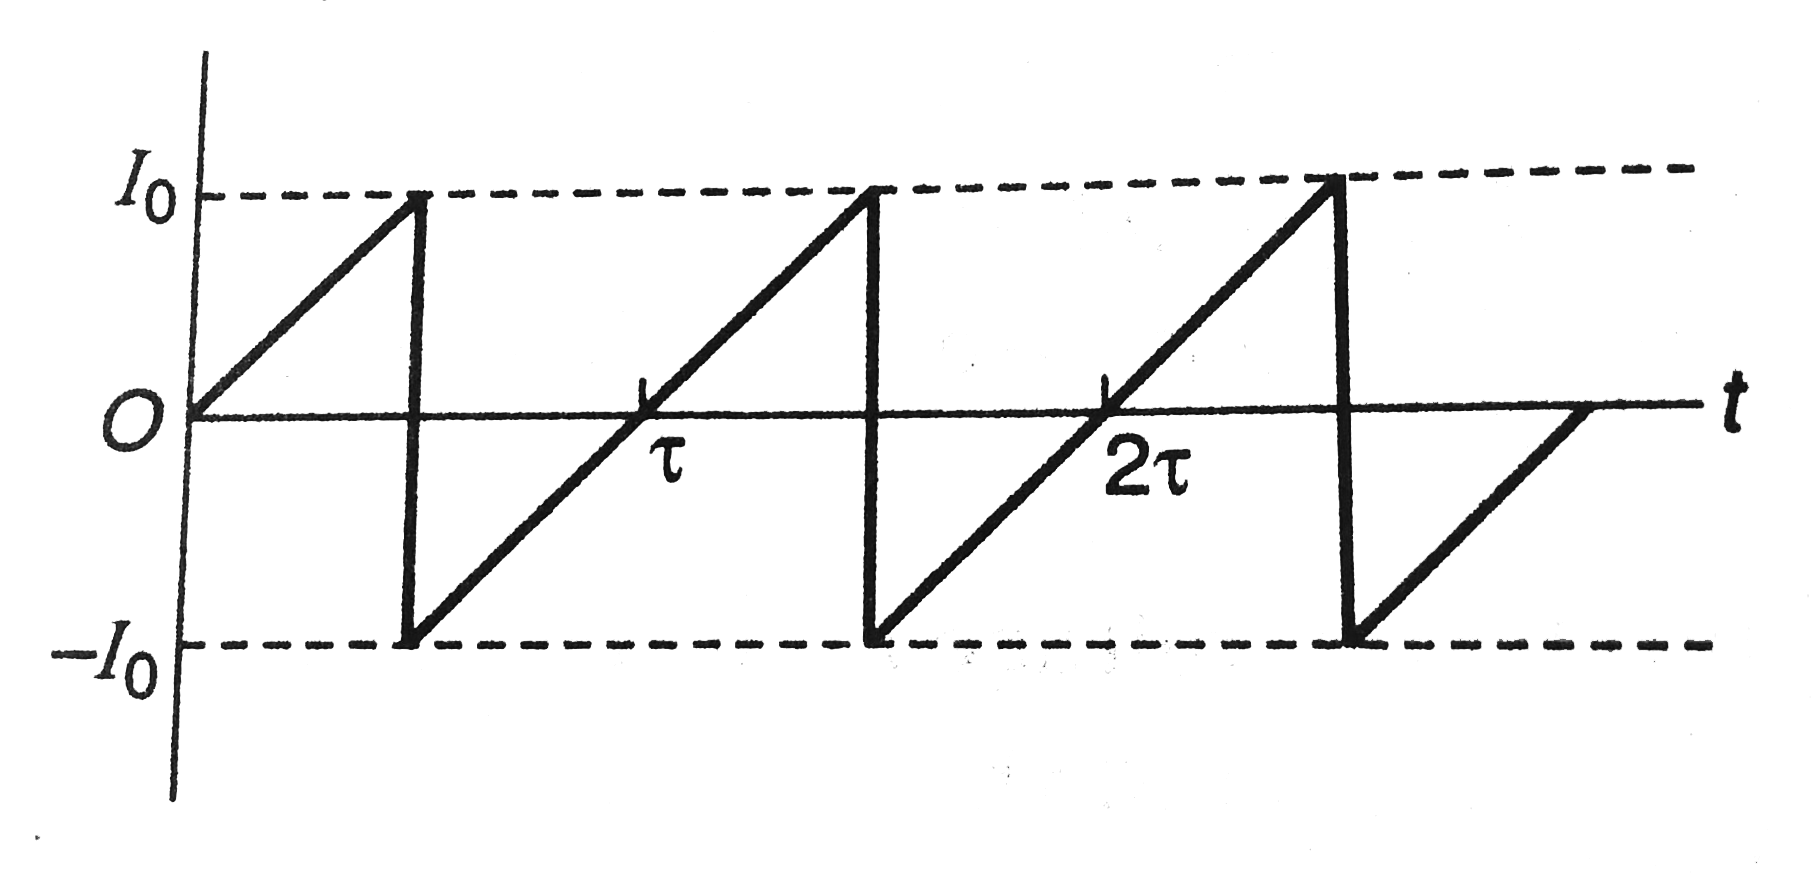
View SolutionThe current in a certain circuit varies with time as shown in figure. Find the average current and the rms current in terms of I0
 .
.
View SolutionThe alternating current in a cuicuit in a cuicuit is described by the graph shown in Fig. Show rms current in this graph.
View SolutionAssertion: Current versus time graph is as shown in figure, rms value of current is 4A. Reason: For a constant current, rms current is equal to that constant values. Reason: For a constant current, rms current is equal to that constant value.
View SolutionThe alternating current in a circuit is described by graph shown in figure. The rms current obtained from graph would be
View SolutionDuring charging of capacitor in the circuit shown,
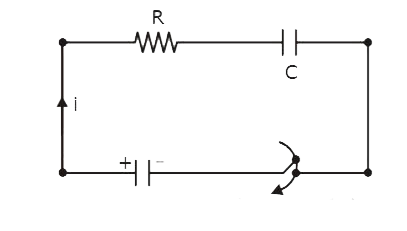
Circuit current versus time graph is
View SolutionThe current graph for resonance in LC circuit is
View SolutionThe alternating current in a circuit is described by the graph shown in Fig. Show rms current in this graph.
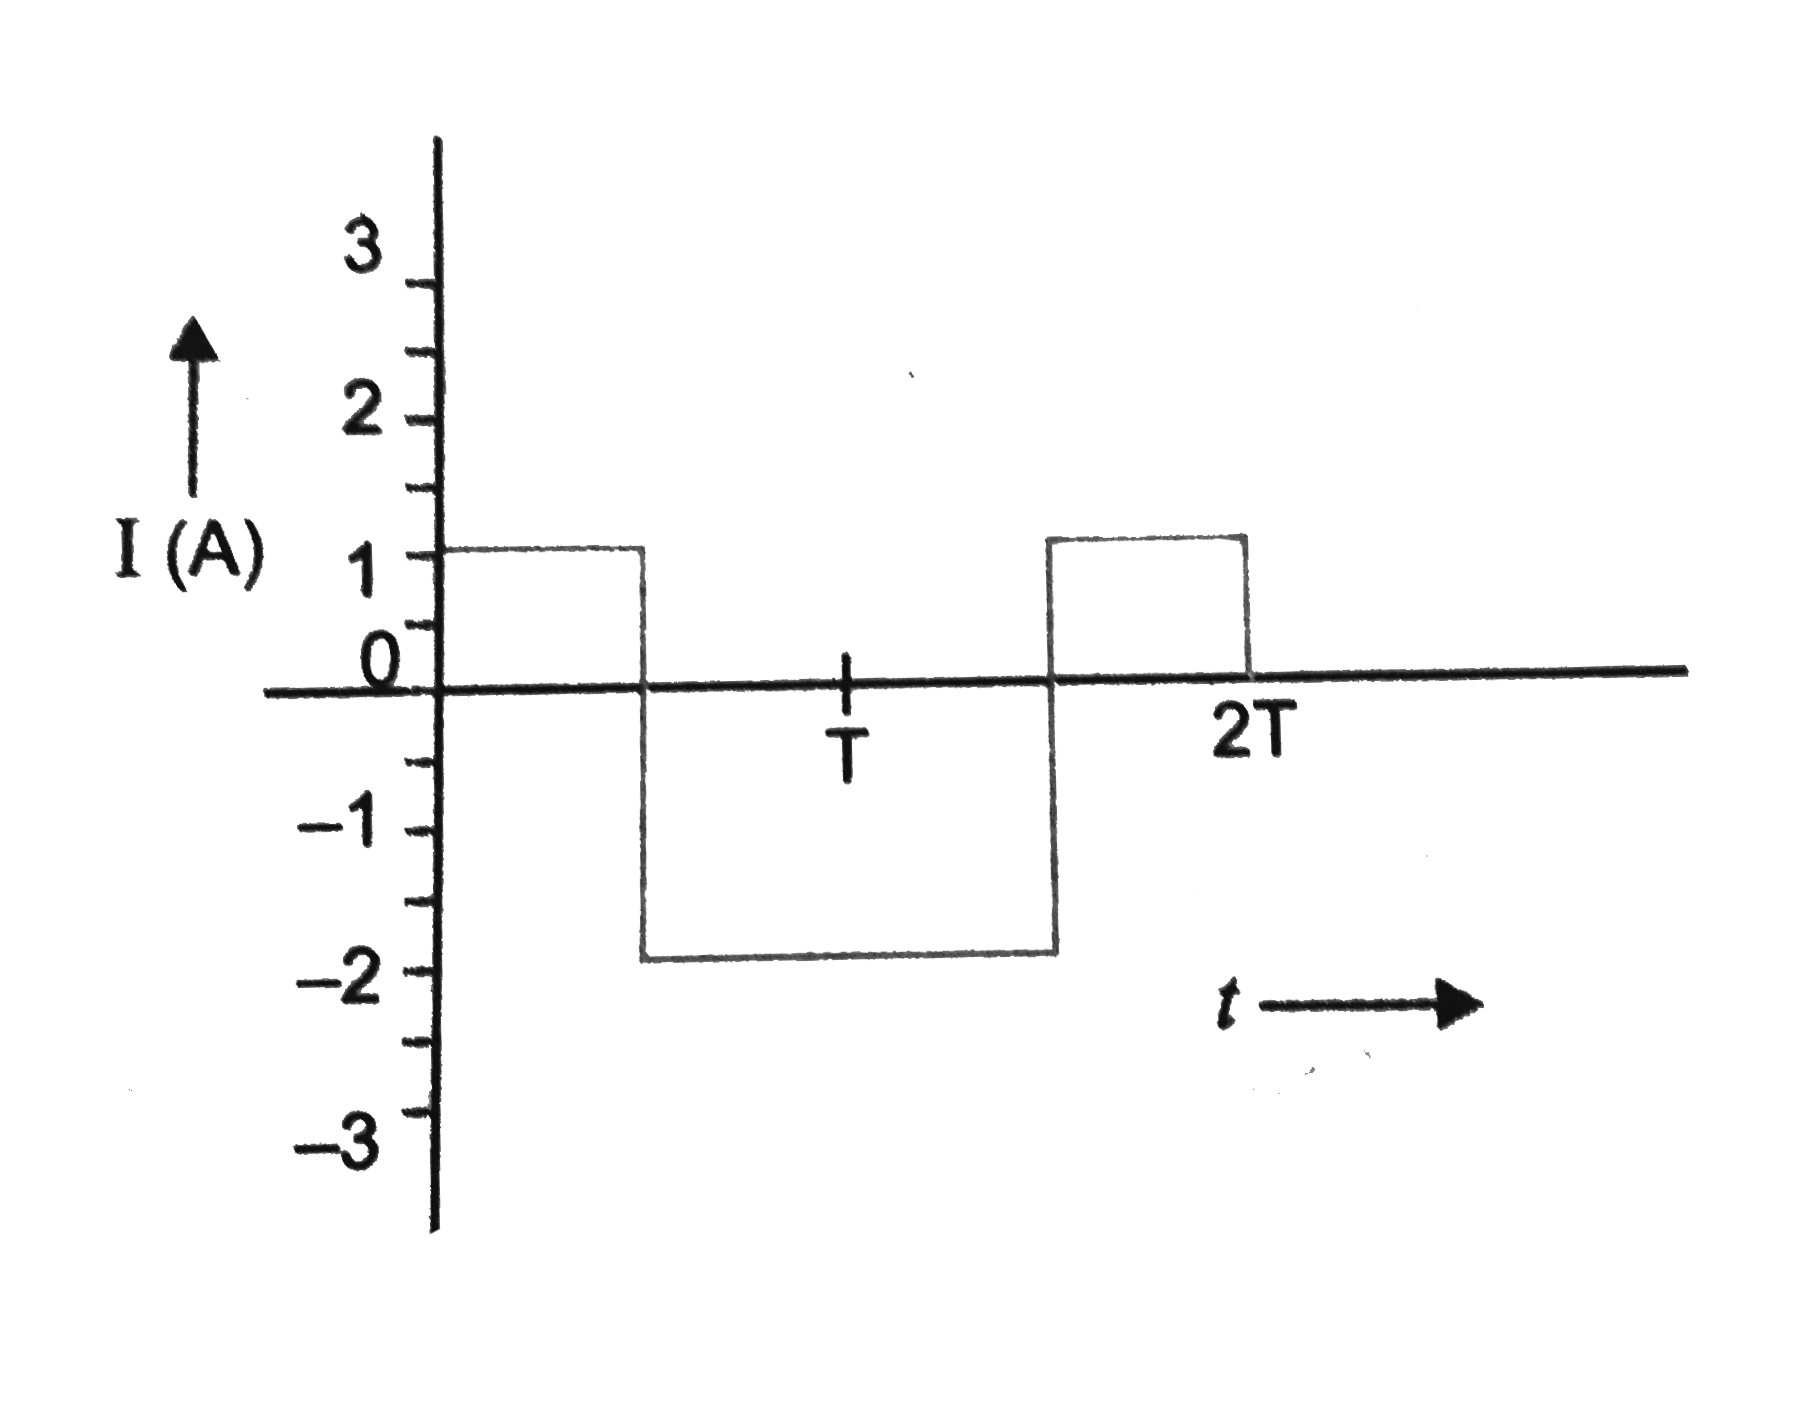
View SolutionThe ac current of a circuit is represented by the graph shown in Fig. 7.4. Show the rms current on this graph.
View Solution(A) : Current versus time graph is as shown in figure, rms value of current is 4A.
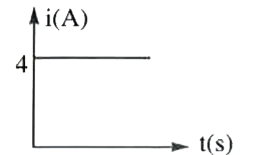
(R) : For a constant current, rms current is equal to that constant value.
View SolutionThe current in a certain circuit varies with time as shown in figure. Find the average current and the rms current in terms of I_0 .
View SolutionAssertion: Current versus time graph is as shown in figure, rms value of current is 4A. Reason: For a constant current, rms current is equal to that constant values. Reason: For a constant current, rms current is equal to that constant value.
View Solution
