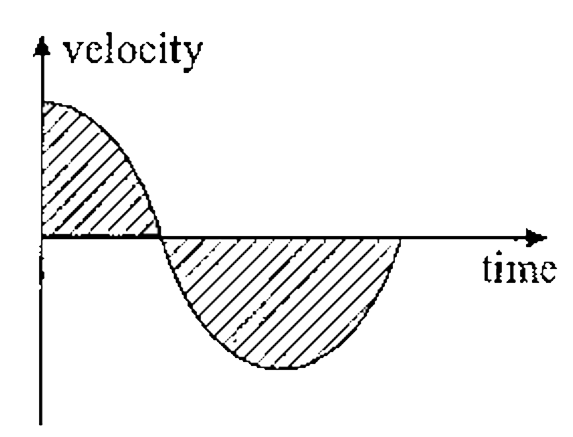
The area under velocity-time graph for a particle in a given interval of time represents
velocity
acceleration
work done
Displacement does not tell the nature of the actual motion of a particle between the points.
The correct Answer is:D
To solve the question regarding what the area under a velocity-time graph represents, we can follow these steps:
1. Understand the Velocity-Time Graph:
- A velocity-time graph plots velocity (v) on the y-axis and time (t) on the x-axis. The area under the curve of this graph represents a physical quantity.
2. Identify the Area Under the Graph:
- The area under the velocity-time graph can be calculated by finding the shape formed (which could be rectangles, triangles, or trapezoids) and using the appropriate area formulas.
3. Relate Area to Displacement:
- The area under the velocity-time graph corresponds to the displacement of the particle over the given time interval. This is because displacement is defined as the integral of velocity with respect to time.
4. Formula for Displacement:
- If the graph is a rectangle, the area (A) can be calculated as:
A=base×height=t×v
- This means that the displacement (s) can be expressed as:
s=v×t
- For other shapes, the area can be calculated using respective area formulas.
5. Conclusion:
- Therefore, the area under the velocity-time graph for a particle in a given interval of time represents the displacement of the particle during that time interval.
Final Answer:
The area under the velocity-time graph for a particle in a given interval of time represents the displacement of the particle.
---
- A velocity-time graph plots velocity (v) on the y-axis and time (t) on the x-axis. The area under the curve of this graph represents a physical quantity.
- The area under the velocity-time graph can be calculated by finding the shape formed (which could be rectangles, triangles, or trapezoids) and using the appropriate area formulas.
- The area under the velocity-time graph corresponds to the displacement of the particle over the given time interval. This is because displacement is defined as the integral of velocity with respect to time.
- If the graph is a rectangle, the area (A) can be calculated as:
A=base×height=t×v
- This means that the displacement (s) can be expressed as:
s=v×t
- For other shapes, the area can be calculated using respective area formulas.
- Therefore, the area under the velocity-time graph for a particle in a given interval of time represents the displacement of the particle during that time interval.
The area under the velocity-time graph for a particle in a given interval of time represents the displacement of the particle.
Topper's Solved these Questions
- MOTION IN A STRAIGHT LINEBOOK - NCERT FINGERTIPSCHAPTER - MOTION IN A STRAIGHT LINEEXERCISE - Instantaneous Velocity And Speed
16 Videos
- MOTION IN A STRAIGHT LINEBOOK - NCERT FINGERTIPSCHAPTER - MOTION IN A STRAIGHT LINEEXERCISE - Acceleration
19 Videos
- MOTION IN A STRAIGHT LINEBOOK - NCERT FINGERTIPSCHAPTER - MOTION IN A STRAIGHT LINEEXERCISE - Position, Path Length And Displacement
6 Videos
- MOTION IN A PLANE BOOK - NCERT FINGERTIPSCHAPTER - MOTION IN A PLANE EXERCISE - Assertion And Reason
15 Videos
- OSCILLATIONS BOOK - NCERT FINGERTIPSCHAPTER - OSCILLATIONS EXERCISE - Assertion And Reason
15 Videos
Similar Questions
Draw velocity-time graphof uniform motion and prove that the area under the velocity-time graph of a particle gives the displacement of the particle in a given time.
View SolutionWhat does the area under acceleration-time graph for any interal of time represents when the accleration of the moving body is varing with time ?
View Solution
Knowledge Check
The area under velocity-time graph for a particle in a given interval of time represents
AvelocityBaccelerationCwork doneDDisplacement does not tell the nature of the actual motion of a particle between the points.The area under a velocity-time graph gives :
ADisplacementBChange in velocityCAccelerationDSpeedArea under a velocity-time graph gives
Athe time taken by a moving objectBthe distance travelled by a moving objectCthe acceleration of moving objectDthe retardation of a moving object
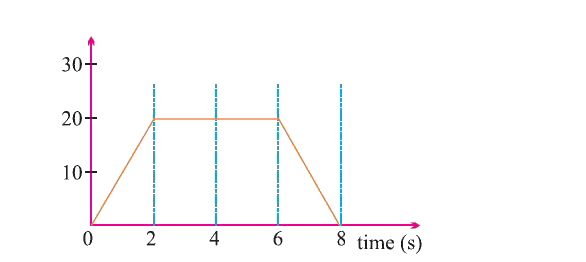
The velocity time graph for a particle is shown in figure. Draw acceleration time graph from it.

View SolutionThe velocity − time graph of a particle is as shown in figure

View SolutionThe area under acceleration-time graph gives
View SolutionThe diagram shows the velocity-time graph for a particle moving in a straight line. The sum of the two shaded areas represents :

View SolutionThe area under acceleration - time graph represents the
View Solution
