Draw velocity-time graphof uniform motion and prove that the area under the velocity-time graph of a particle gives the displacement of the particle in a given time.
Step-by-Step Solution
1. Understanding Uniform Motion:
- Uniform motion refers to the motion of an object moving at a constant velocity. This means that the speed and direction of the object do not change over time.
2. Drawing the Velocity-Time Graph:
- On the graph, the x-axis represents time (t) and the y-axis represents velocity (v).
- Since the object is in uniform motion, the velocity remains constant. Therefore, the graph will be a horizontal line at the height corresponding to the constant velocity v.
3. Identifying the Area Under the Graph:
- To find the displacement of the particle over a certain time period, we need to calculate the area under the velocity-time graph.
- Let's consider a time interval from 0 to t′. The area under the graph during this time interval can be represented as a rectangle.
4. Calculating the Area:
- The base of the rectangle is the time interval t′ (from 0 to t′).
- The height of the rectangle is the constant velocity v.
- Therefore, the area A under the graph is given by:
A=Base×Height=t′×v
- This area represents the displacement s of the particle during the time interval t′.
5. Relating Area to Displacement:
- From the definition of displacement in uniform motion, we know that:
s=v×t′
- Thus, we can conclude that the area under the velocity-time graph (which is vt′) is equal to the displacement of the particle.
6. Conclusion:
- Therefore, we have proved that the area under the velocity-time graph of a particle gives the displacement of the particle in a given time.
- Uniform motion refers to the motion of an object moving at a constant velocity. This means that the speed and direction of the object do not change over time.
- On the graph, the x-axis represents time (t) and the y-axis represents velocity (v).
- Since the object is in uniform motion, the velocity remains constant. Therefore, the graph will be a horizontal line at the height corresponding to the constant velocity v.
- To find the displacement of the particle over a certain time period, we need to calculate the area under the velocity-time graph.
- Let's consider a time interval from 0 to t′. The area under the graph during this time interval can be represented as a rectangle.
- The base of the rectangle is the time interval t′ (from 0 to t′).
- The height of the rectangle is the constant velocity v.
- Therefore, the area A under the graph is given by:
A=Base×Height=t′×v
- This area represents the displacement s of the particle during the time interval t′.
- From the definition of displacement in uniform motion, we know that:
s=v×t′
- Thus, we can conclude that the area under the velocity-time graph (which is vt′) is equal to the displacement of the particle.
- Therefore, we have proved that the area under the velocity-time graph of a particle gives the displacement of the particle in a given time.
Topper's Solved these Questions
Similar Questions
Draw the velocity-time graph for an object in uniform motion. Show that the area under the velocity-time graph gives the displacement of the object in the given time interval.
View SolutionDraw the velocity-time graph for uniformly accelerated motion. Show that slope of the velocity-time graph gives acceleration of the object.
View Solution
Knowledge Check
The area under a velocity-time graph gives :
ADisplacementBChange in velocityCAccelerationDSpeedArea under a velocity-time graph gives
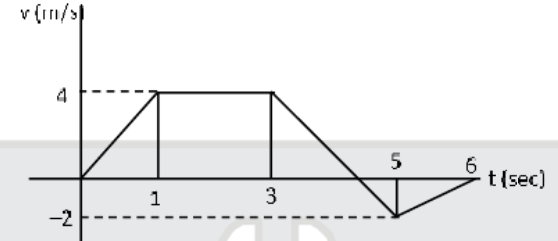
Athe time taken by a moving objectBthe distance travelled by a moving objectCthe acceleration of moving objectDthe retardation of a moving objectvelocity time graph of a particle is shown in figure. Find displacement of the particle.
 A7B11C5D15
Draw position vs time graph of uniform velocity.
View SolutionThe area under velocity-time graph for a particle in a given interval of time represents
View SolutionThe velocity − time graph of a particle is as shown in figure

View SolutionThe slope of velocity-time graph for uniform motion of an object is
View SolutionThe velocity time graph of the motion of a car is given here.

View Solution
