The below shown graphs represent the same motion. But one of them is incorrect. Find it.Solution in Gujrati
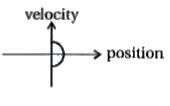
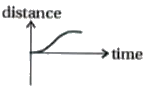
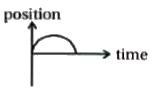

The correct Answer is:B
(1) This is v→t graph for an object thrown upwards and the motion is constant.
(2) Object doesn.t cover same distance in same time. Motion is not constant.
(3) This graph shows motion of object in upward direction
(4) This is also a constant motion.
Hence, (A), (C) and (D) represent same constant motion. (B) doesn.t represent the same.
Topper's Solved these Questions
- MOTION IN A STRAIGHT LINE BOOK - KUMAR PRAKASHANCHAPTER - MOTION IN A STRAIGHT LINE EXERCISE - SECTION-F
20 Videos
- MOTION IN A STRAIGHT LINE BOOK - KUMAR PRAKASHANCHAPTER - MOTION IN A STRAIGHT LINE EXERCISE - QUESTION PAPER
11 Videos
- MOTION IN A STRAIGHT LINE BOOK - KUMAR PRAKASHANCHAPTER - MOTION IN A STRAIGHT LINE EXERCISE - SECTION-D
26 Videos
- MECHANICAL PROPERTIES OF FLUIDS BOOK - KUMAR PRAKASHANCHAPTER - MECHANICAL PROPERTIES OF FLUIDS EXERCISE - QUESTION PAPER (SECTION -C)
3 Videos
- OBJECTIVE QUESTIONS AS PER NEW PAPER STYLE BOOK - KUMAR PRAKASHANCHAPTER - OBJECTIVE QUESTIONS AS PER NEW PAPER STYLE EXERCISE - CHAPTER - 8 (Match Type questions)
5 Videos
Similar Questions
Distance covered by ball thrown upwards with speed 'u' in last 't' seconds before it reaches max. height is .............
View SolutionDefine frame of reference and give its types.
View SolutionAmong the four graph shown in the figure there is only one graph for which average velocity over the time interval (O,T) can vanish for a suitably chosen T. Which one is it ?
View SolutionGlycerine flows steadily through a horizontal tube of length 1.5m and radius 1.0 cm . If the amount of glycerine collected per second at one is 4.0×10⁻³kgs−1 , what is the pressure difference between the two ends of the tube ? (Density of glycerine =1.3×10103kgm−3 and viscosity of glycerine =0.83 Pa s). [ you may also like to check if the assumption of laminar flow in the tube is correct]
View SolutionType of satellites are given in Column-I and their uses are given in Column-II. Match them properly :
Column-IColumn-II(1) Polar satellite(a) Tele communication(2) Geo-stationary satellite(b) Investigation(c) For information about atmosphere
View Solutions-t graph of a particle in motion is as shown below. (a) State, whether the given graph represents a uniform motion or not. (b) Find velocity of the particle.
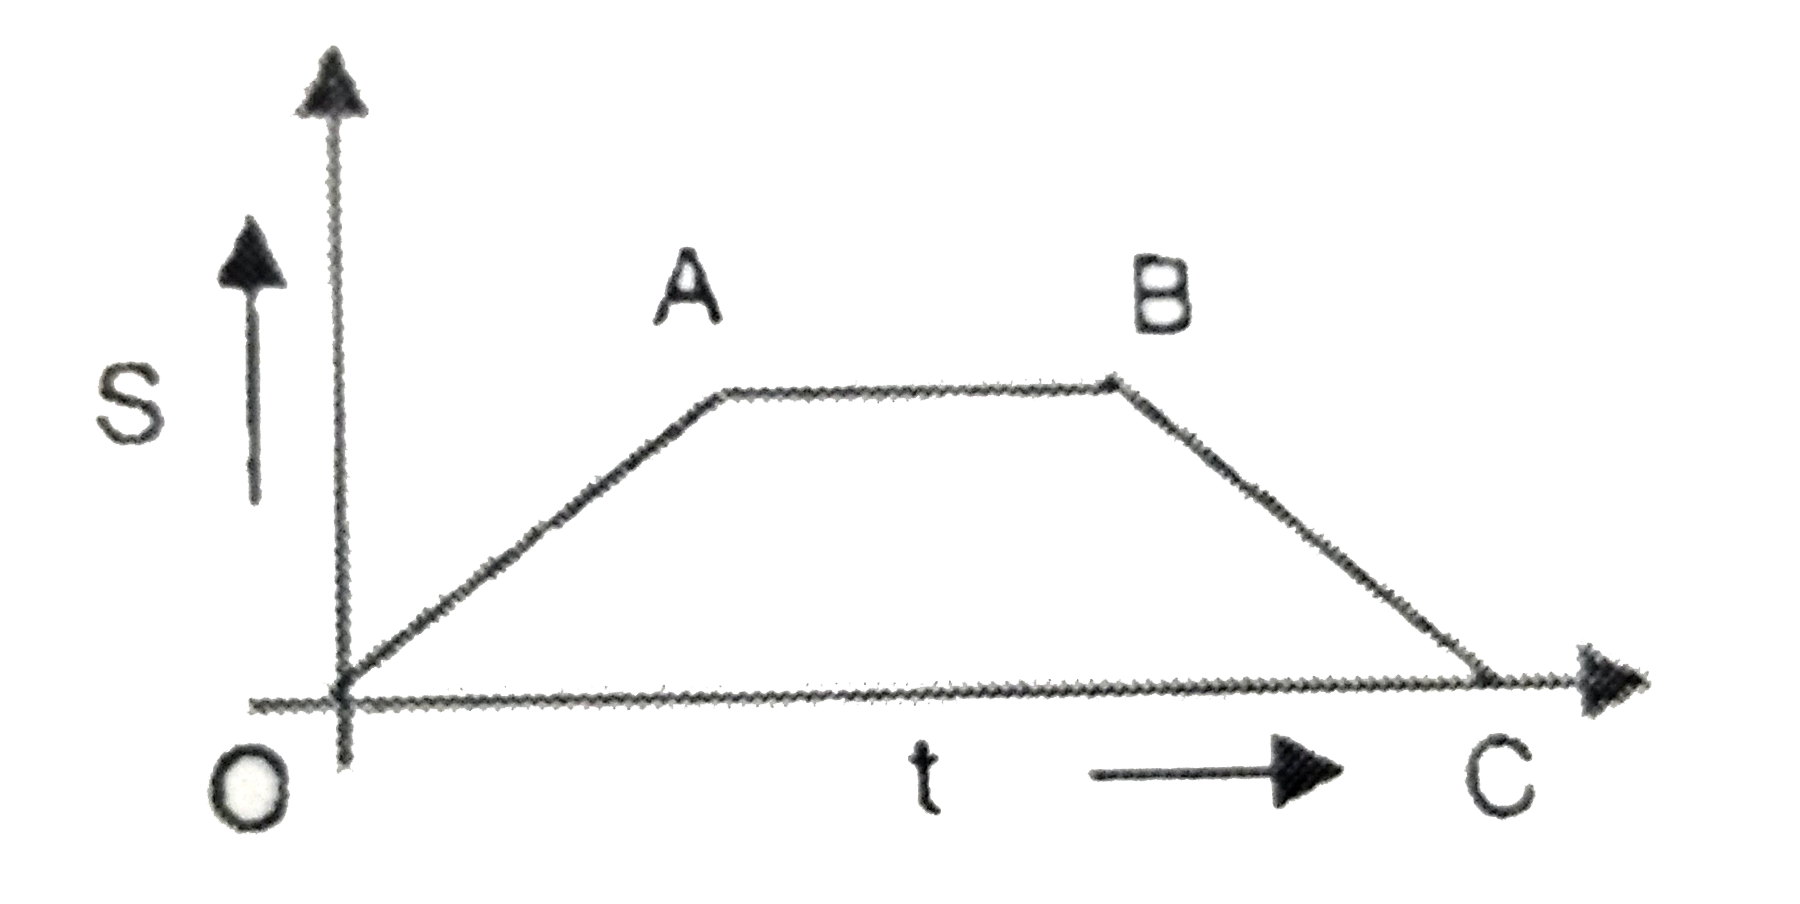
View SolutionThe displacement-time graph of a body is shown in the figure below. The part of the graph that represents the uniform motion of the body is _________
View SolutionAll the graphs below are intended to represent the same motion. One of them does it incorrectly. Pick it up.
View SolutionWhich one of the following graphs represents motion?
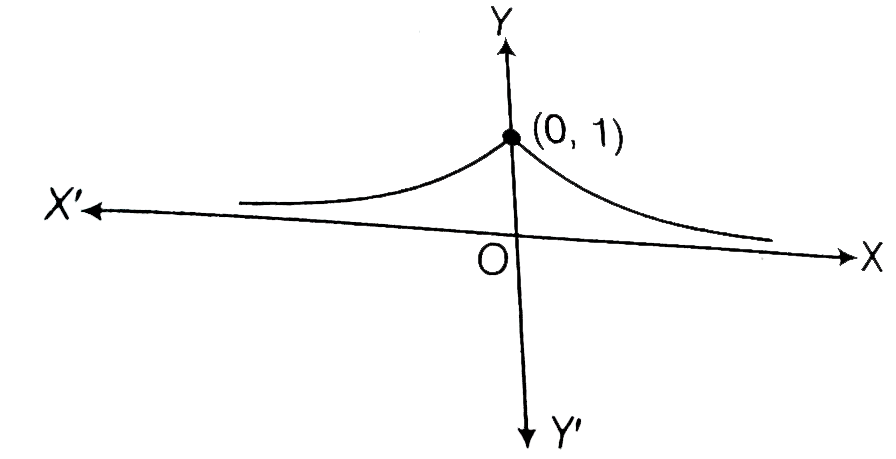
View SolutionWhich one of the following function best represent the graphs as shown below?
View SolutionAll the graphs below are intended to represent the same motion. One of them does it incorrectly. Pick it up.
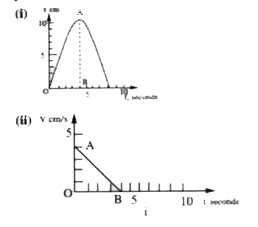
View SolutionThe graphs in (i) and (ii) show the S-t graph and V -t graph of a body. Are the motions shown in the graphs represented by OAB the same ?
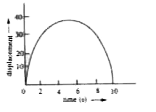
View SolutionThe displacement-time graph of a moving object is shown in figure. Which of the velocity-time graphs shown in figure could represent the motion of the same body ?
View SolutionAll the graphs below are intended to represent the same motion. One of them does it incorrectly. Pick it up.
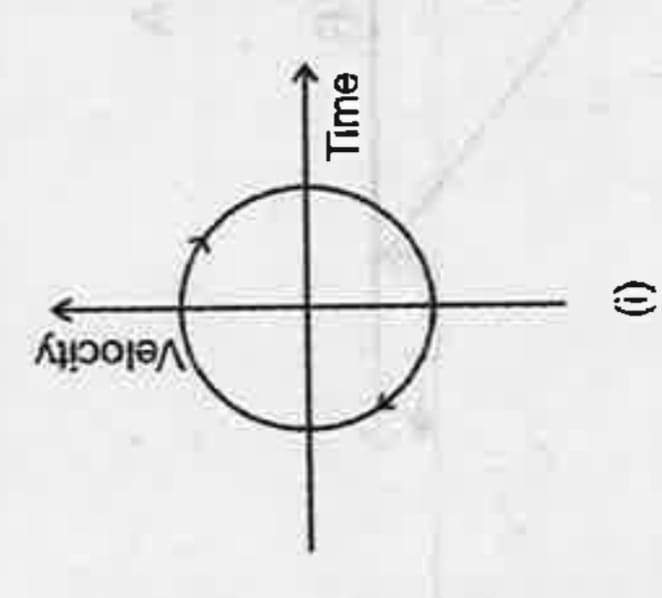
View SolutionGraph representing the motion of a body is shown below. State with reason whether it can represent one dimensional motion.
View Solution
