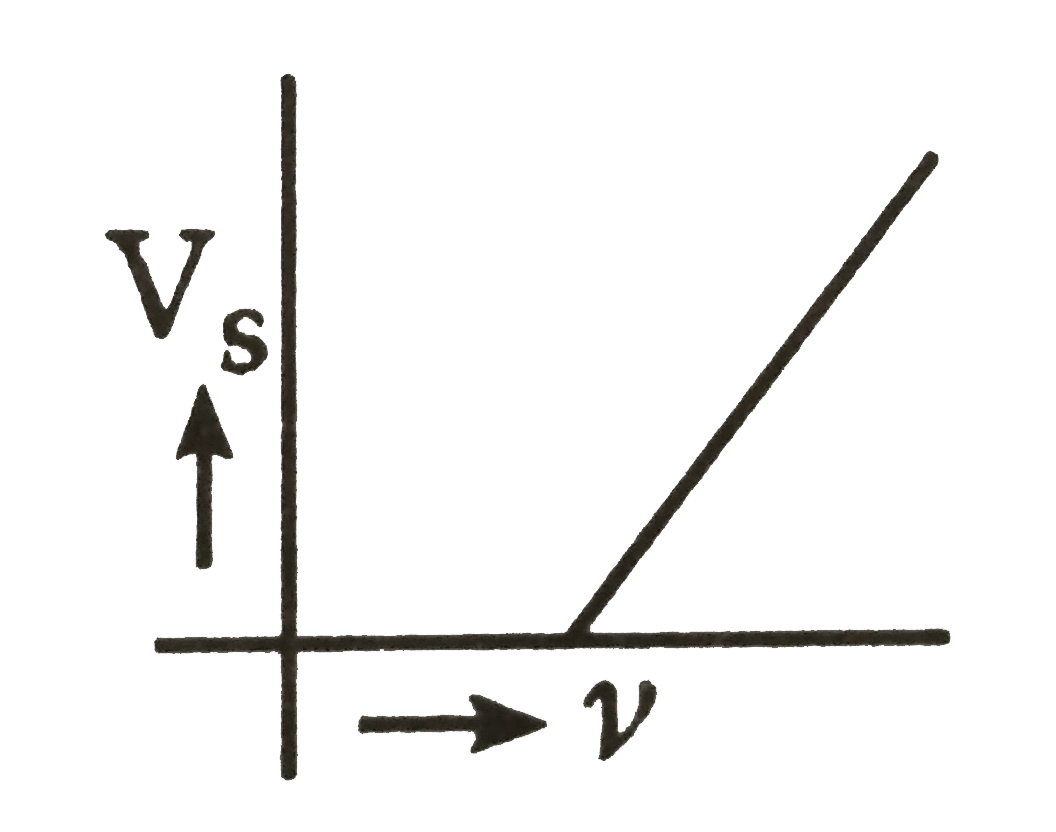
The correct curve between the stopping potential (V) and intensity of incident light (I) is
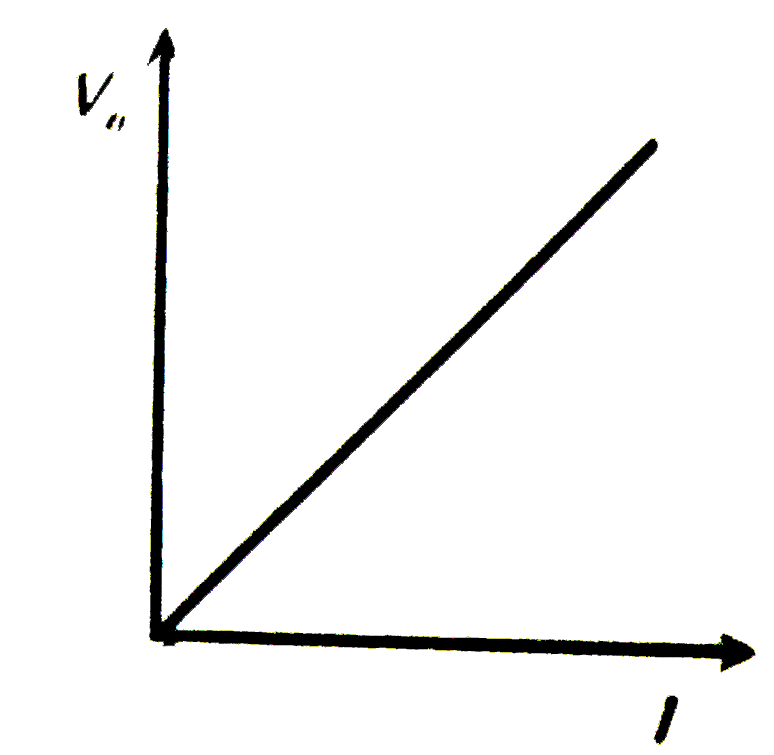
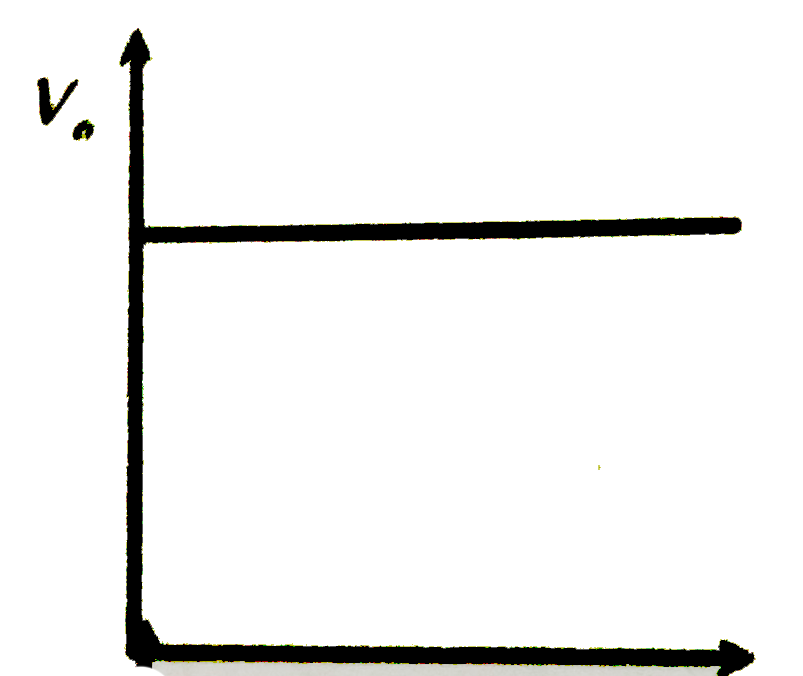
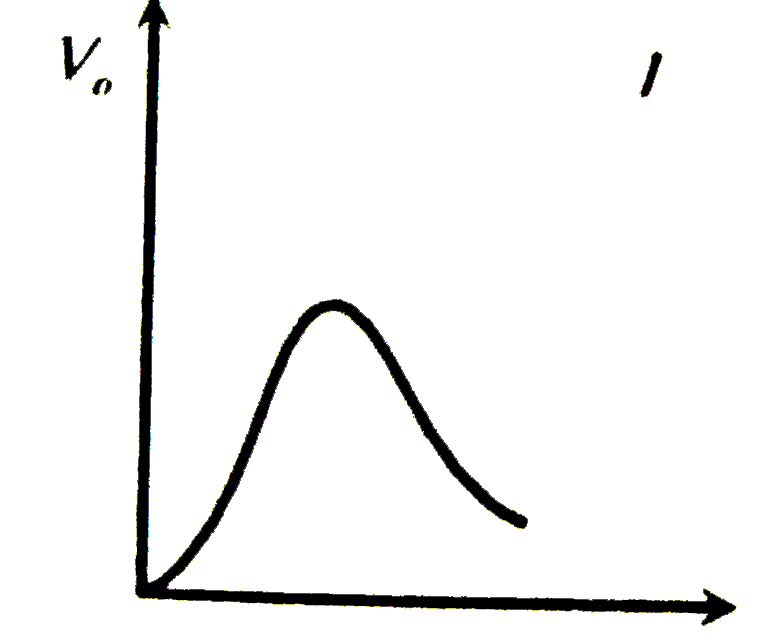
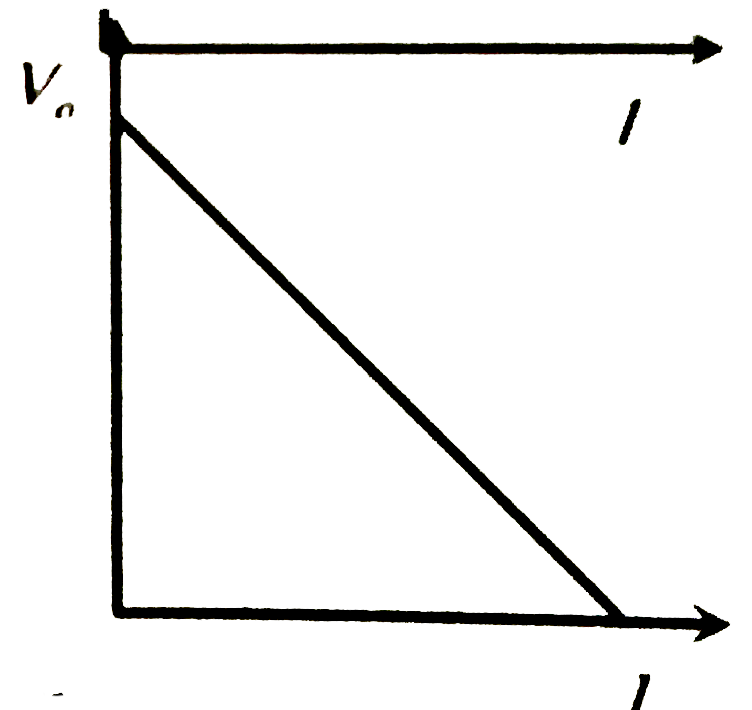
The correct Answer is:B
Step by step video, text & image solution for The correct curve between the stopping potential (V) and intensity of incident light (I) is by Physics experts to help you in doubts & scoring excellent marks in Class 12 exams.
Updated on:21/07/2023Topper's Solved these Questions
- ELECTRON, PHOTON, PHOTOELECTRIC EFFECT AND X-RAYSBOOK - ERRORLESS CHAPTER - ELECTRON, PHOTON, PHOTOELECTRIC EFFECT AND X-RAYSEXERCISE - Cathode Rays and Positive Rays
11 Videos
- ELECTRON, PHOTON, PHOTOELECTRIC EFFECT AND X-RAYSBOOK - ERRORLESS CHAPTER - ELECTRON, PHOTON, PHOTOELECTRIC EFFECT AND X-RAYSEXERCISE - Photon and Photoelectric Effect
4 Videos
- ELECTRO MAGNETIC INDUCTIONBOOK - ERRORLESS CHAPTER - ELECTRO MAGNETIC INDUCTIONEXERCISE - SET
20 Videos
- ELECTRONICSBOOK - ERRORLESS CHAPTER - ELECTRONICSEXERCISE - Selv Evaluation Test
23 Videos
Similar Questions
Knowledge Check
As the intensity of incident light increases
APhotoelectric current increasesBPhotoelectric current decreasesCKinetic energy of emitted photoelectrons increasesDKinetic energy of emitted photoelectrons decreasesIn photoelectric effect the slope of straight line graph between stopping potential (V0) and freqency of incident light (v) gives:
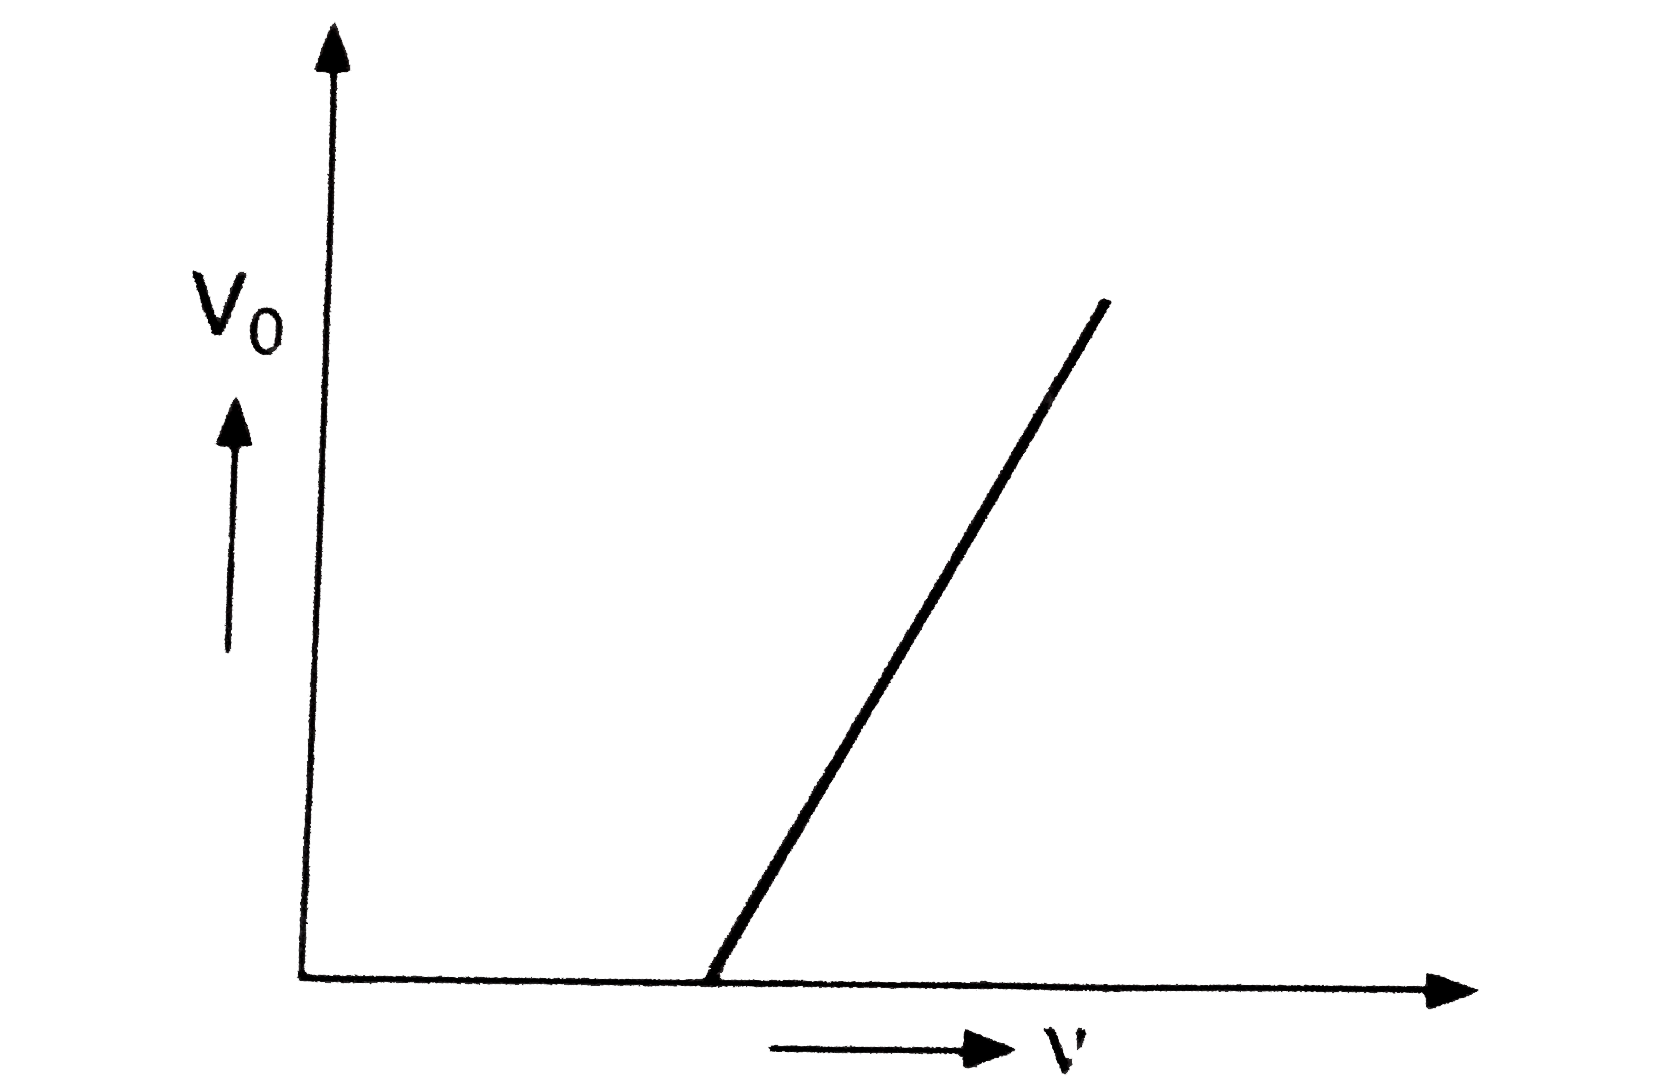 Acharge on electronBwork function of emitterCPlanck's constantDratio of Planck's constant to charge on electron
The figure showing the correct relationship between the stopping potential V and the frequency v of the light for potassium and tungsten is
A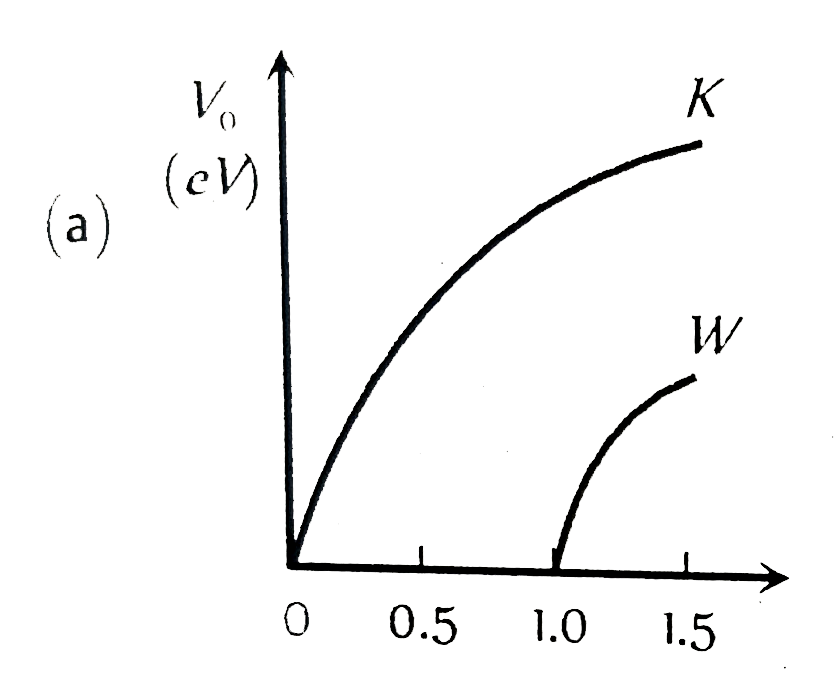 B
B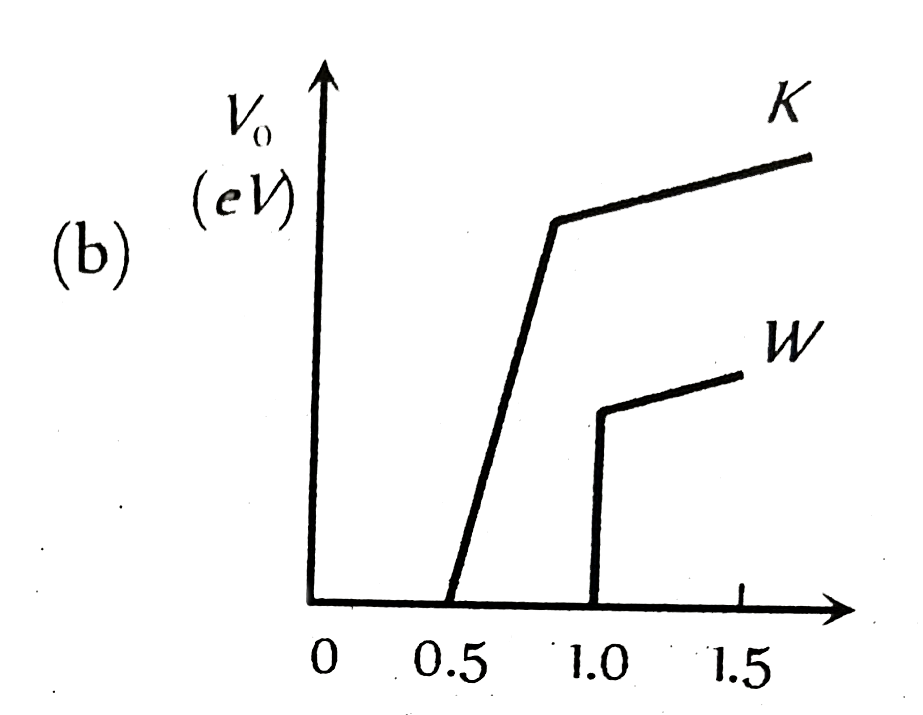 C
C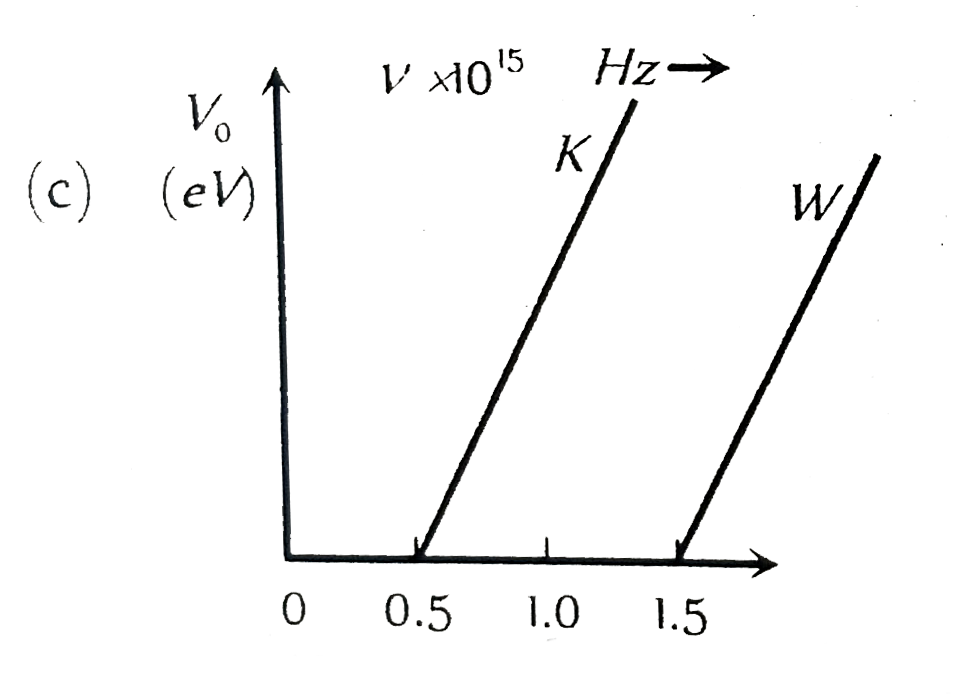 D
D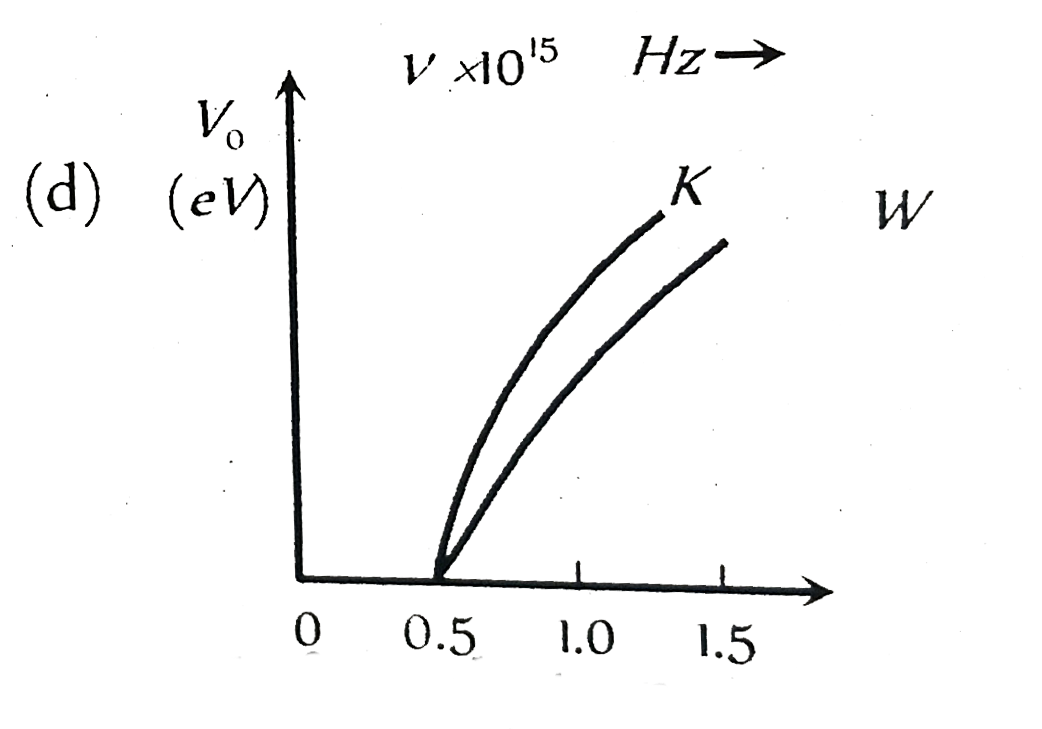
Of the following statement about the photoelectric effect, which are true and which are false?
(a) The greater the frequency of the incident light is, the greater is the stopping potential.
(b) The greater the intensity of the incident light is, the greater is the cutoff frequency.
(c) The greater the work function of the target material is, the greater is the stopping potential.
(d) The greater the work function of the target material is, the greater is the cutoff frequency.
(e) The greater the frequency of the incident light is, the greater is the maximum kinetic energy of the ejected electrons.
(f) The greater the energy of the photons is, the smaller is the stopping potential.
View SolutionChoose the graph showing the correct relationship between the stopping potential V0 and the frequency v of light for potassium and tungsten.
View SolutionThe graph between stopping potential and intensity of light in photoelectric effect is
View SolutionIn the given diagram if V represent the stopping potential and wavelength of incident light is λ. If V2>V1 then
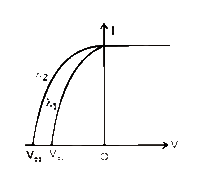
View SolutionFrom the graph shown, the value of work function if the stopping potential (V), and frequency of the incident light vare on y and x-axes respectively is
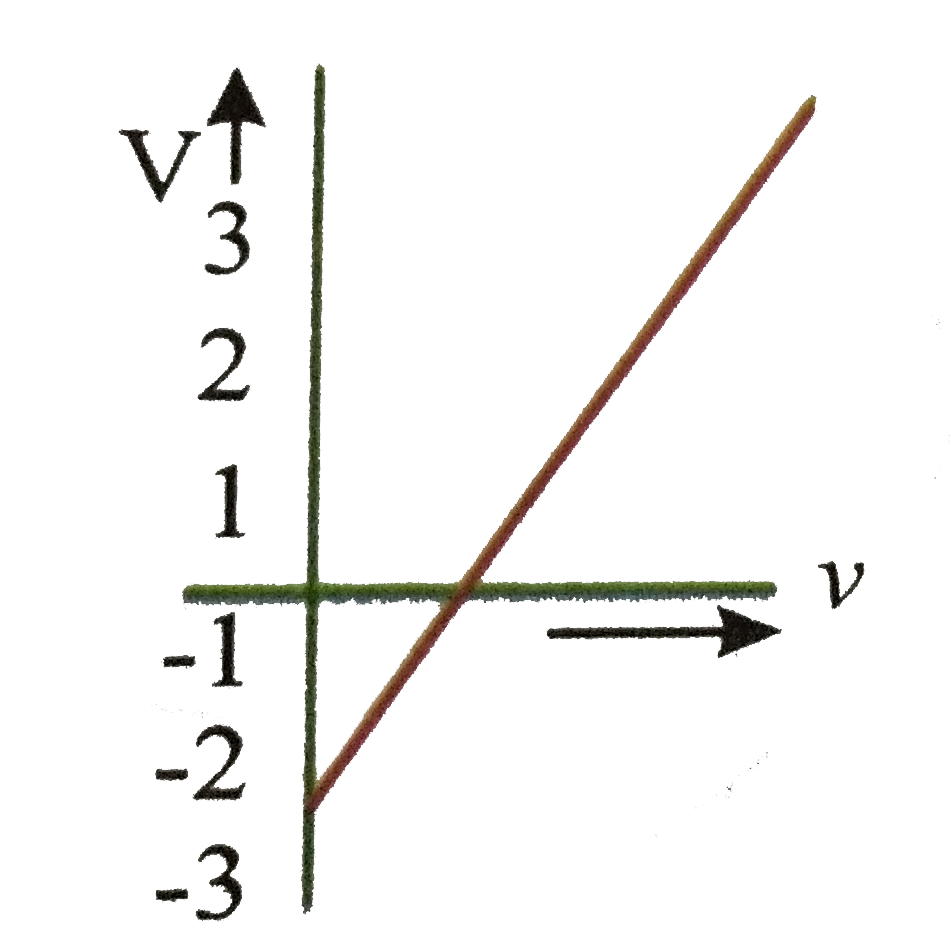
View Solution

