Choose the graph showing the correct relationship between the stopping potential V0 and the frequency v of light for potassium and tungsten.


The correct Answer is:C
Topper's Solved these Questions
- ELECTRONS AND PHOTONSBOOK - TARGET PUBLICATIONCHAPTER - ELECTRONS AND PHOTONSEXERCISE - Competitive Thinking
78 Videos
- ELECTRONS AND PHOTONSBOOK - TARGET PUBLICATIONCHAPTER - ELECTRONS AND PHOTONSEXERCISE - Evaluation Test
19 Videos
- ELECTRONS AND PHOTONSBOOK - TARGET PUBLICATIONCHAPTER - ELECTRONS AND PHOTONSEXERCISE - Evaluation Test
19 Videos
- COMMUNICATION SYSTEMSBOOK - TARGET PUBLICATIONCHAPTER - COMMUNICATION SYSTEMSEXERCISE - Evaluation Test
15 Videos
- FORCE BOOK - TARGET PUBLICATIONCHAPTER - FORCE EXERCISE - Evaluation Test
16 Videos
Similar Questions
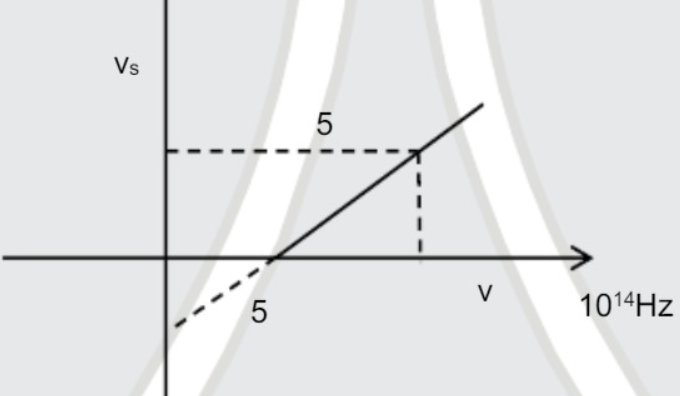
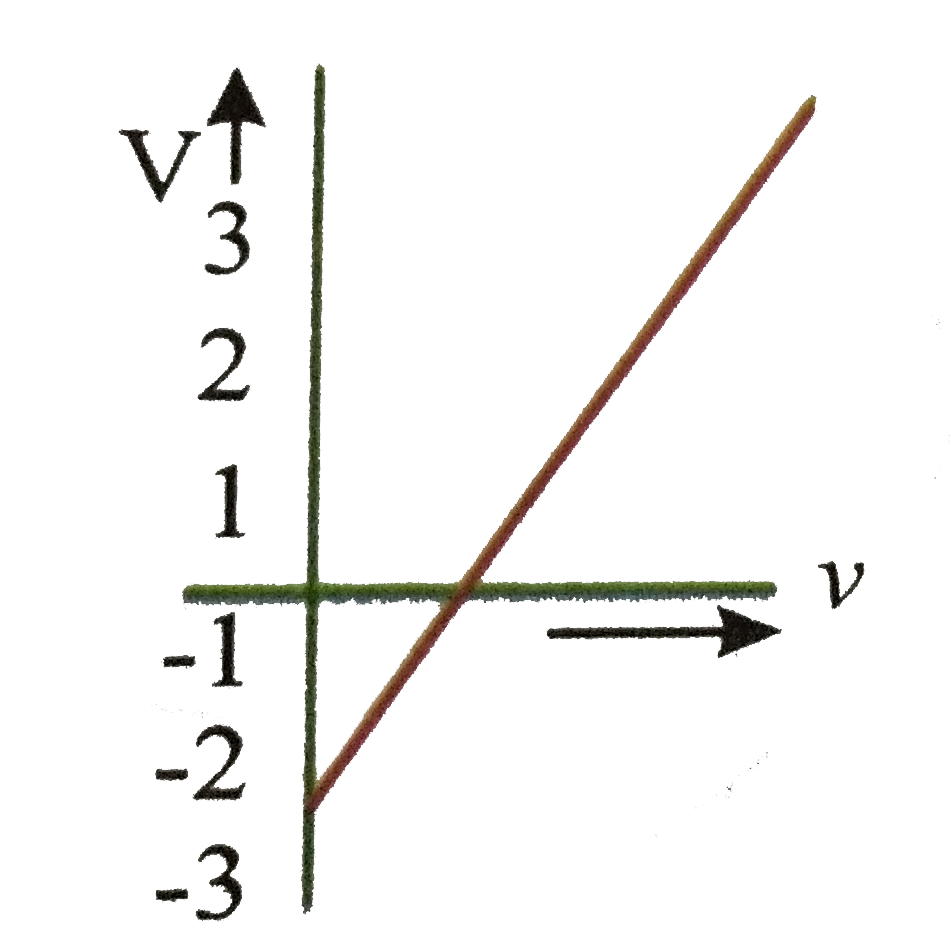
Graph between stopping potential and frequency of light as shown find the work function
View SolutionThe figure shows different graphs between stopping potential (V0) and frequency (v) for photosensitive surface of cesium , potassium , sodium and lithium. The plots are parallel. Correct ranking of the targets according to their work function greatest forst will be

View Solution
Knowledge Check
The figure showing the correct relationship between the stopping potential V and the frequency v of the light for potassium and tungsten is
A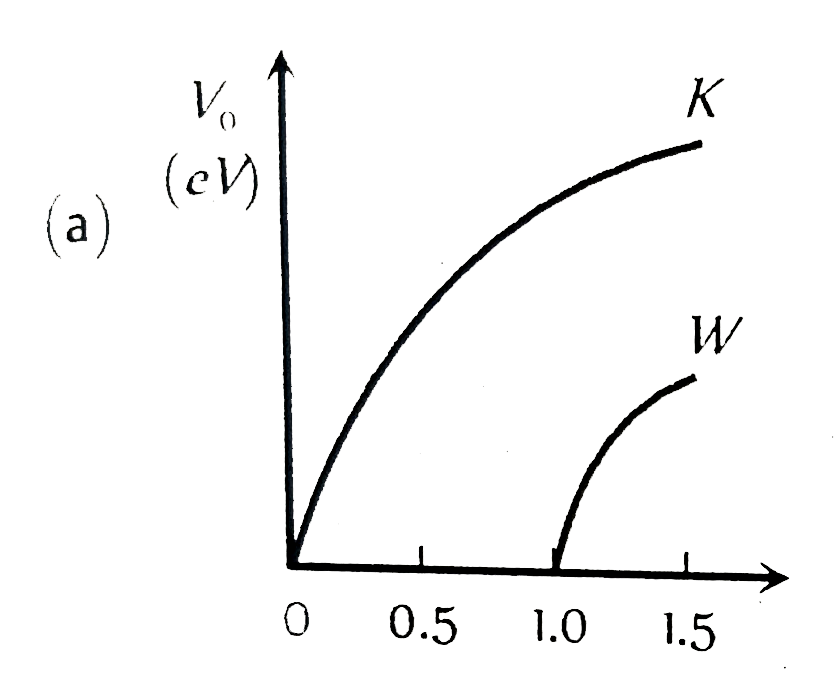 B
B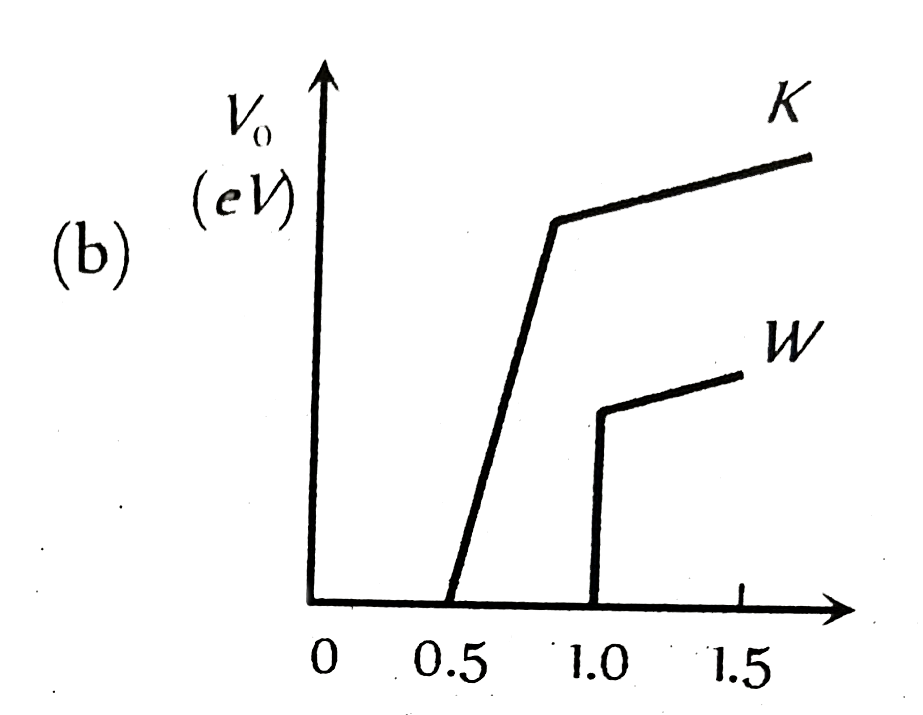 C
C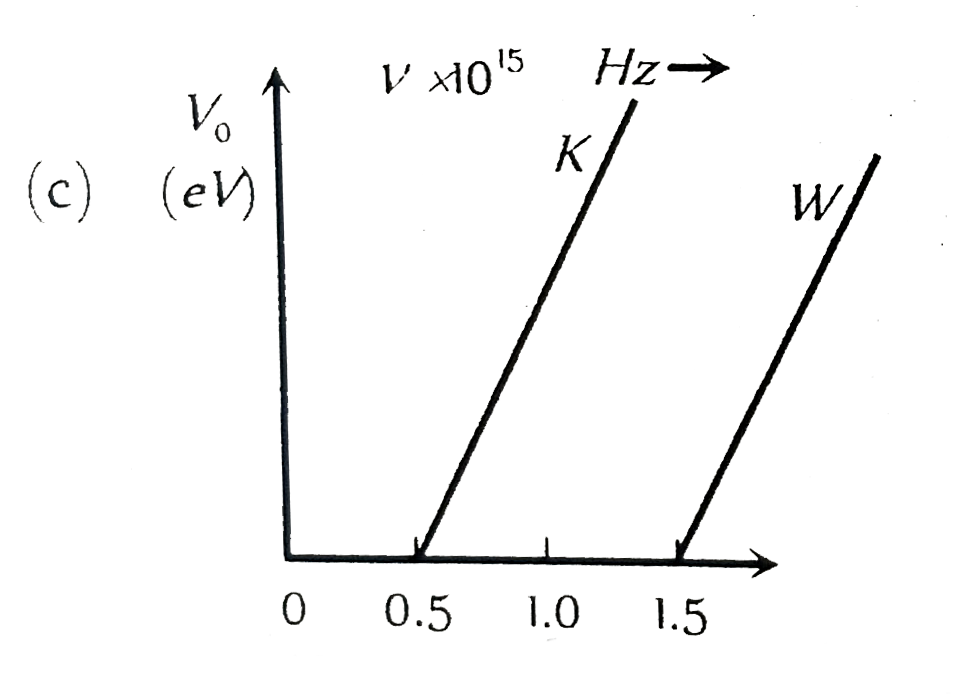 D
D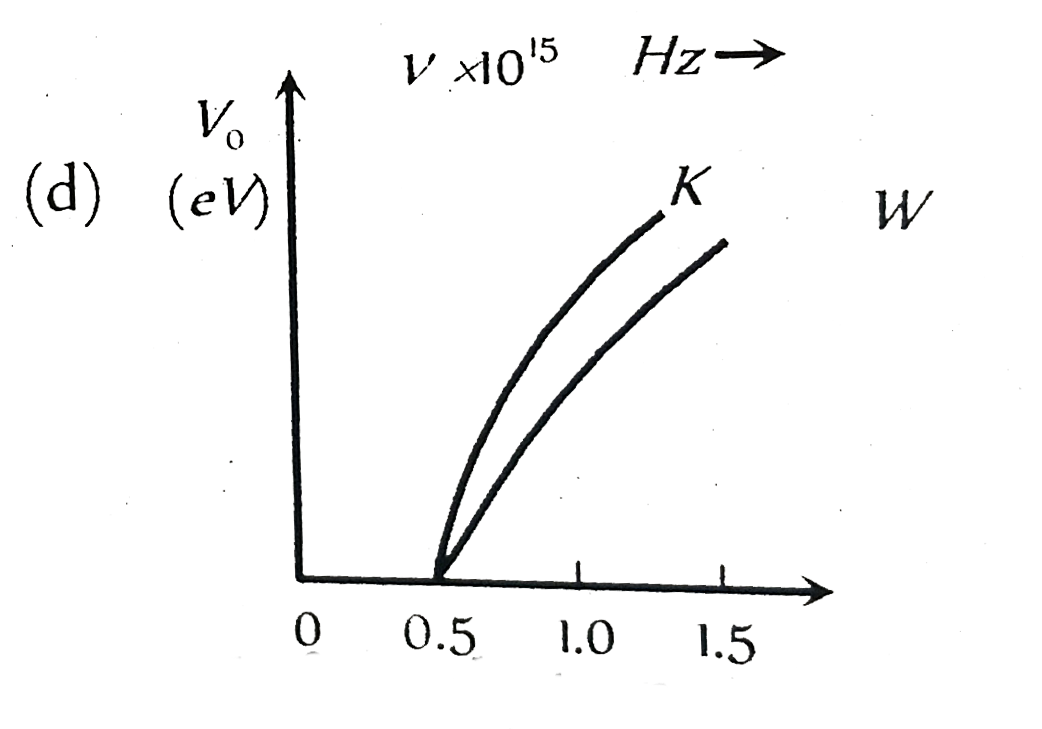
The correct curve between the stopping potential (V) and intensity of incident light (I) is
A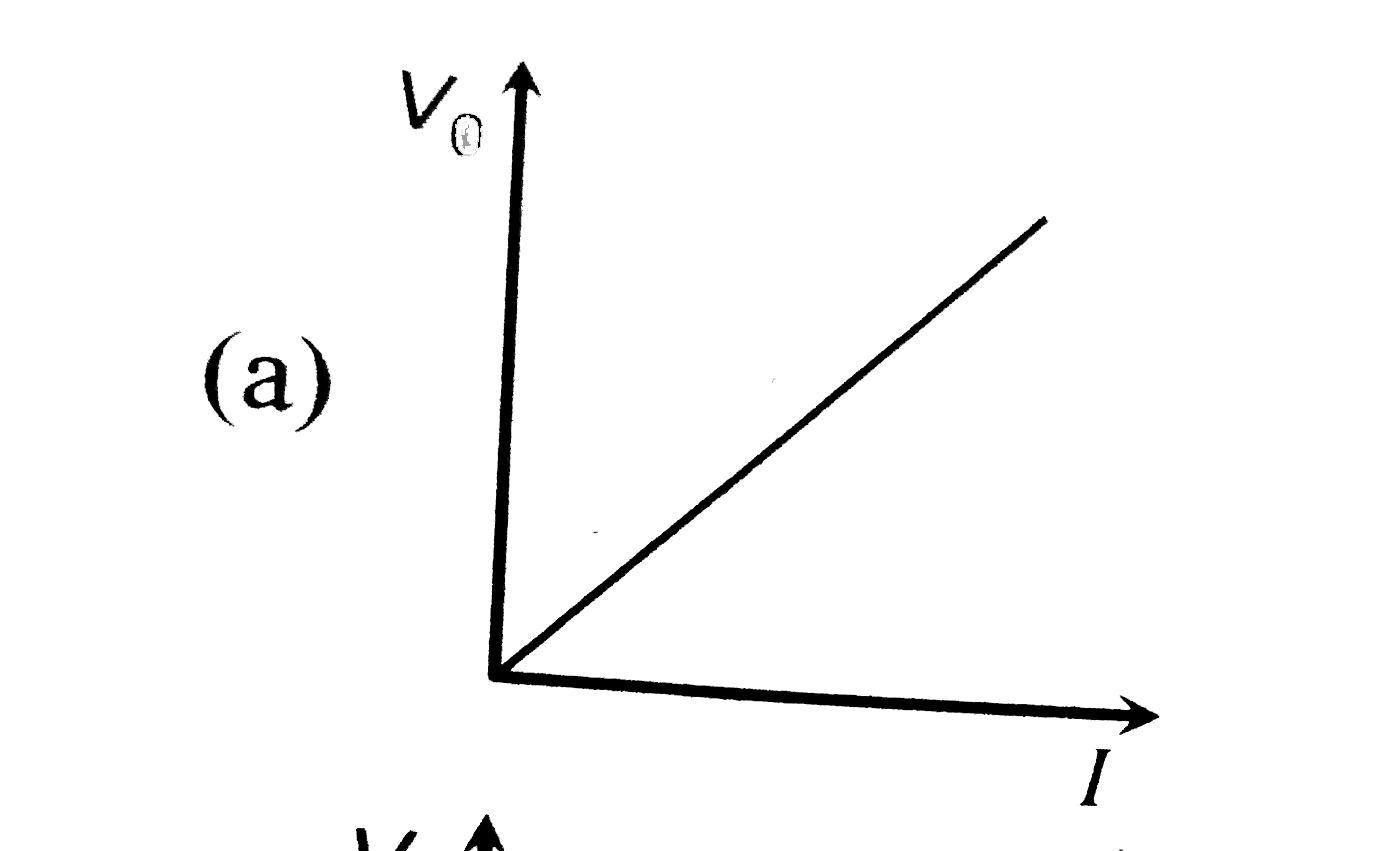 B
B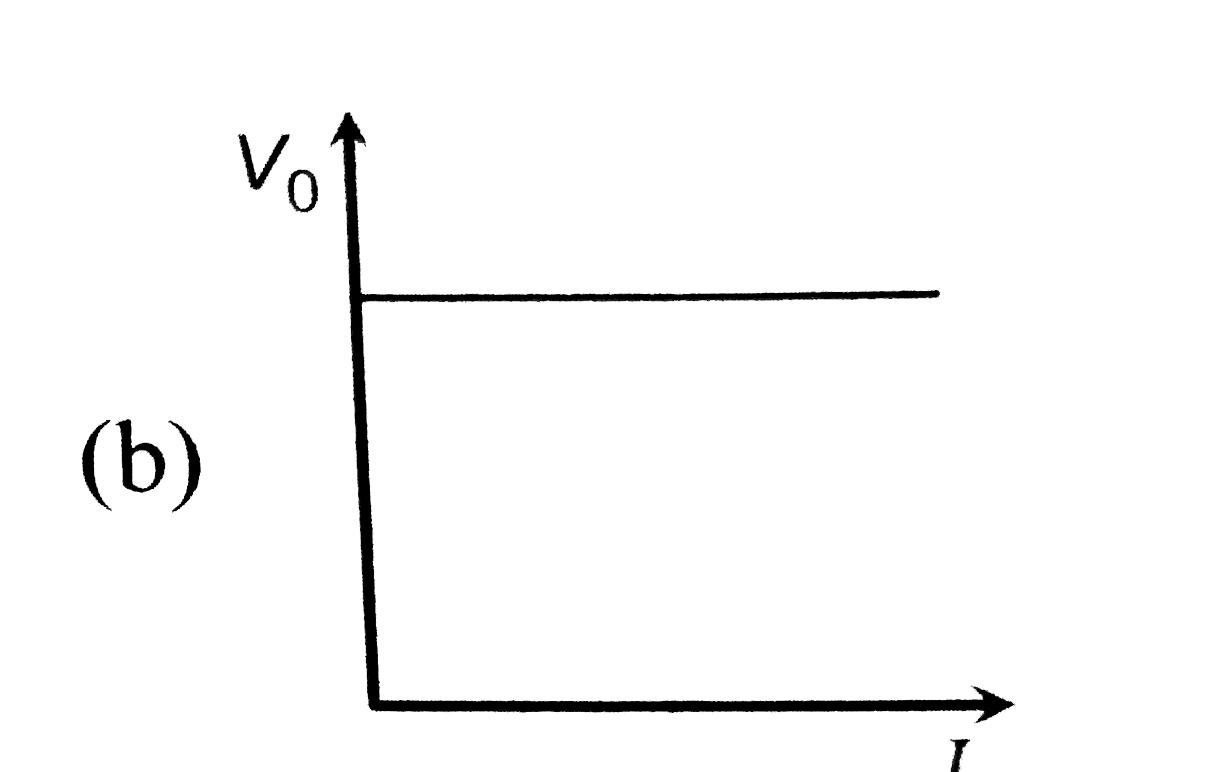 C
C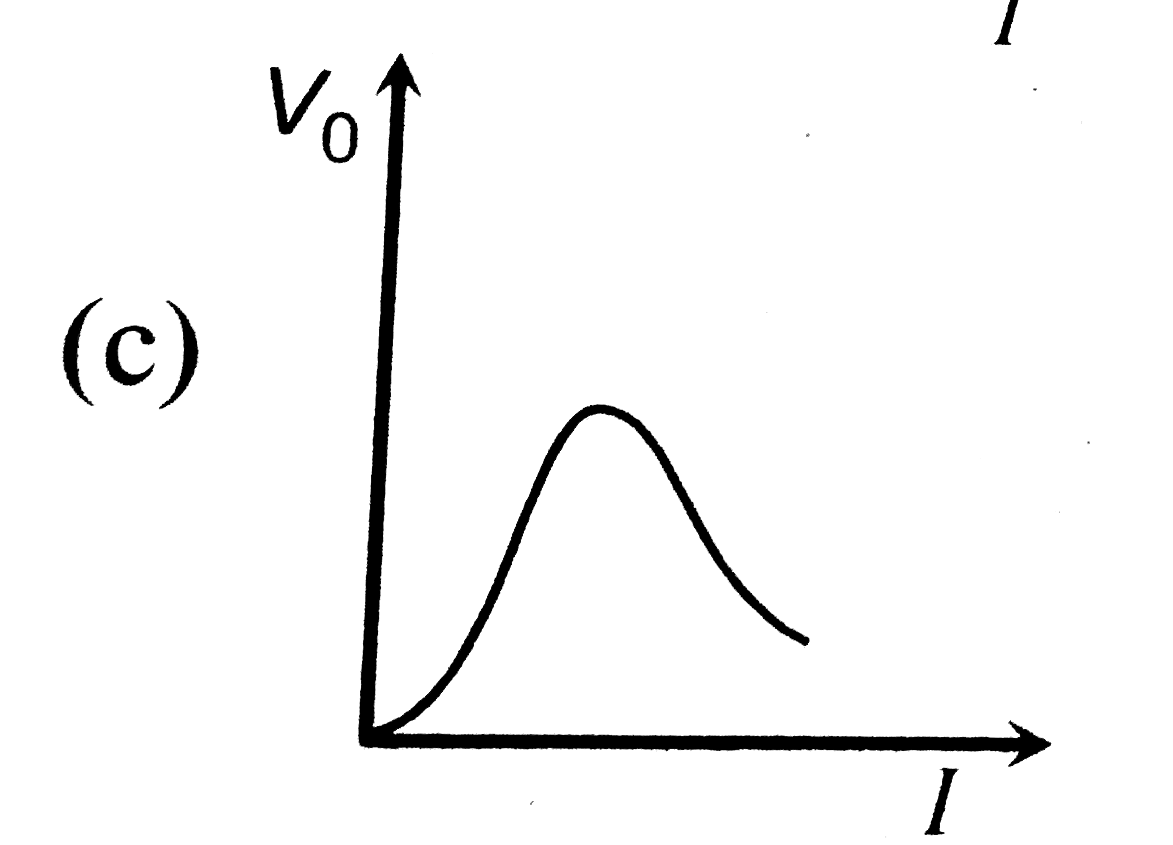 D
D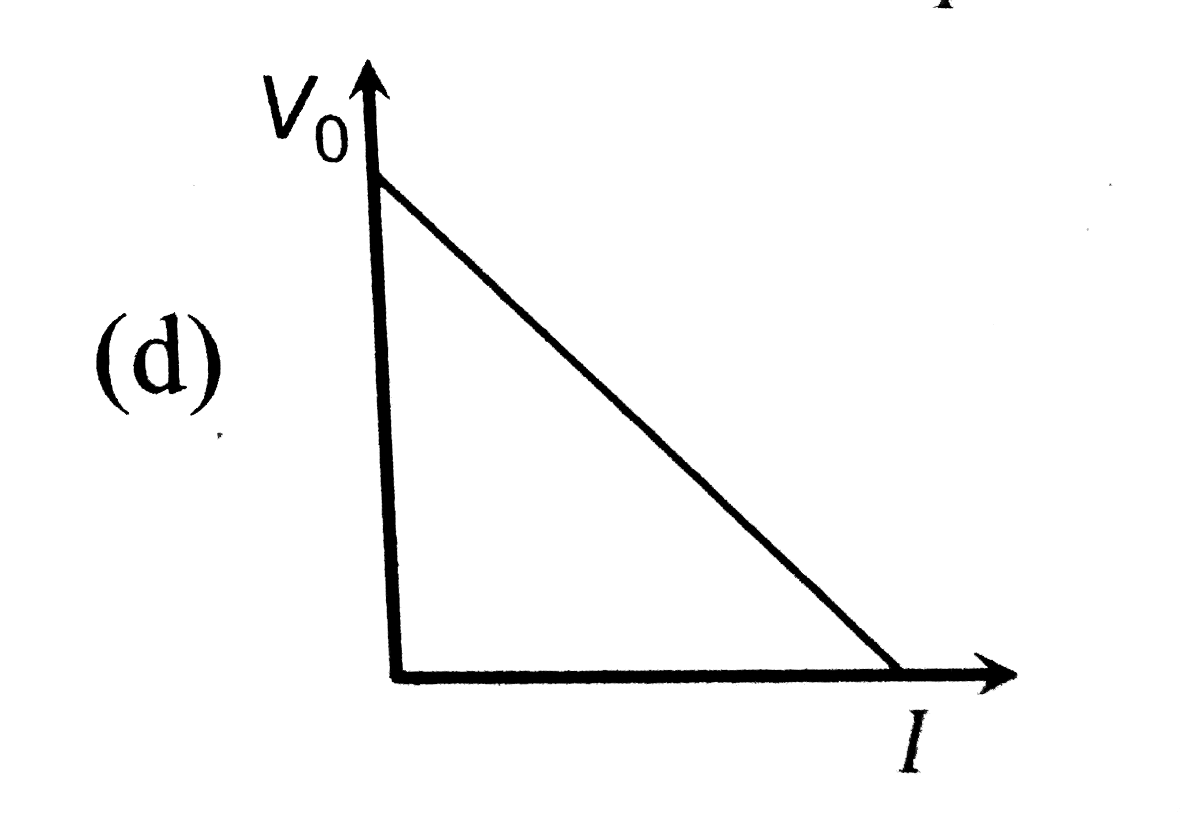
Graph between stopping potential and frequency of light as shown find the work function
 A4.01 evB2.07 evC5.01 evD2.09 ev
Draw a graph between stopping potential and the frequency of two metals A and B having threshold frequencies v0and2v0 .
View SolutionRelation between the stopping potential V0 of a metal and the maximum velocity of the photoelectrons is
View SolutionFrom the graph shown, the value of work function if the stopping potential (V), and frequency of the incident light vare on y and x-axes respectively is
View SolutionThe figure shows different graphs between stopping potential (V0) and frequency (v) for photosensitive surface of cesium , potassium , sodium and lithium. The plots are parallel. Correct ranking of the targets according to their work function greatest first will be

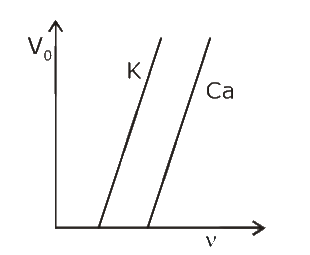
View SolutionIn the diagram, graph are drawn between stopping potential V0 and frequency v for the elements K and Ca. According this to diagram
View Solution
