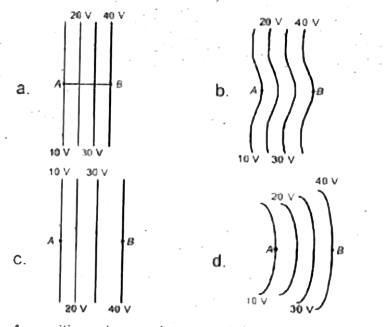
The diagram below show regions of equipotential:
A positive chrages is moved from A to B in each diagram.
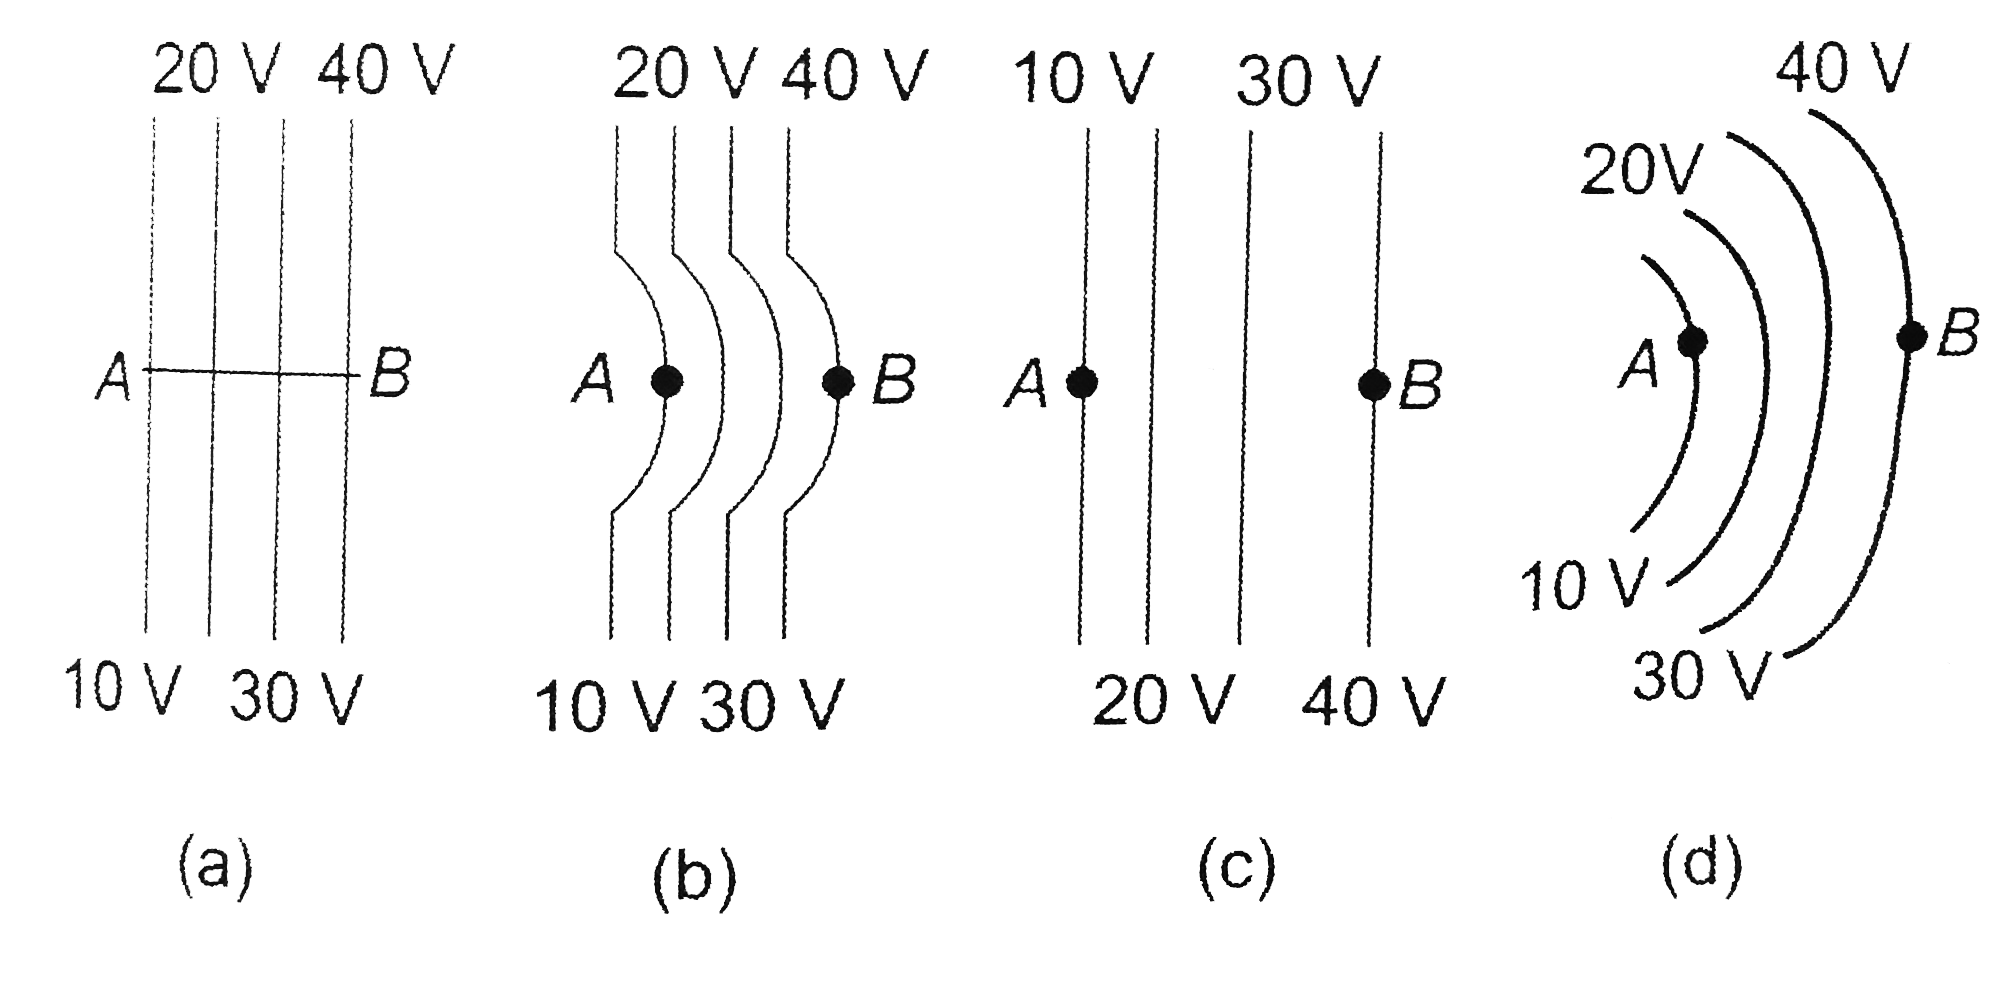
Maximum work is required to move q in figure (ii)
In all the four cases, the work done is the same
Minimum work is required to move q in figure (i)
Maximum work is required to move q in figure (ii)
The correct Answer is:B
Step by step video, text & image solution for The diagram below show regions of equipotential: A positive chrages is moved from A to B in each diagram. by Physics experts to help you in doubts & scoring excellent marks in Class 12 exams.
Updated on:21/07/2023Topper's Solved these Questions
Similar Questions
Knowledge Check
The diagrams below show region of equipotentials.
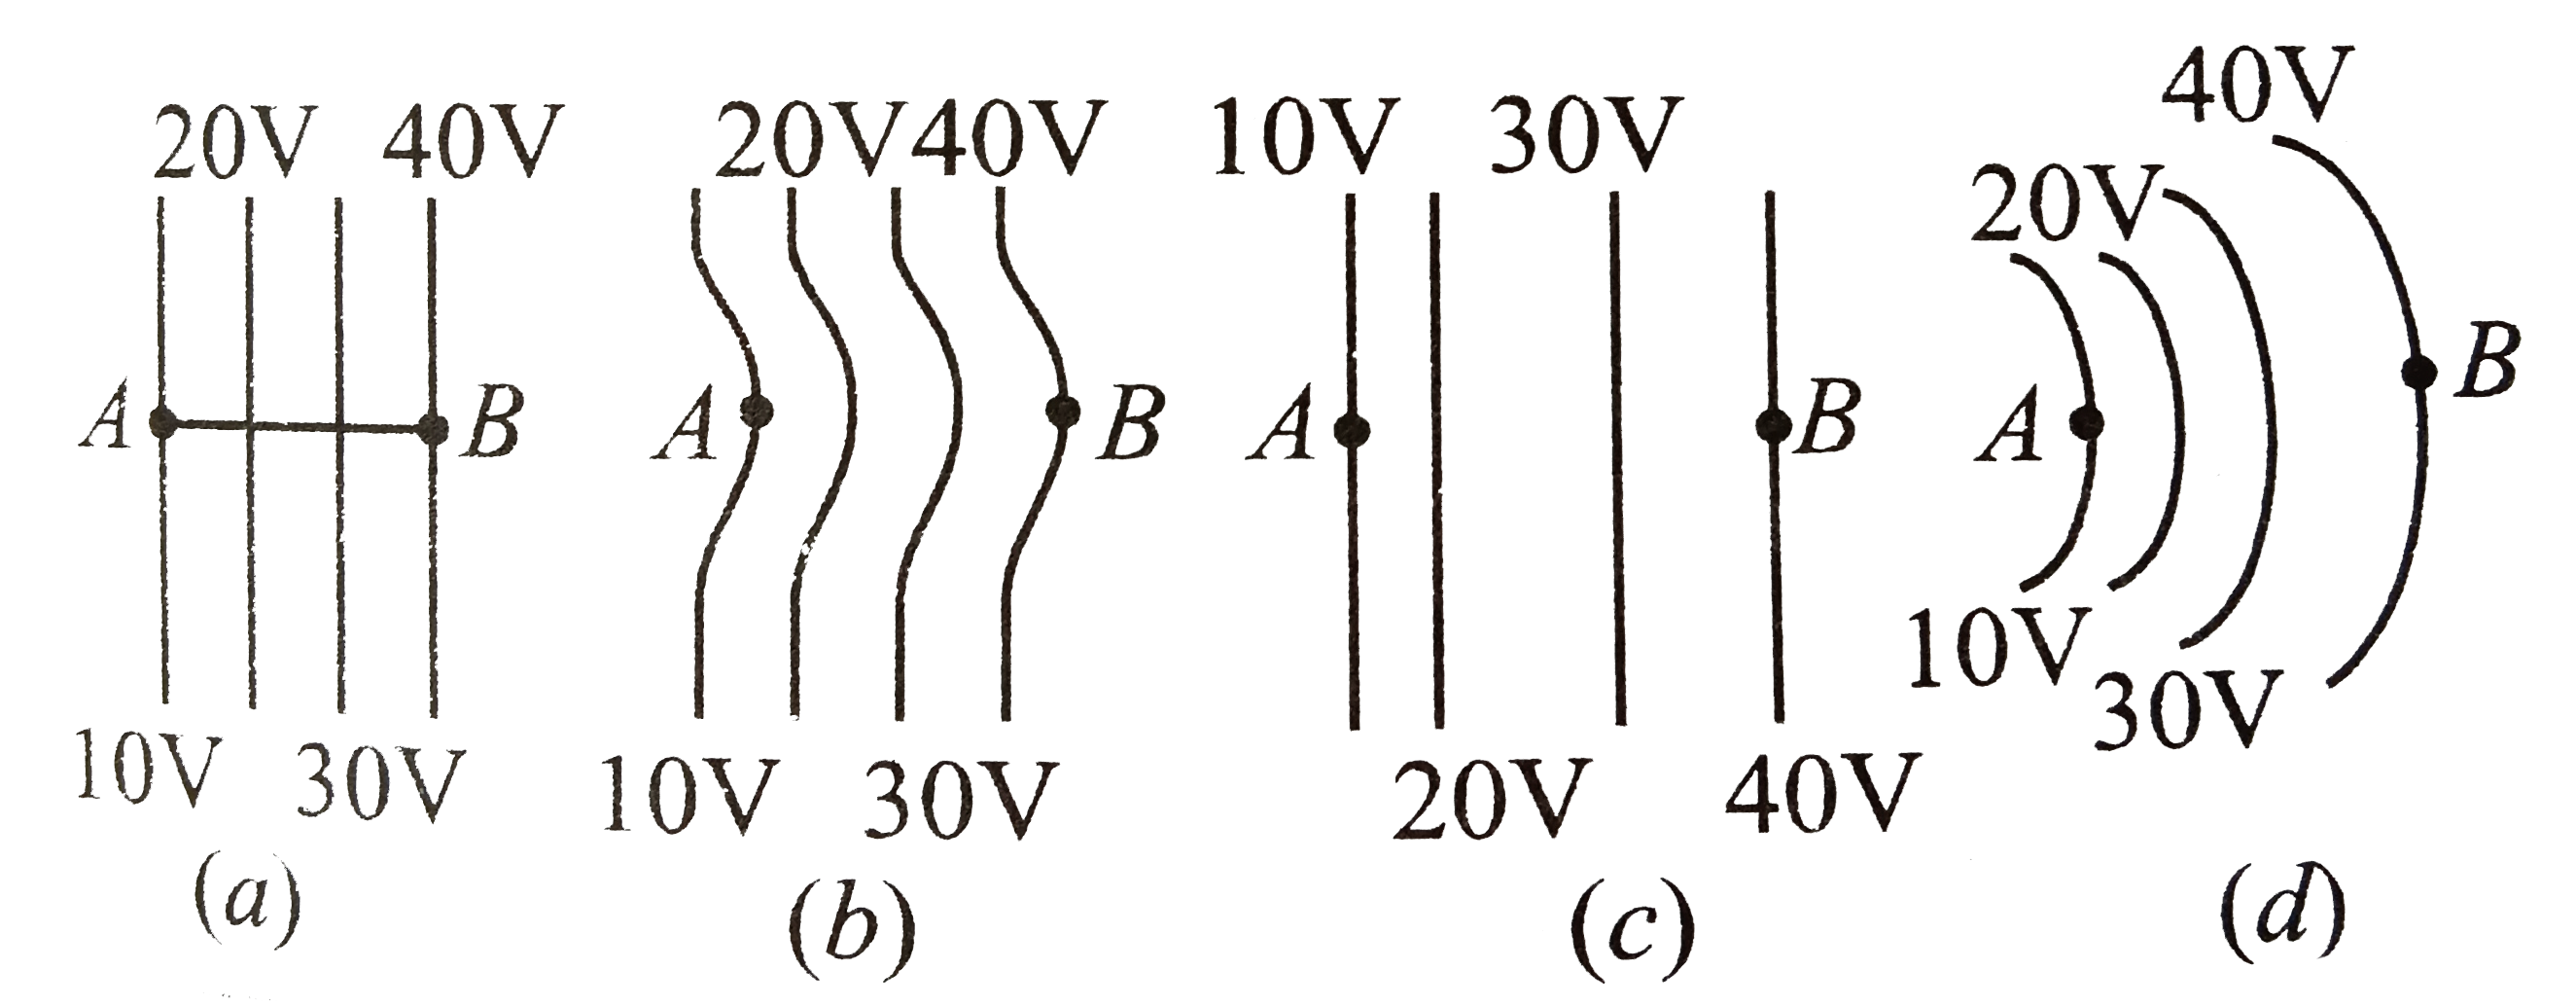 AMaximum work is required to move q in figurec (c ).BIn all the four cases, the work doen is the same.CMinimum work is required to move q in figurec (a).DMaximum work is required to move q in figurec (b ).
The diagram below show regions of equipotentials.
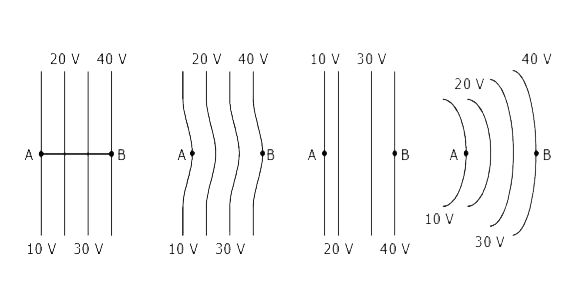
A positive charge is moved from A to B in each diagram.AIn all the four cases the work done is the same.BMinimum work is required to move q in figure (a)CMaximum work is required to move q in figure (b)DMaximum work is required to move q in figure (c )The diagram below show region of equipotentials.
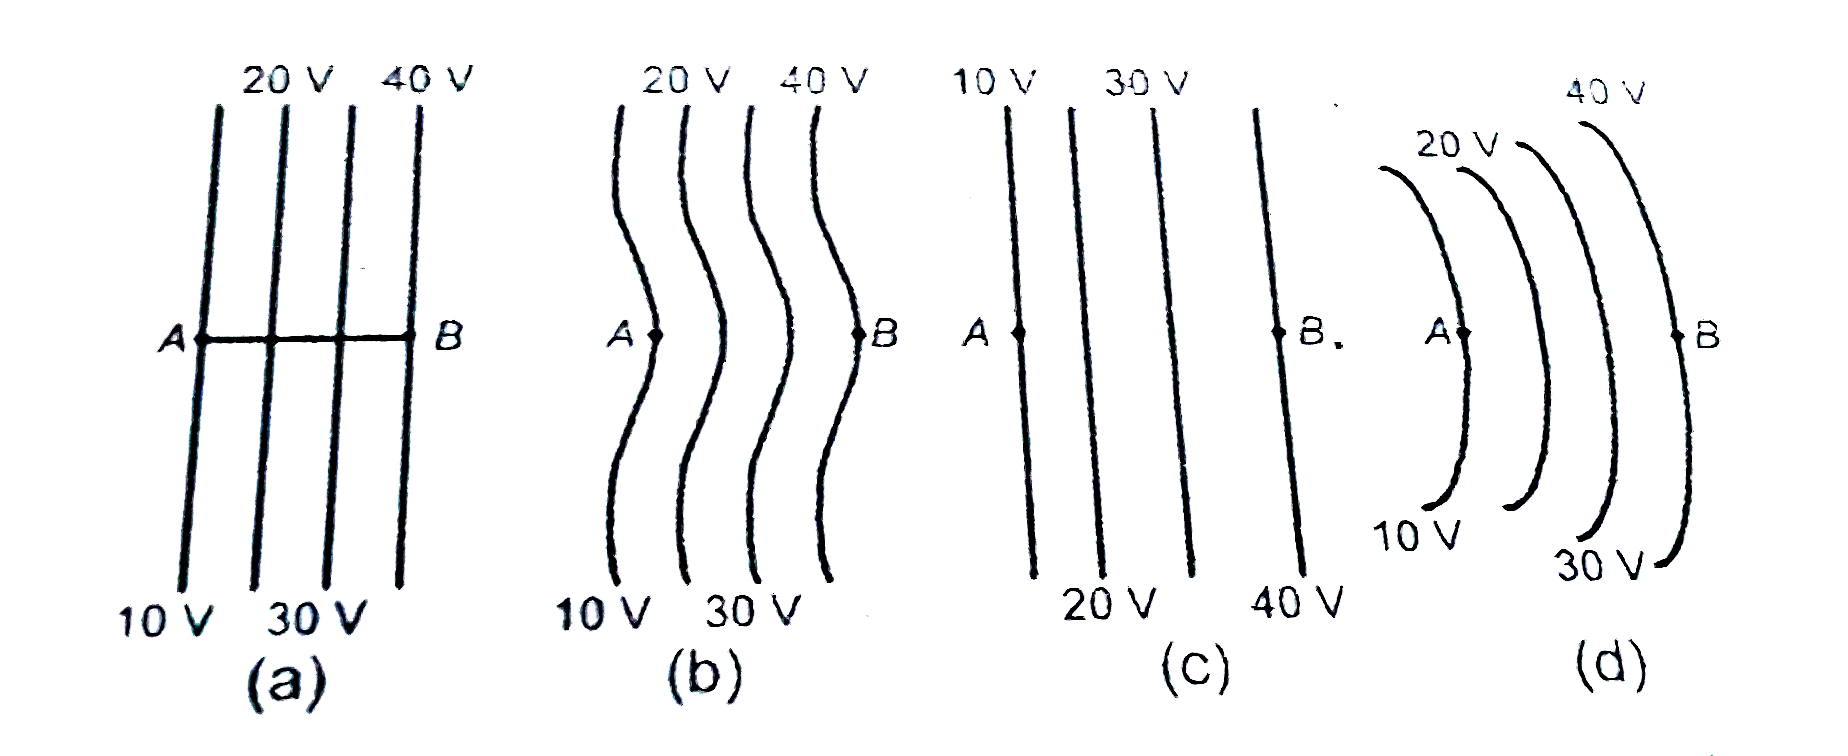
A positive charge is moved from A to B in each diagram .AIn all the four cases the work done is the sameBMinimum work is required to move q in figure (a)CMaximum work is required to move q in figure (b)DMaximum work is required to move q in figure (c )
The diagram below shows a list of decimals.

Which are the highest and lowest decimals?
View SolutionThe diagrams below show regions of equipotentials.
A positve charge is moved from A to B in each diagram.
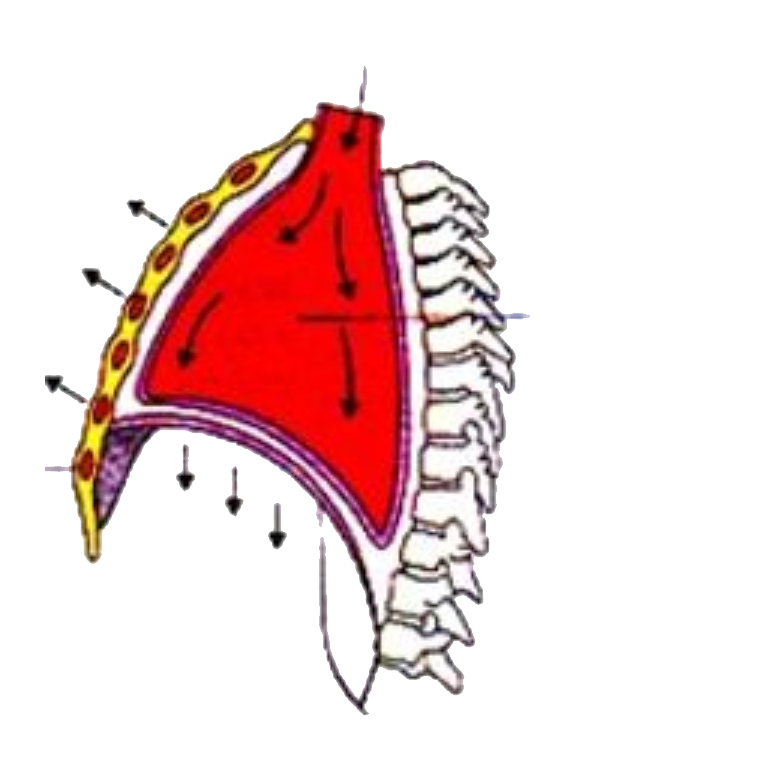
View SolutionThe diagram given below represents
View Solution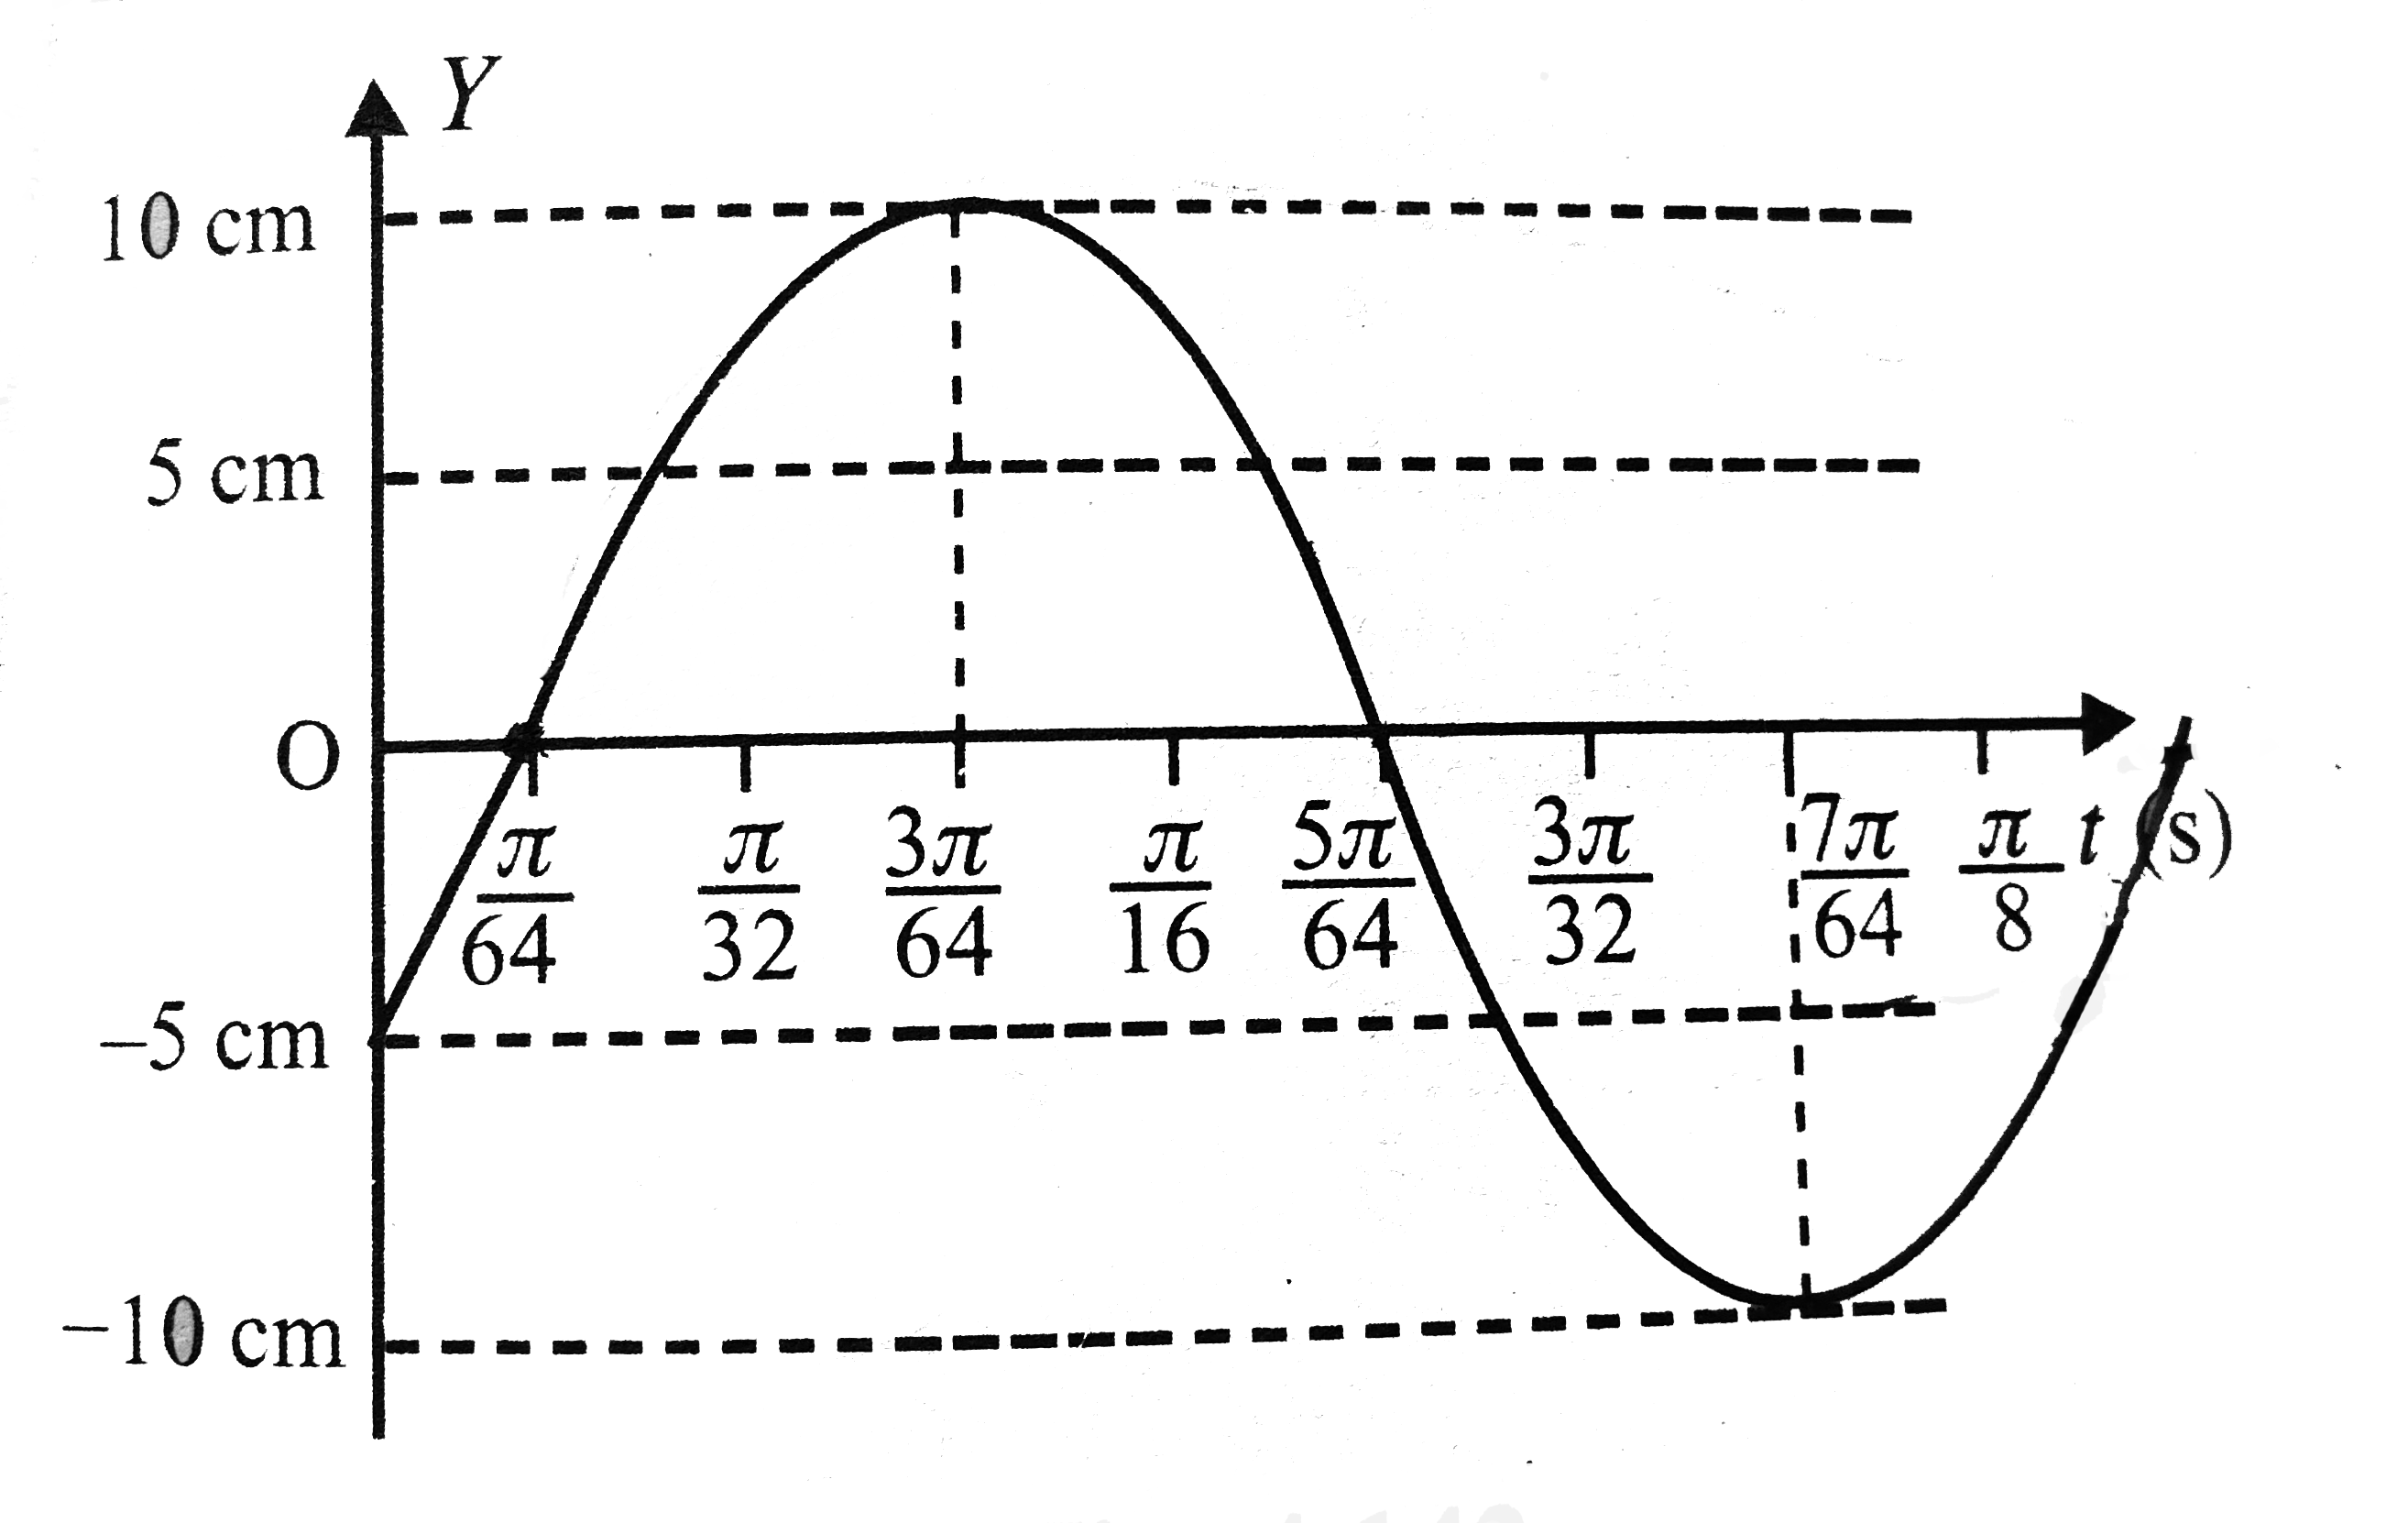
The diagram below shows a sinusoidal curve. The equation of the curve will be
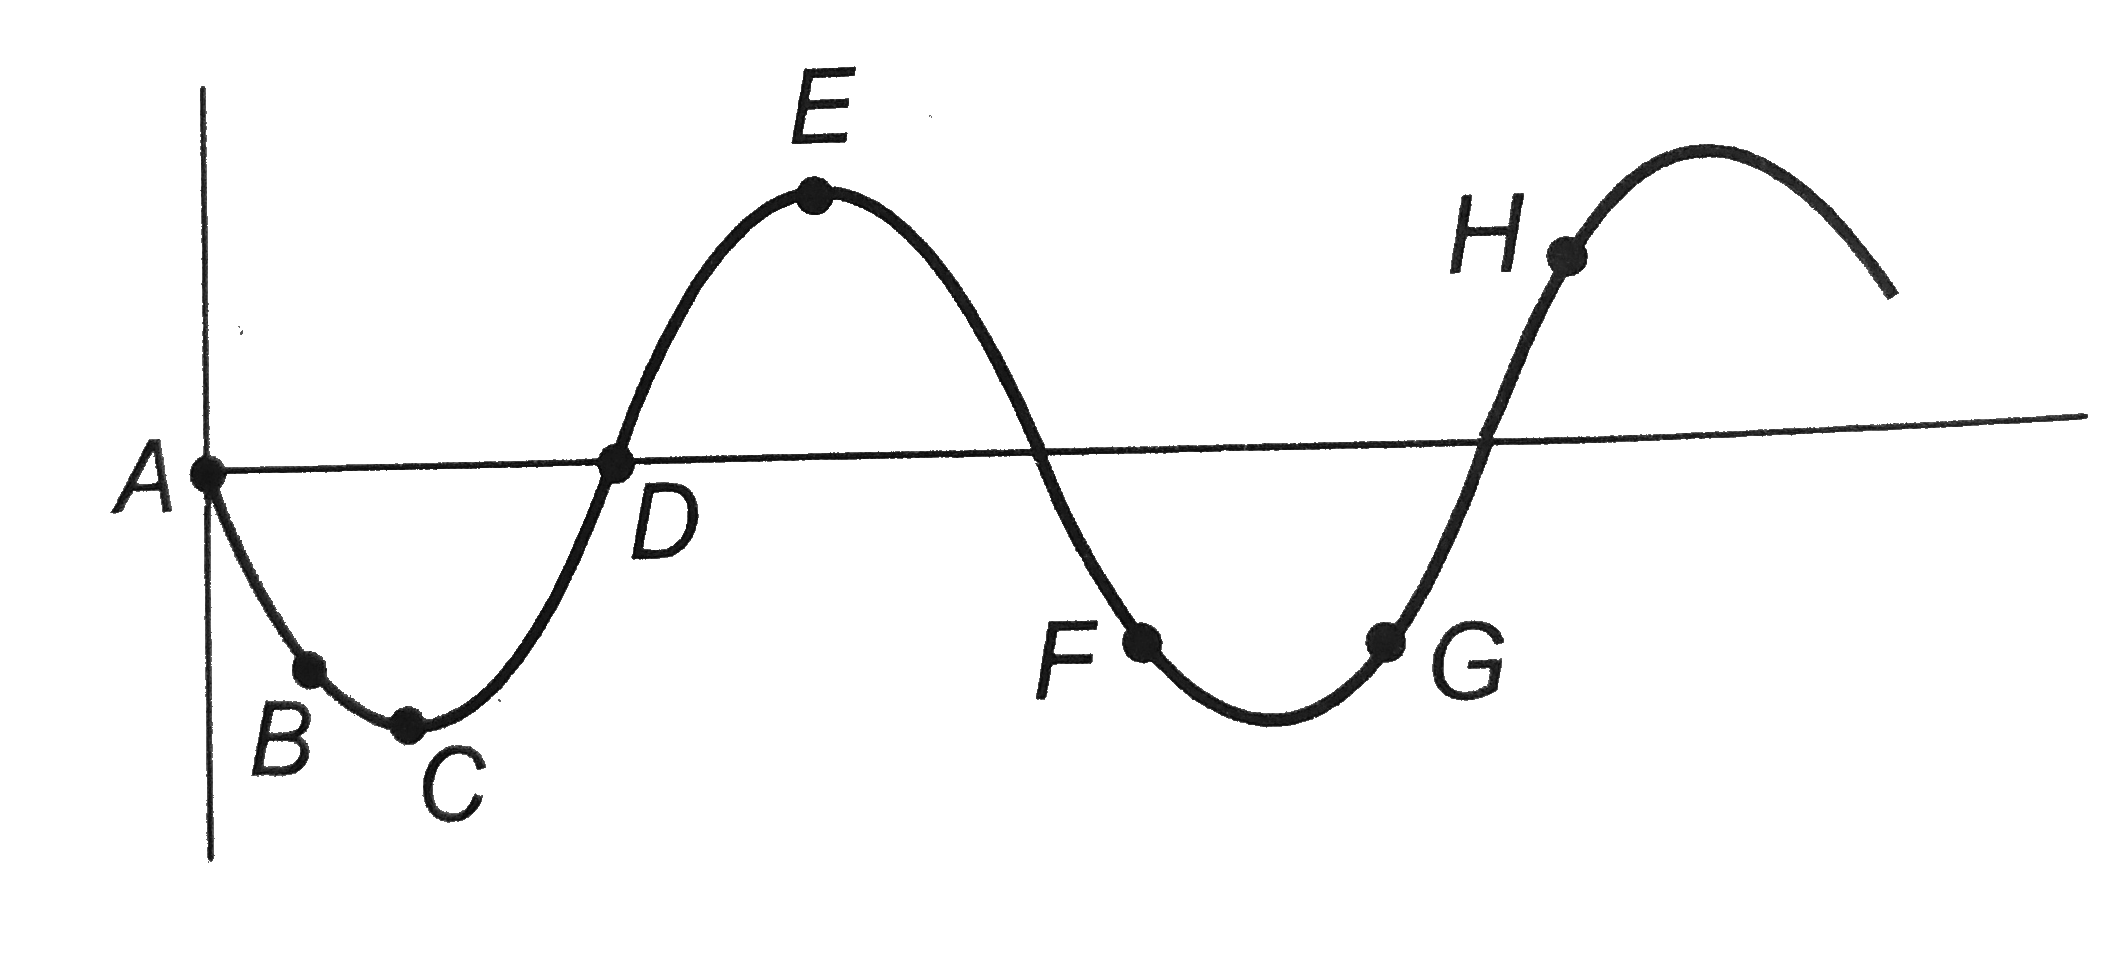
View SolutionThe diagram below shows the propagation of a wave. Which points are in same phase?
 .
.
View Solution

