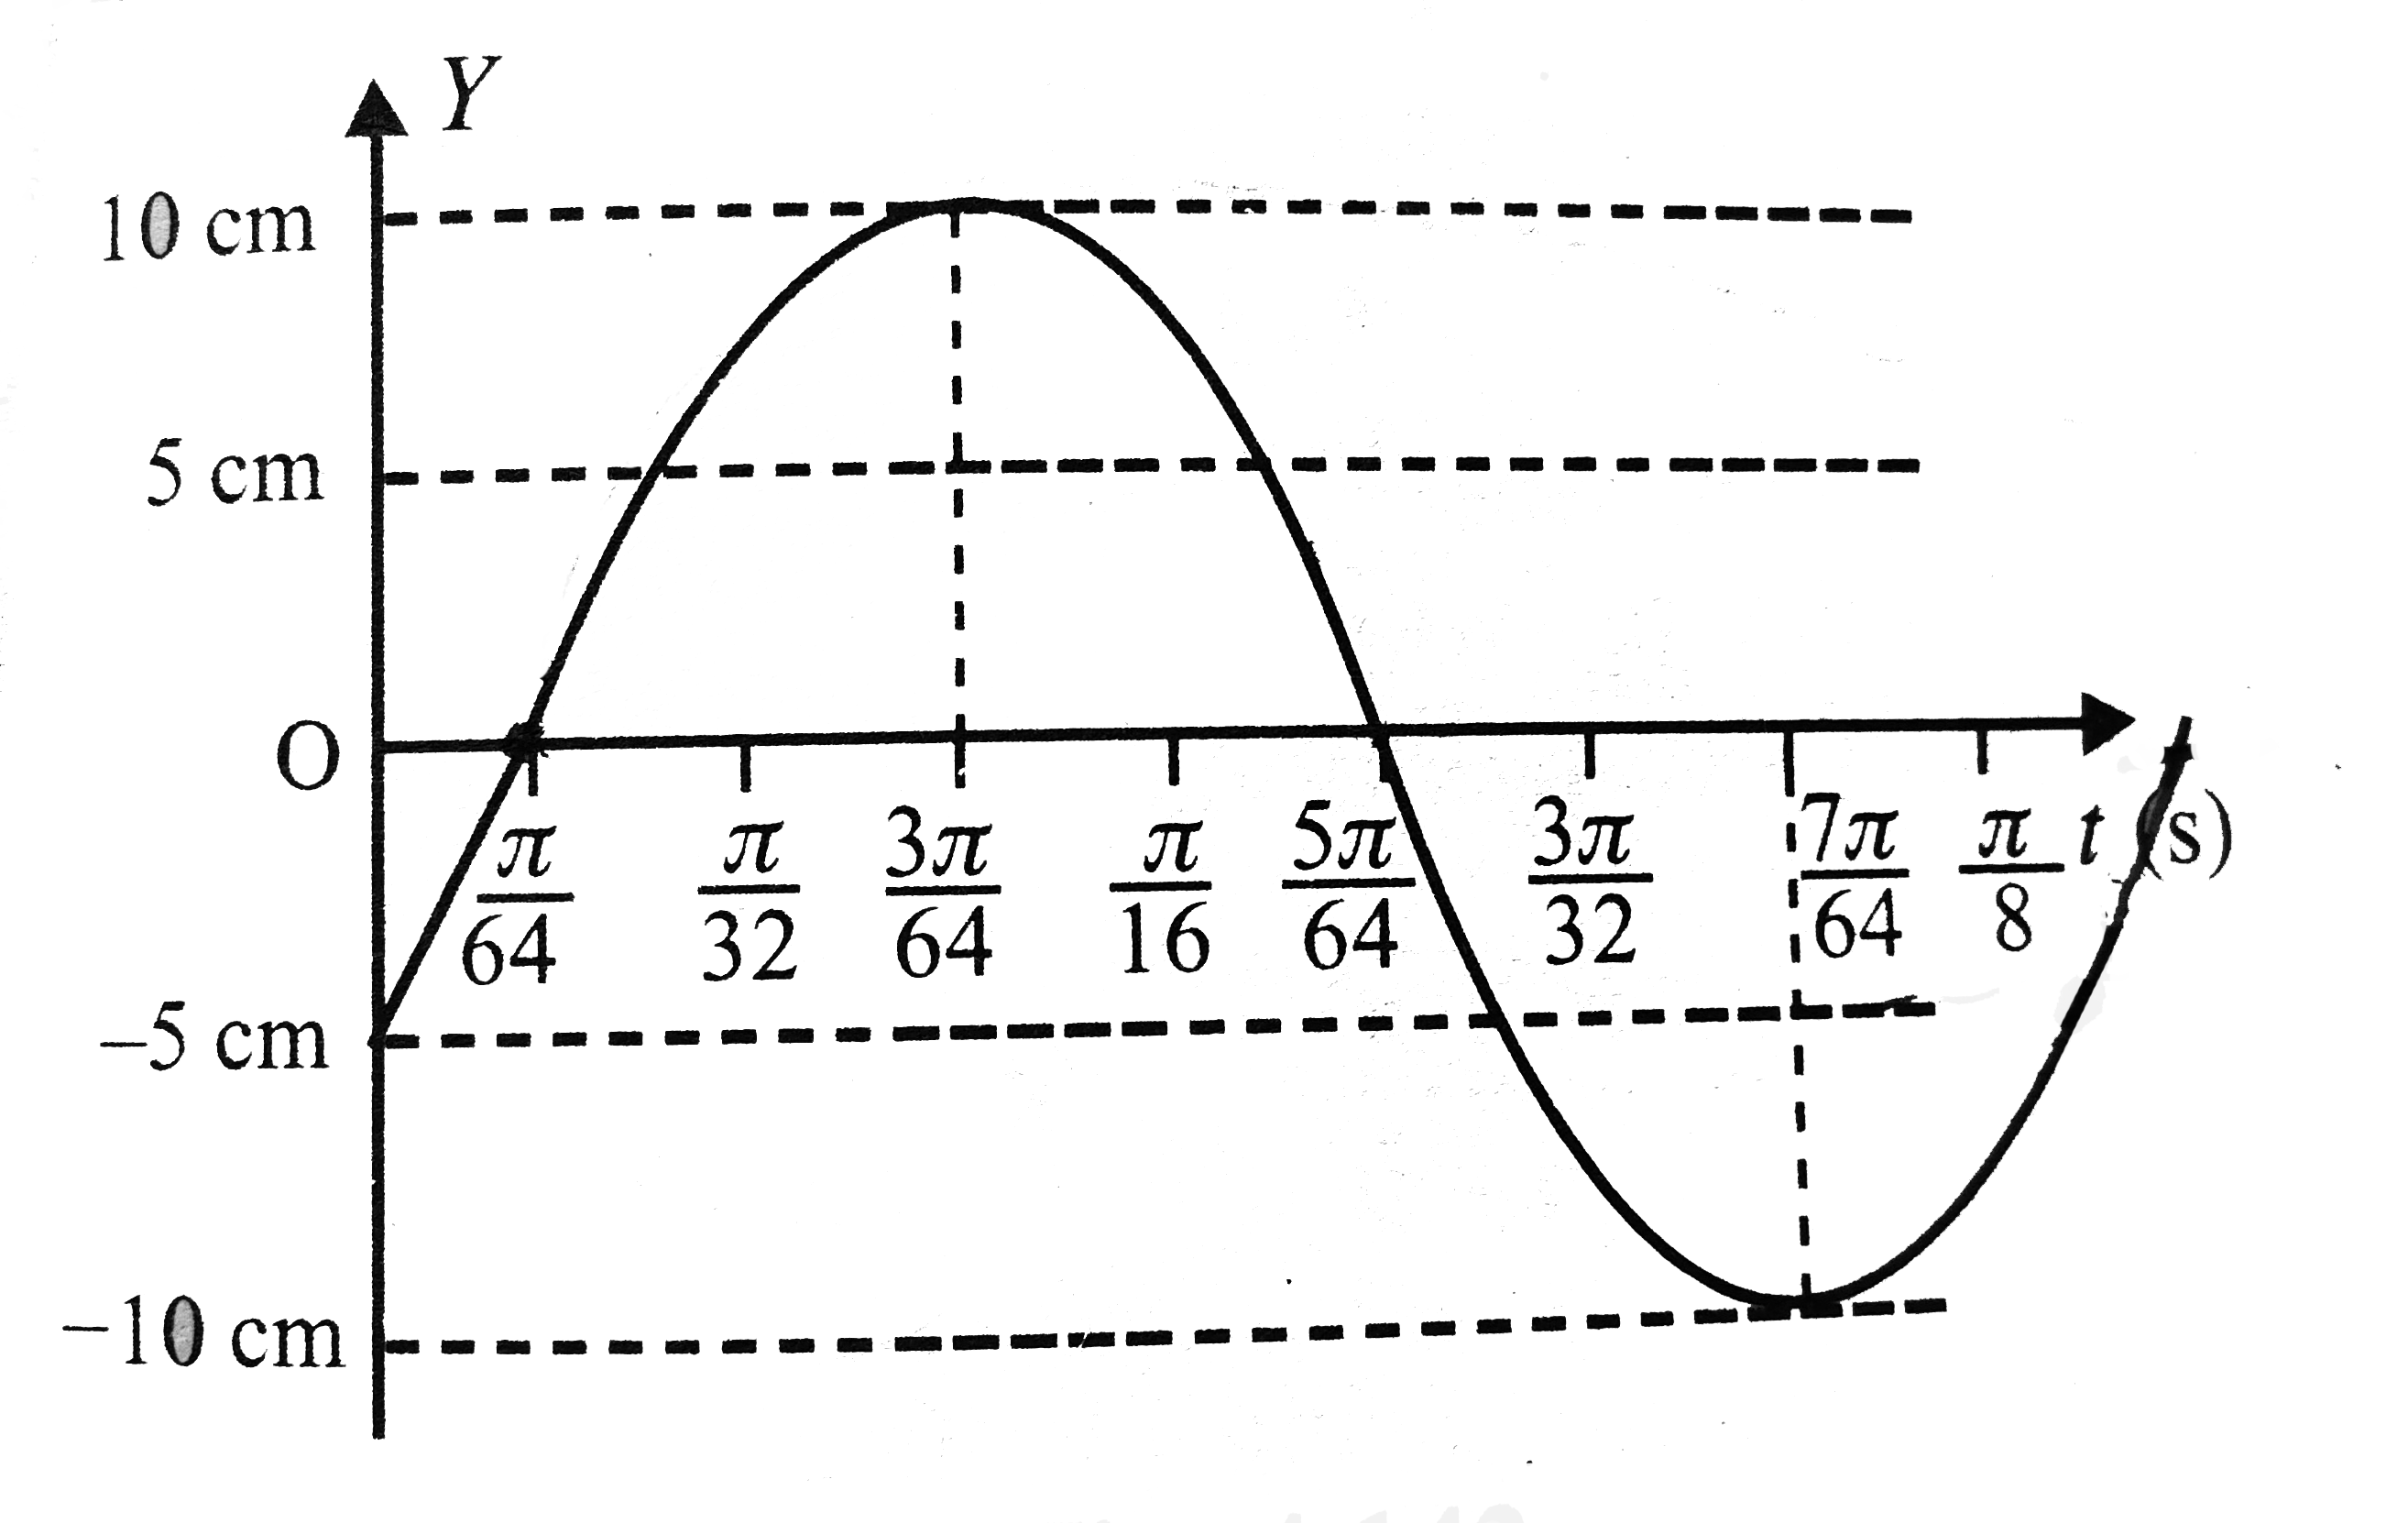
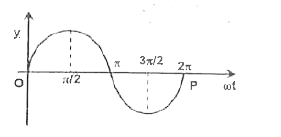
The diagram below shows a sinusoidal curve. The equation of the curve will be
y=10sin(16t+π4)cm
y=10sin(16t+π3)cm
y=10sin(16t−π4)cm
y=10cos(16t+π4)cm
The correct Answer is:C
Let T be the time period , then T2=5π64−π64=4π64
T=π8s
ω=2πT=2π(π8)=16rads
Also, A=10cm (from the graph) The equation of the sinusoidal wave can be written as y=10sin(16t+ϕ) cm where ϕ is the initial phase. From the graph, corresponding to the crest =10cm, when
t=3π64.
=10cm=10sin[16(3π64)+ϕ]cm
sin[3π4+ϕ]=1 or 3π4+ϕ=π2⇒ϕ=−π4
y=10sin(16t−π4)
Topper's Solved these Questions
- BOOK - CENGAGE PHYSICSCHAPTER - LINEAR AND ANGULAR SIMPLE HARMONIC MOTIONEXERCISE - Multiple Correct35videos
LINEAR AND ANGULAR SIMPLE HARMONIC MOTION
- BOOK - CENGAGE PHYSICSCHAPTER - LINEAR AND ANGULAR SIMPLE HARMONIC MOTIONEXERCISE - Assertion Reasoning6videos
LINEAR AND ANGULAR SIMPLE HARMONIC MOTION
- BOOK - CENGAGE PHYSICSCHAPTER - LINEAR AND ANGULAR SIMPLE HARMONIC MOTIONEXERCISE - Subjective21videos
LINEAR AND ANGULAR SIMPLE HARMONIC MOTION
- BOOK - CENGAGE PHYSICSCHAPTER - KINETIC THEORY OF GASES AND FIRST LAW OF THERMODYNAMICSEXERCISE - Interger11videos
KINETIC THEORY OF GASES AND FIRST LAW OF THERMODYNAMICS
- BOOK - CENGAGE PHYSICSCHAPTER - MISCELLANEOUS KINEMATICSEXERCISE - Interger type3videos
MISCELLANEOUS KINEMATICS
Similar Questions
Knowledge Check
- Question 1 - Select One
The diagrams below show region of equipotentials.
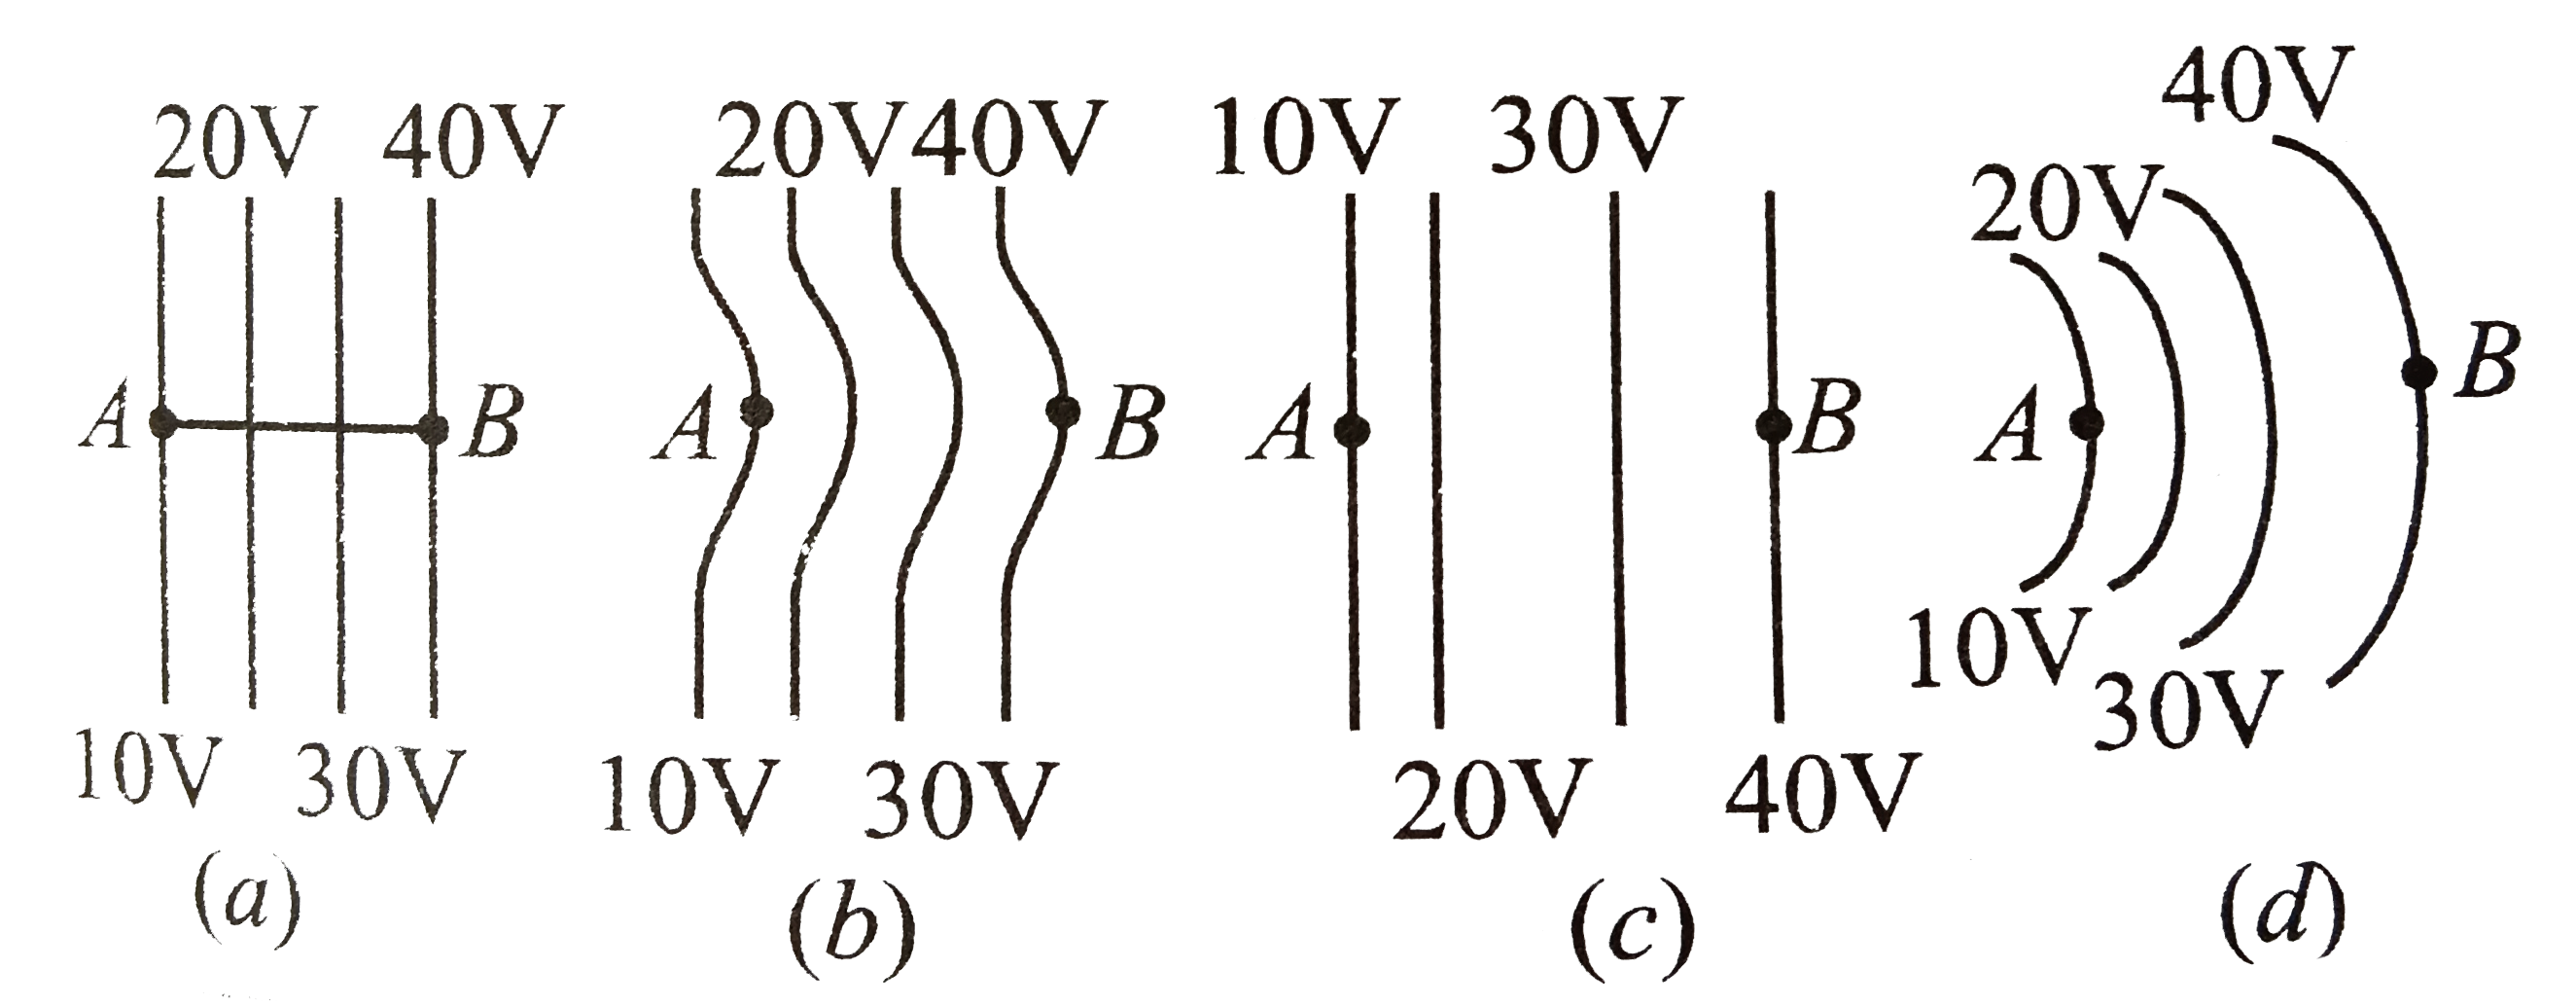 AMaximum work is required to move q in figurec (c ).BIn all the four cases, the work doen is the same.CMinimum work is required to move q in figurec (a).DMaximum work is required to move q in figurec (b ).
 - Question 2 - Select One
The differential equation of the curve y =sin is
Ad2ydx2+ydydx+x=0Bd2ydx2+y=0Cd2ydx2−y=0Dd2ydx2+x=0 - Question 3 - Select One
The diagram shows stress v/s strain curve for the materials A and B. From the curves we infer that
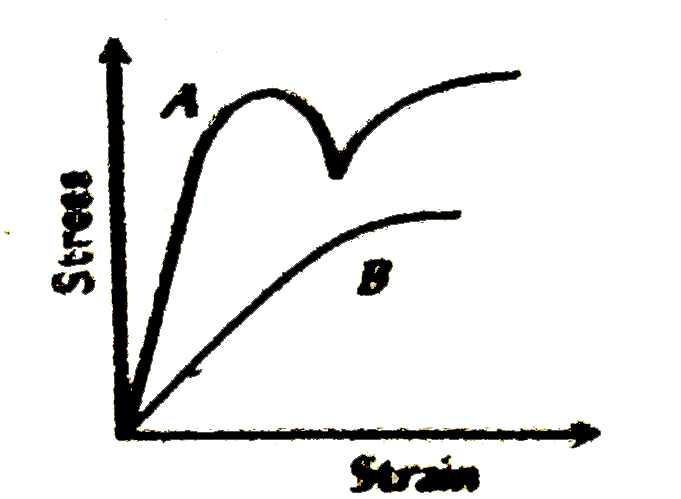 AA is brittle but B is ductileBA is ductile and B is brittleCBoth A and B are ductileDBoth A and B are brittle
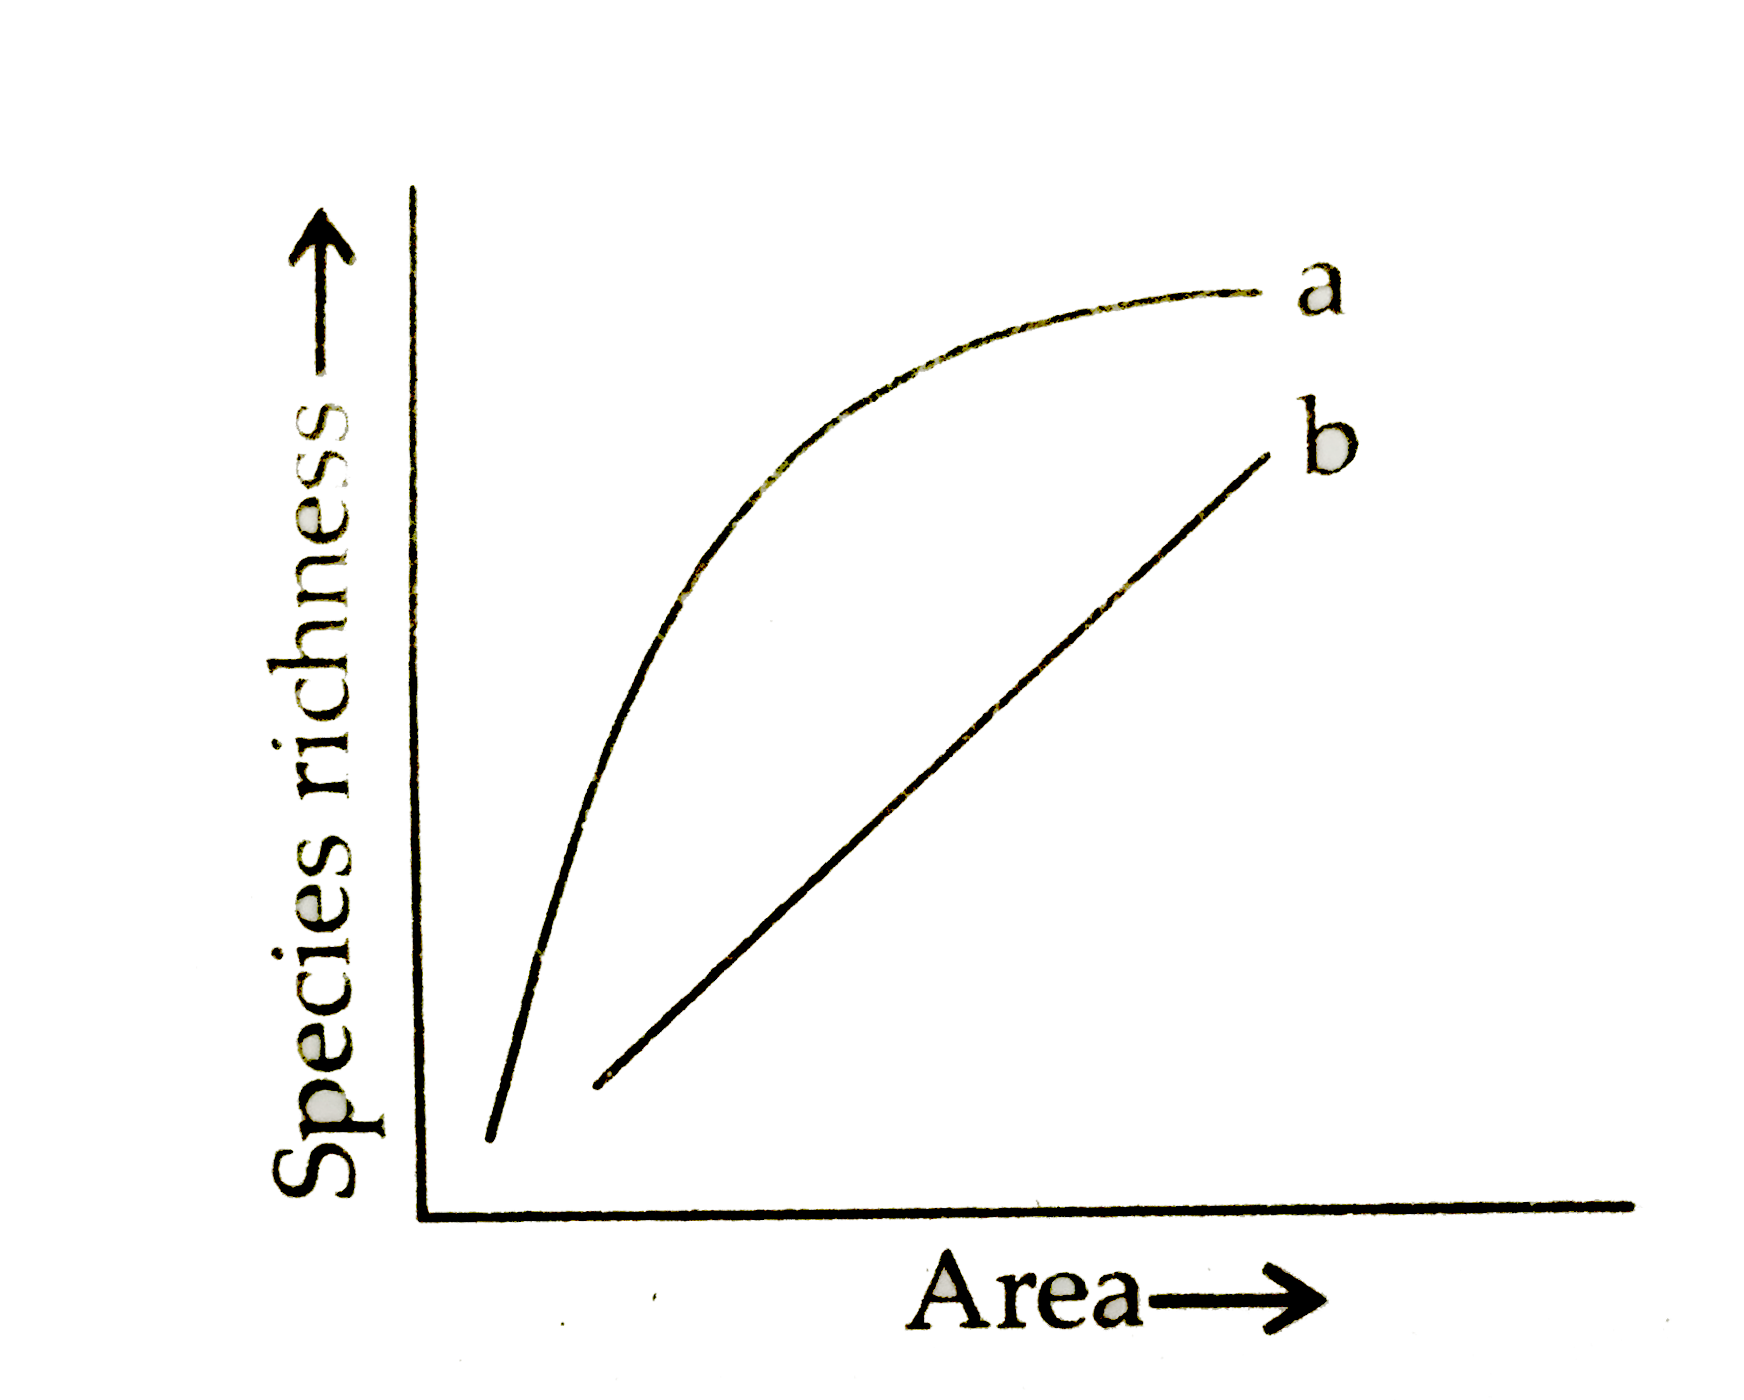
The given graph shows species-area relationship. Write the equation of the curve 'a' and explain.
 View Solution
The slope of the tangent to the curve at a point (x,y) on it is proportional to (x−2).if the slope of tangent to the curve at (10,−9) on it is −3 then the equation of the curve is :
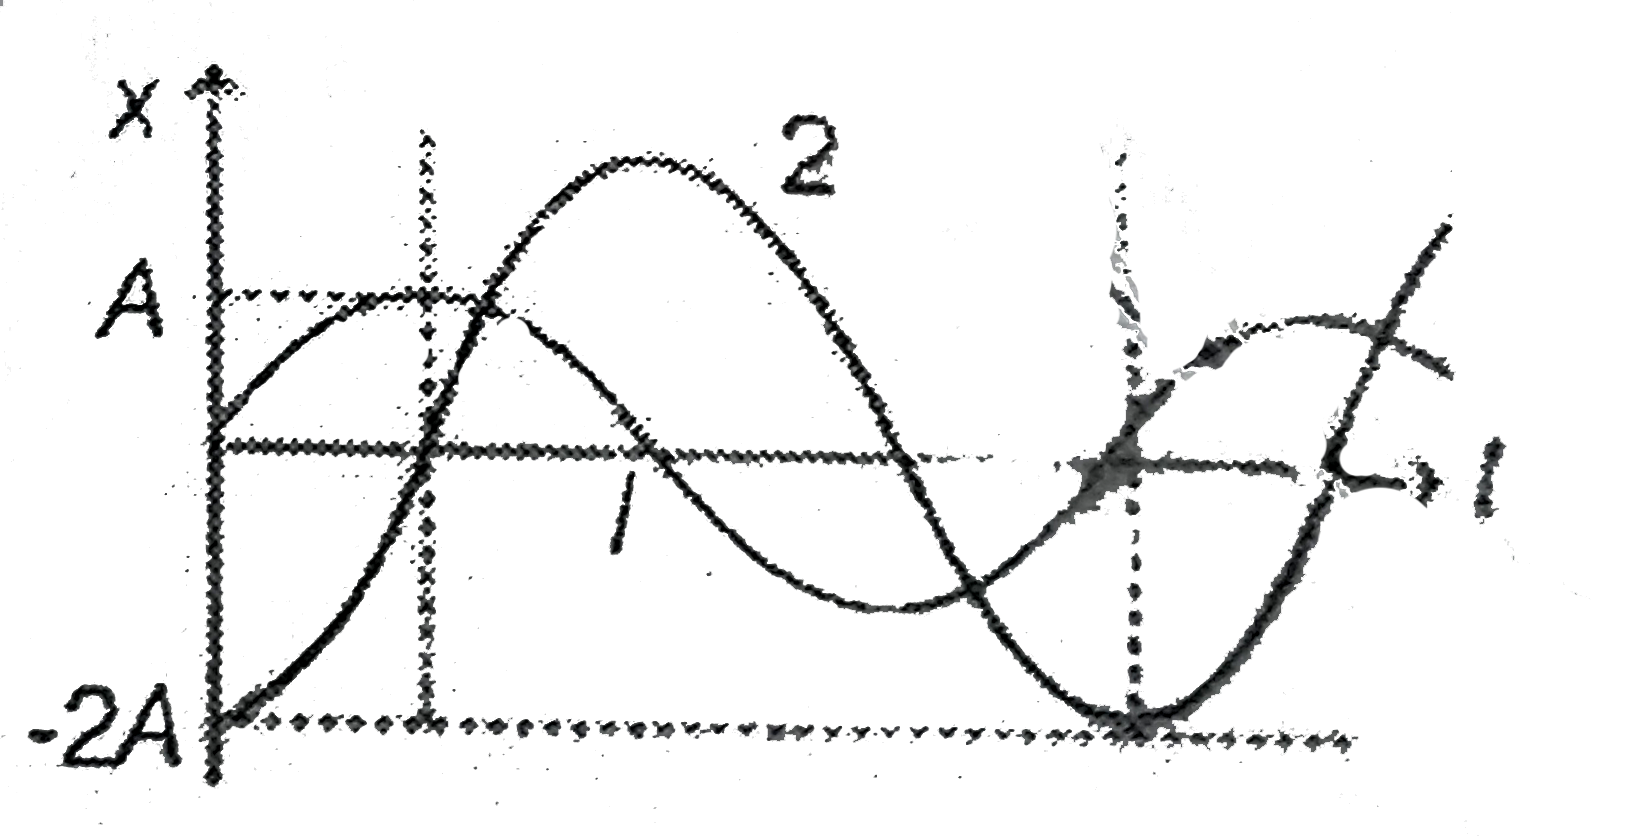
View SolutionThe osciallations represented by curve 1 in the graph are expressed by equation x=Asinεt. The equation for the oscillations represented by curve 2 is expressed as
 View Solution
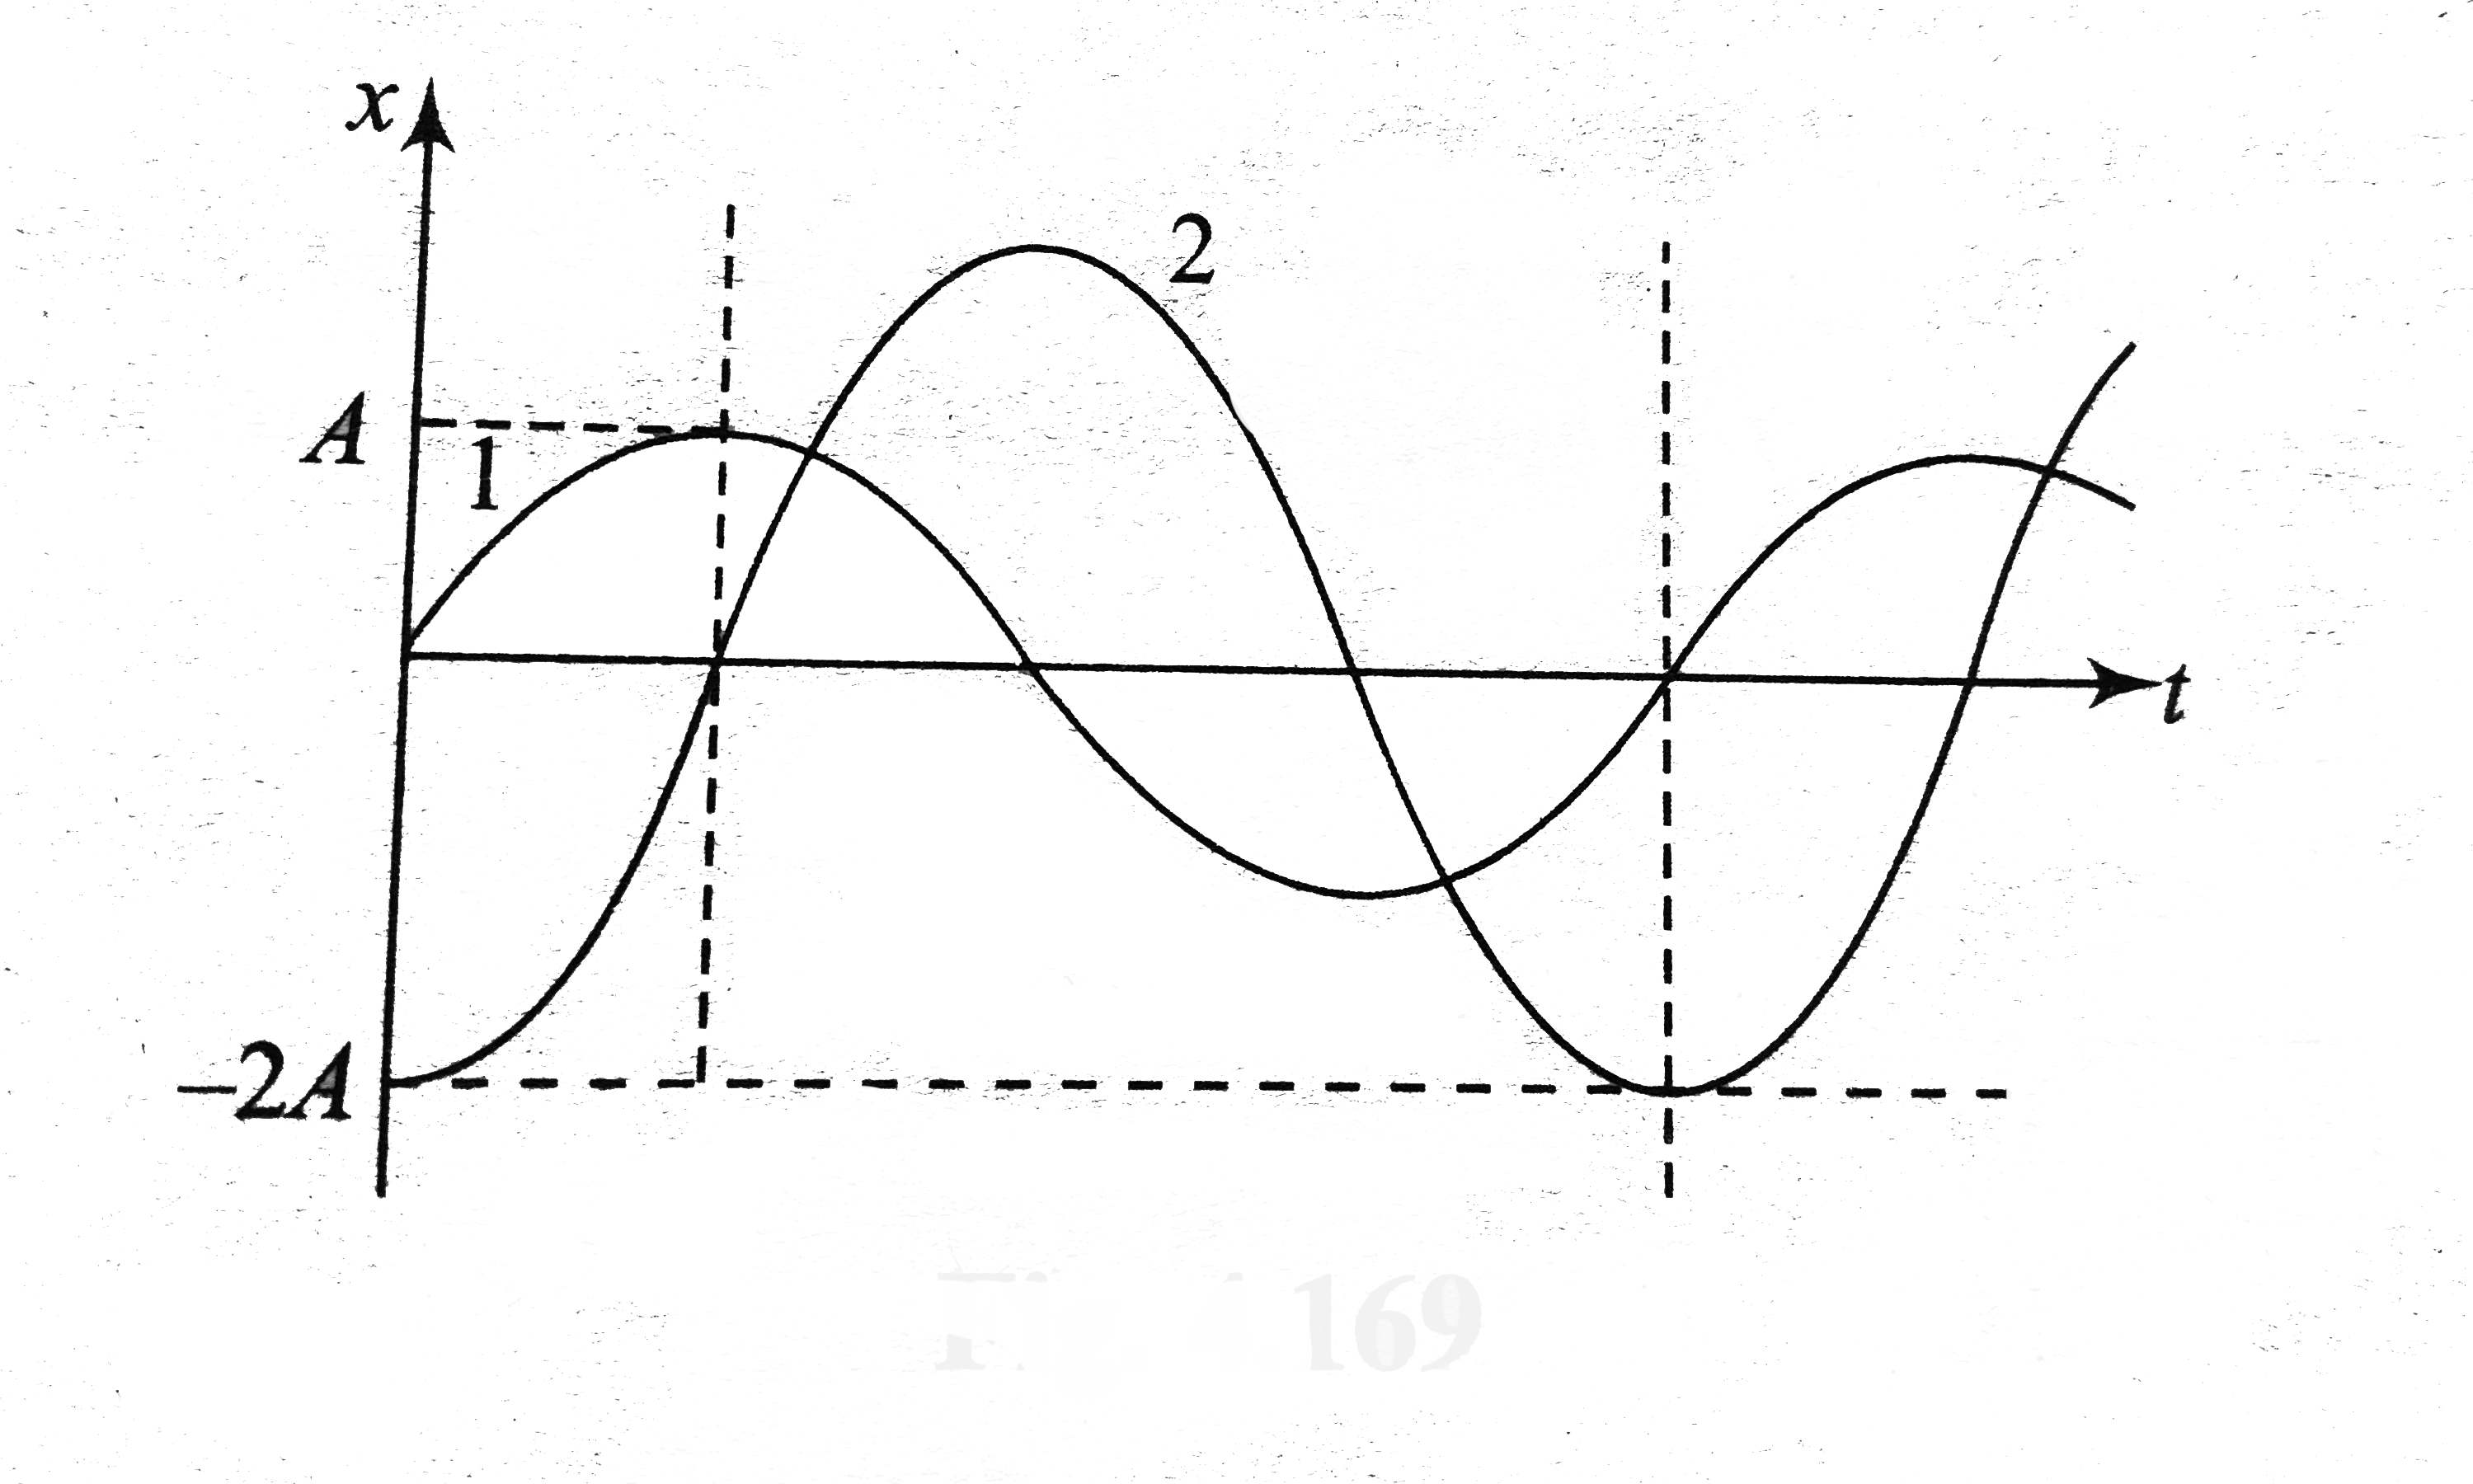
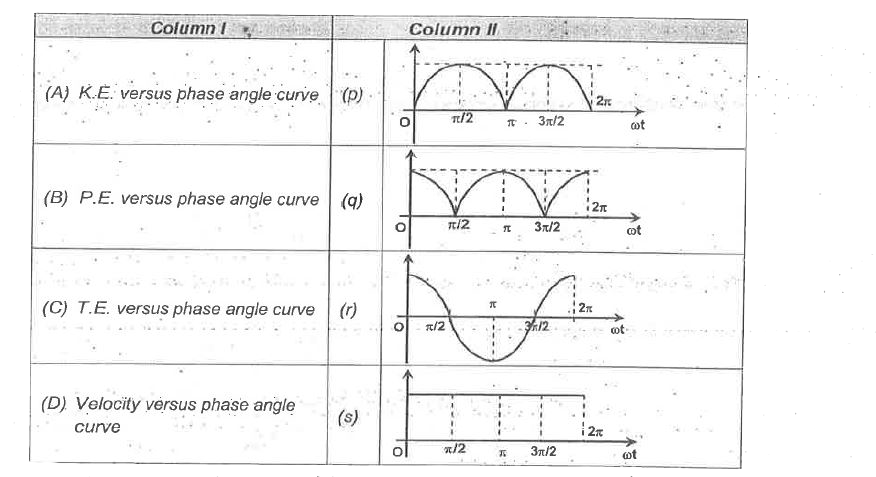
The oscillations represented by curve 1 in the graph are expressed by equationx=Asinωt. The equation for the oscillation represented by curve 2 is expressed asView SolutionThe graph plotted between phase angle (ωt) and displacement of a particle from equilibrium position (y) is a sinusoidal curve as shown below. Then the best matching is
 View Solution


