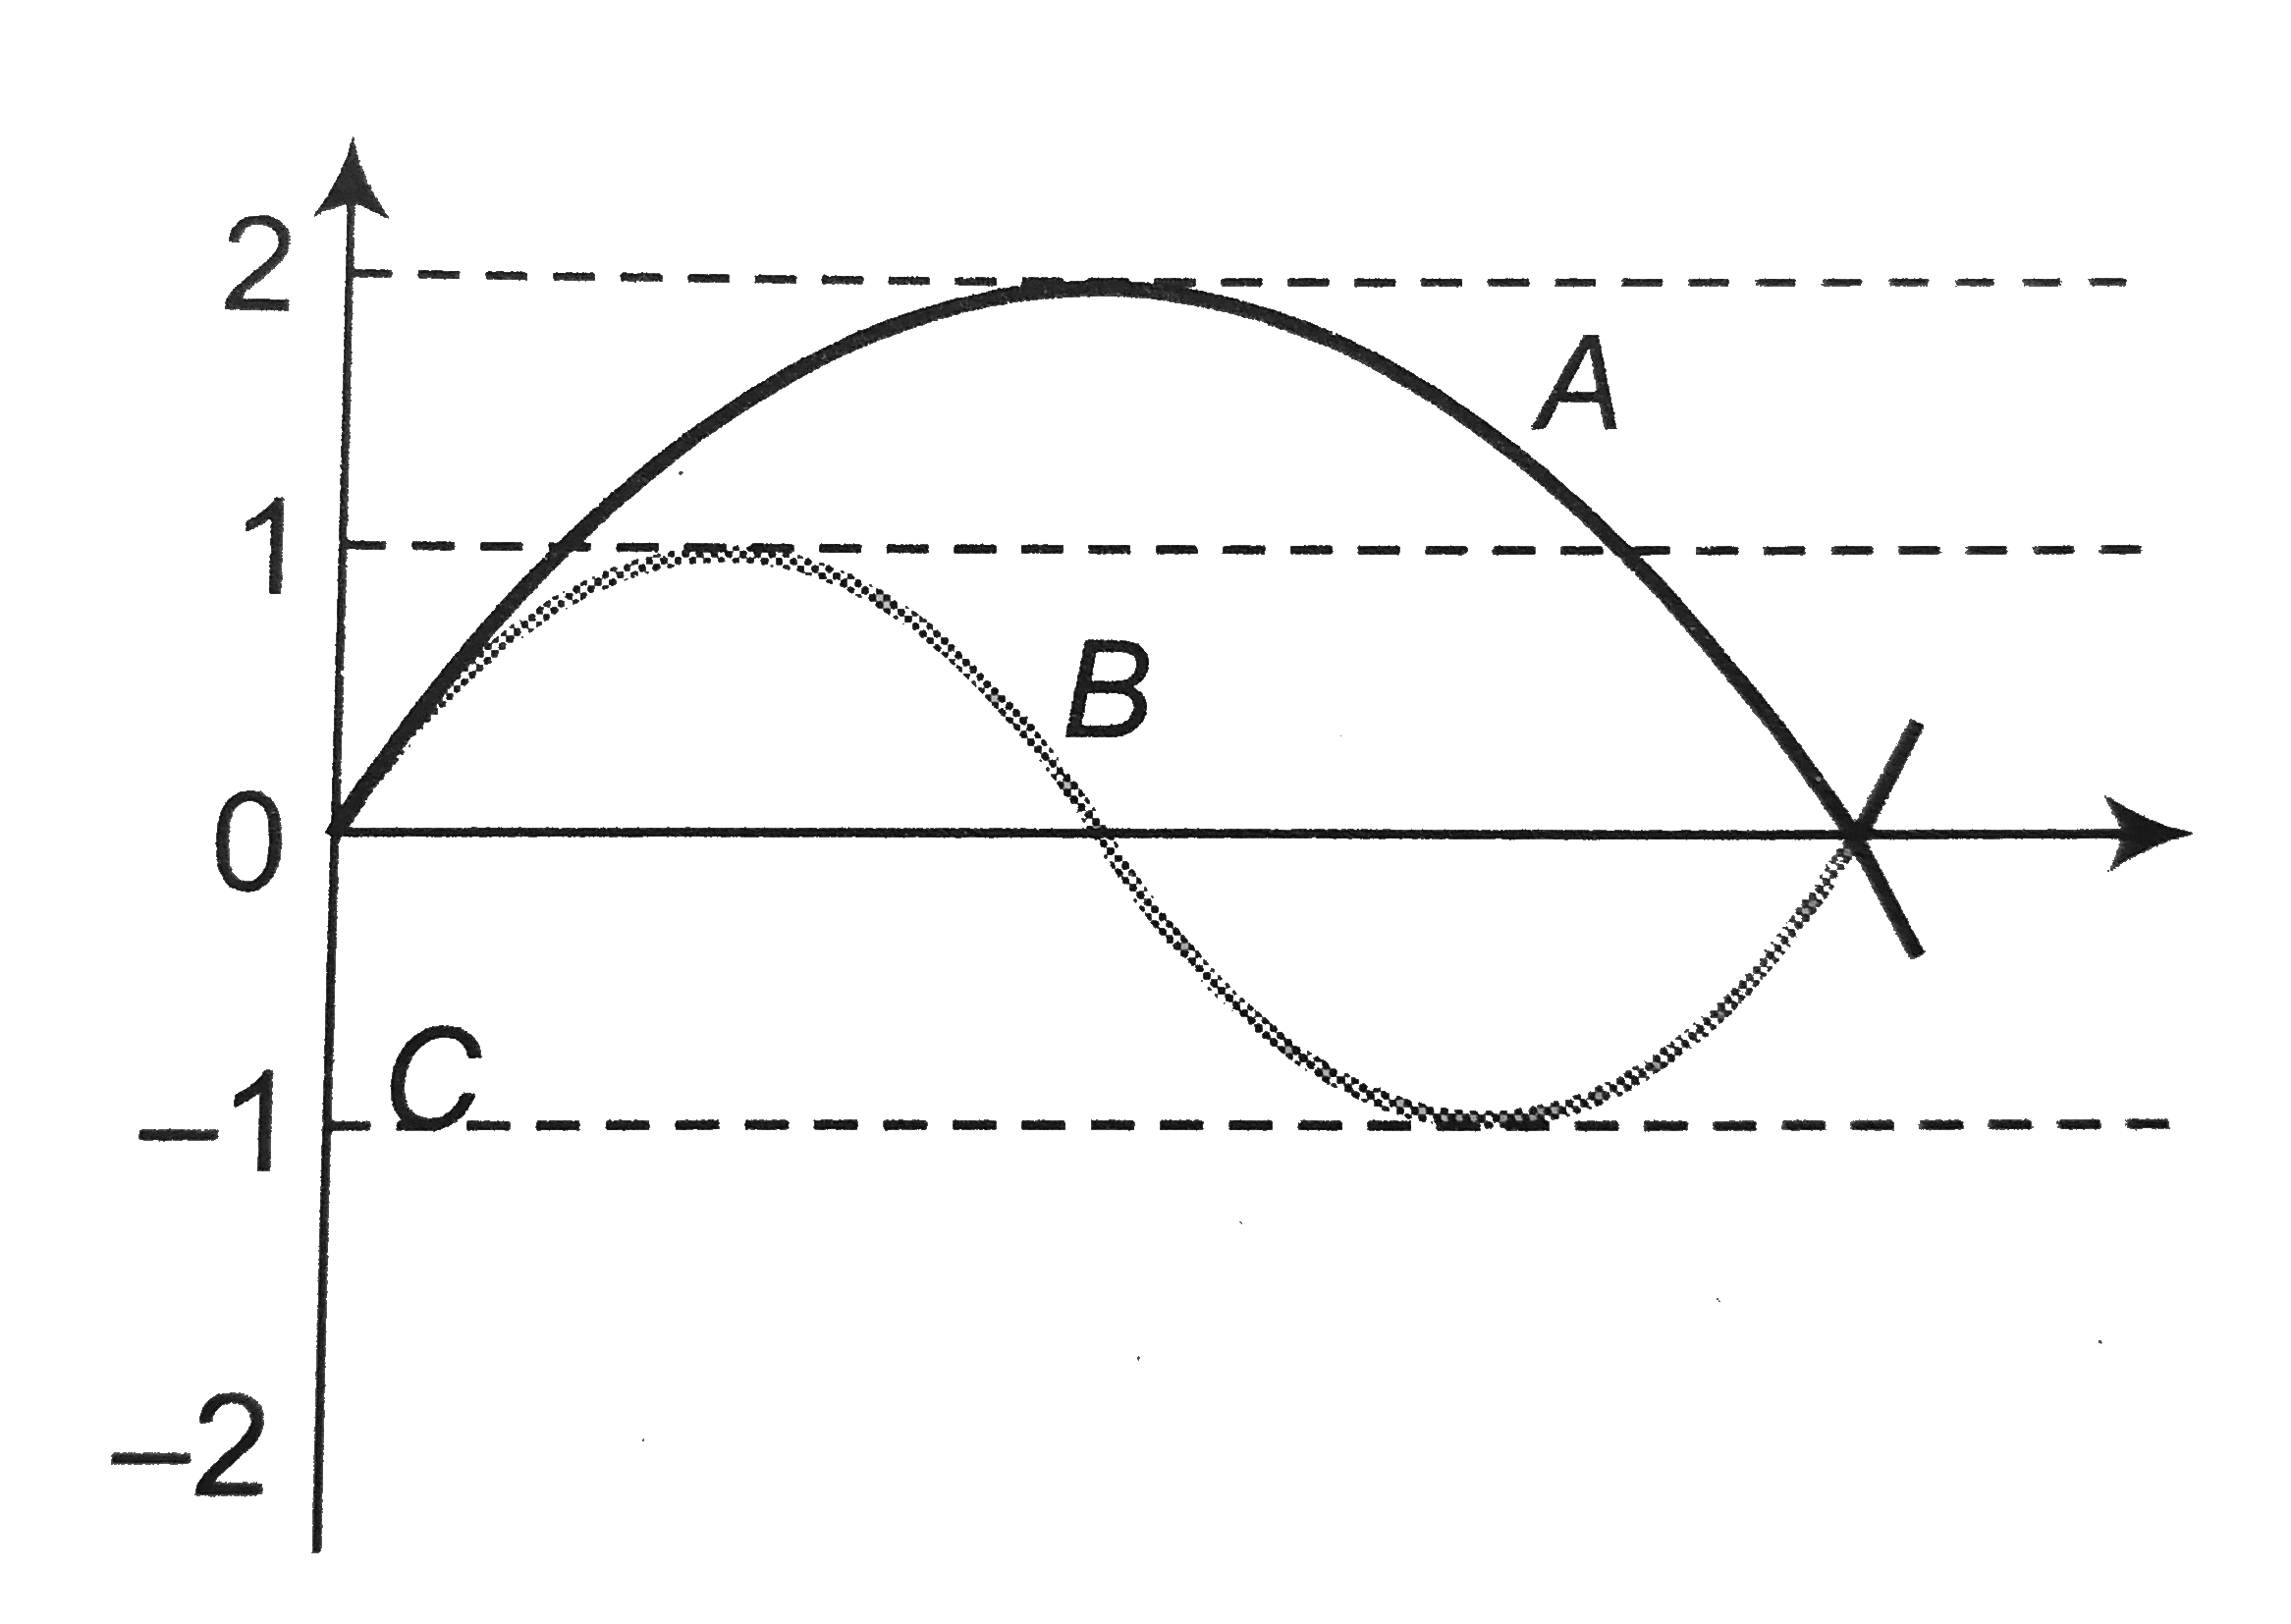
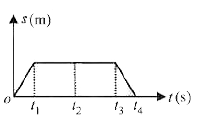
The displacement time graph for two sound waves A and B are shown in the figure. Then the ratio of their intensities IA/IB is equal to
1:4
1:16
1:2
1:1
The correct Answer is:D
Step by step video & image solution for The displacement time graph for two sound waves A and B are shown in the figure. Then the ratio of their intensities I_(A)//I_(B) is equal to by Physics experts to help you in doubts & scoring excellent marks in Class 12 exams.
Updated on:21/07/2023Topper's Solved these Questions
Similar Questions
Knowledge Check
The displacement-time graphs for two sound waves A and 5 are shown in the figure-6.98, then the ratio oftheir intensities IA/IB is equal to:
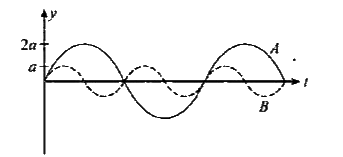 A1:4B1:16C1:2D1:1
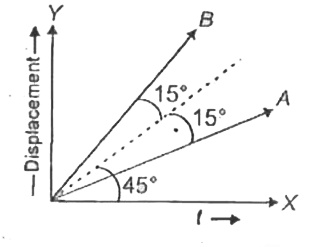
The displacement time graphs of two bodies A and B are shown in figure. The ratio of velocity of A to velocity of B,vA/vB is:
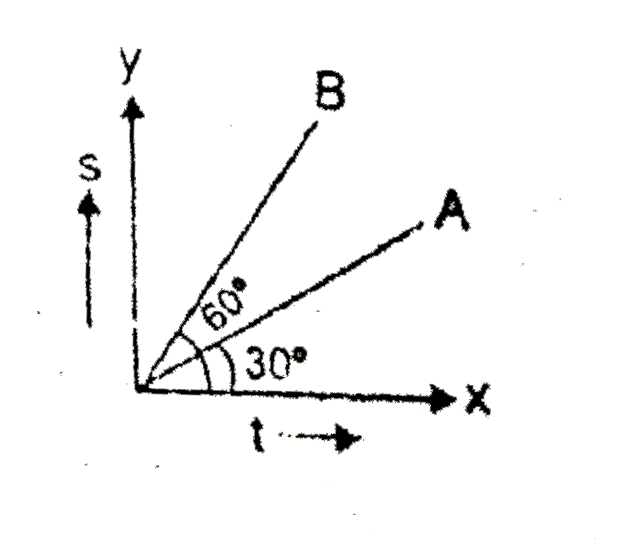 A1√3B√3C13D3
The velocity - time graph for two bodies A and B are shown in figure. Then, the acceleration of A and B are in the ratio
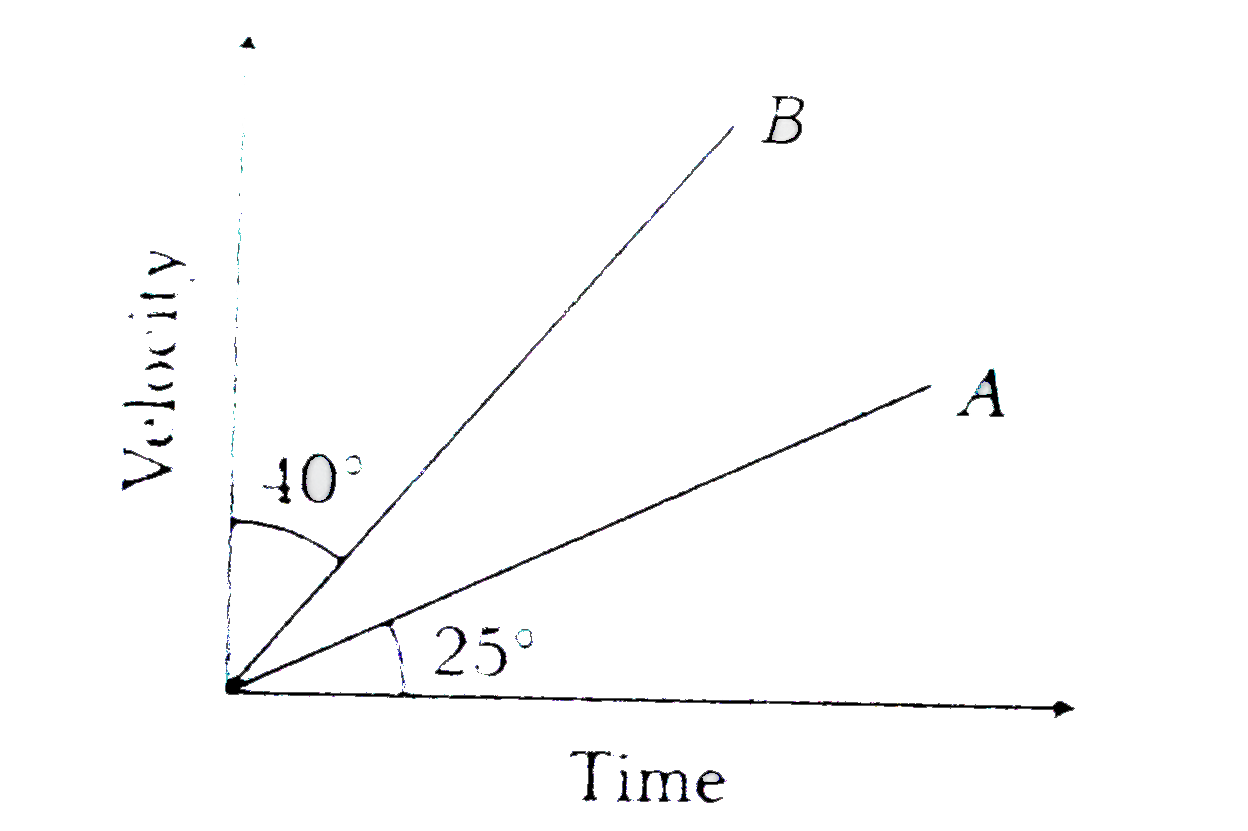 Asin25∘ to sin50∘Btan25∘ to tan40∘Ccos25∘ to cos50∘Dtan25∘ to tan50∘
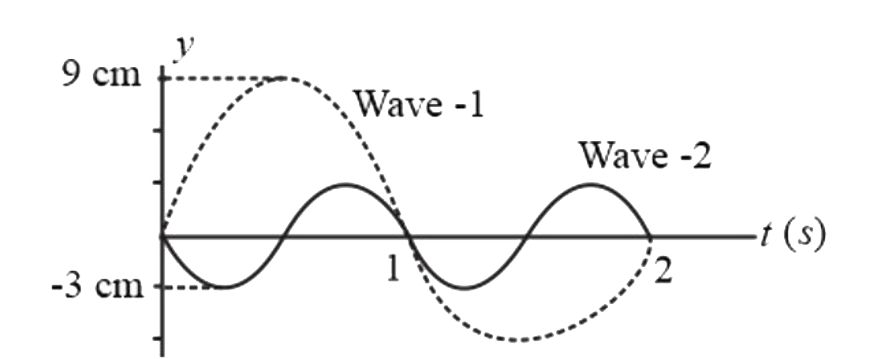
Displacement - time graphs for two waves, wave - 1 and wave - 2 are shown here. The ratio of the intensity of wave-1 to that of wave - 2 is
View SolutionDepedence is disturbances due to two waves on time is shown in the figure, The ratio of their intensities I1/I2 be :-
_E01_012_Q01.png) .
.
View SolutionThe displacement vs time graph for two waves A and B which travel along the same string arre shown in the figure. Their intensity ratio IA∣IB is
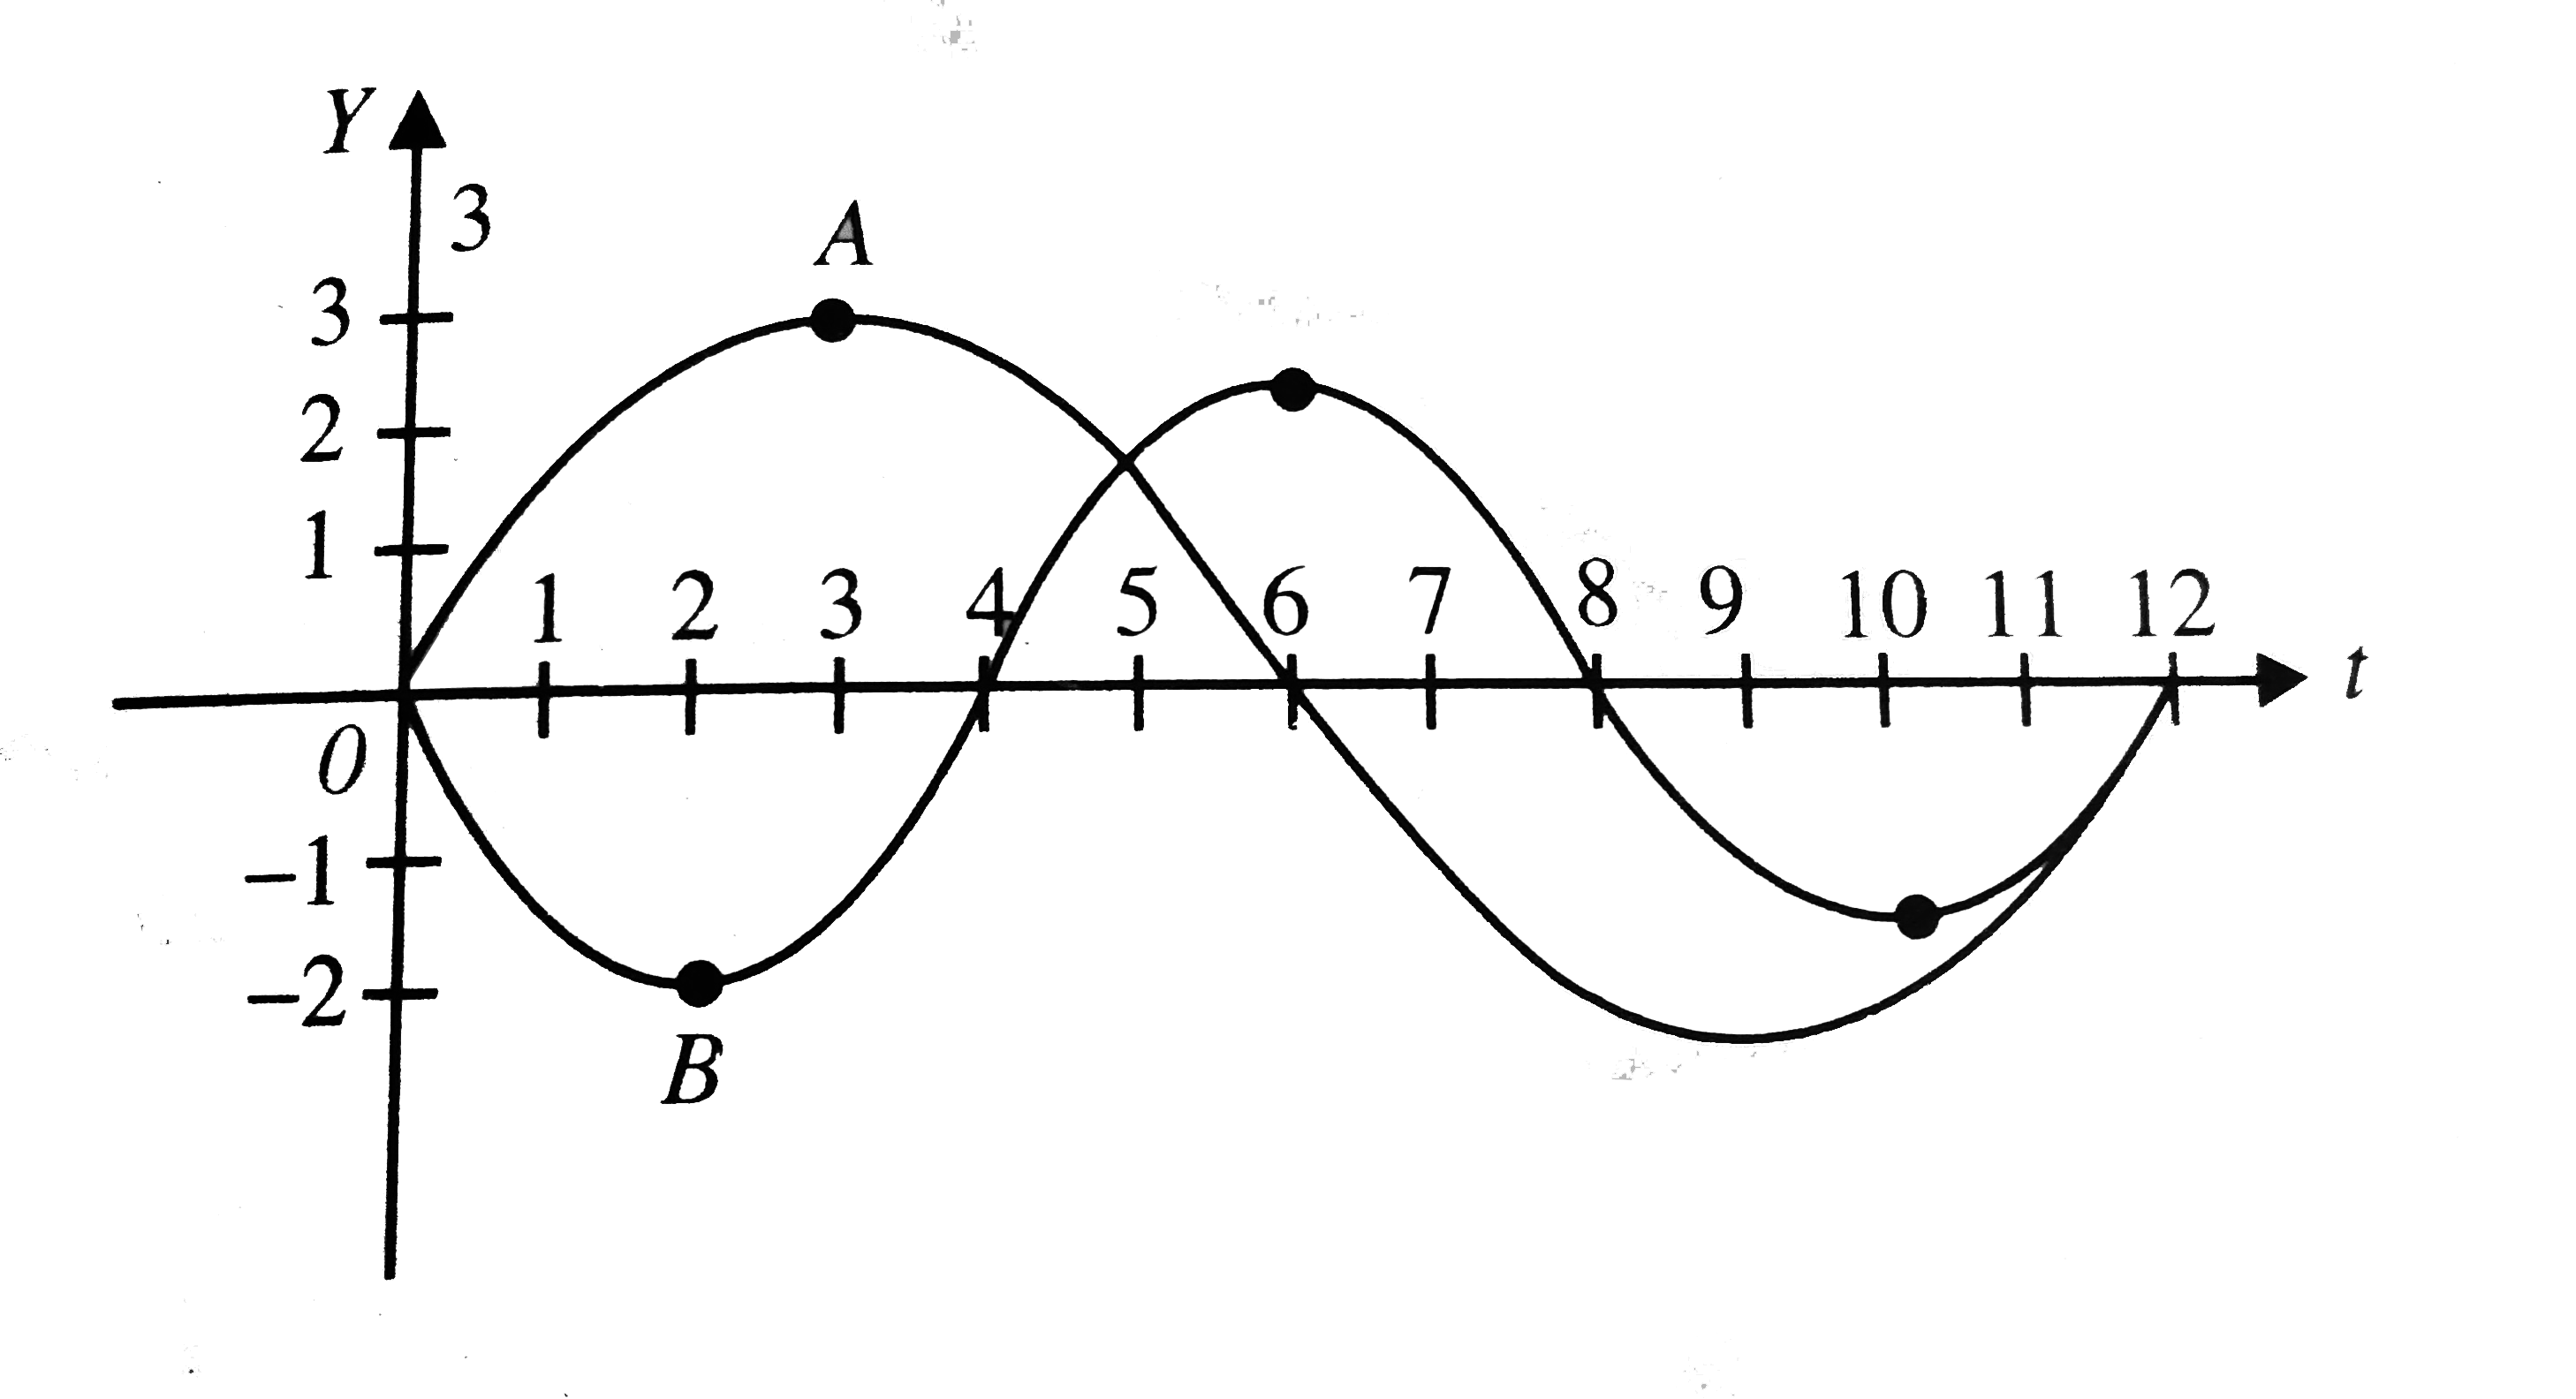
View SolutionThe displacement - time graph for two particles A and B is as follows. The ratio vAvB is
View SolutionThe displacement time graph of a body is shown in figure. The velocity-time graph of the motion of the body will be
View Solution

