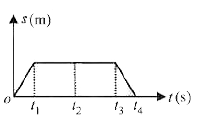
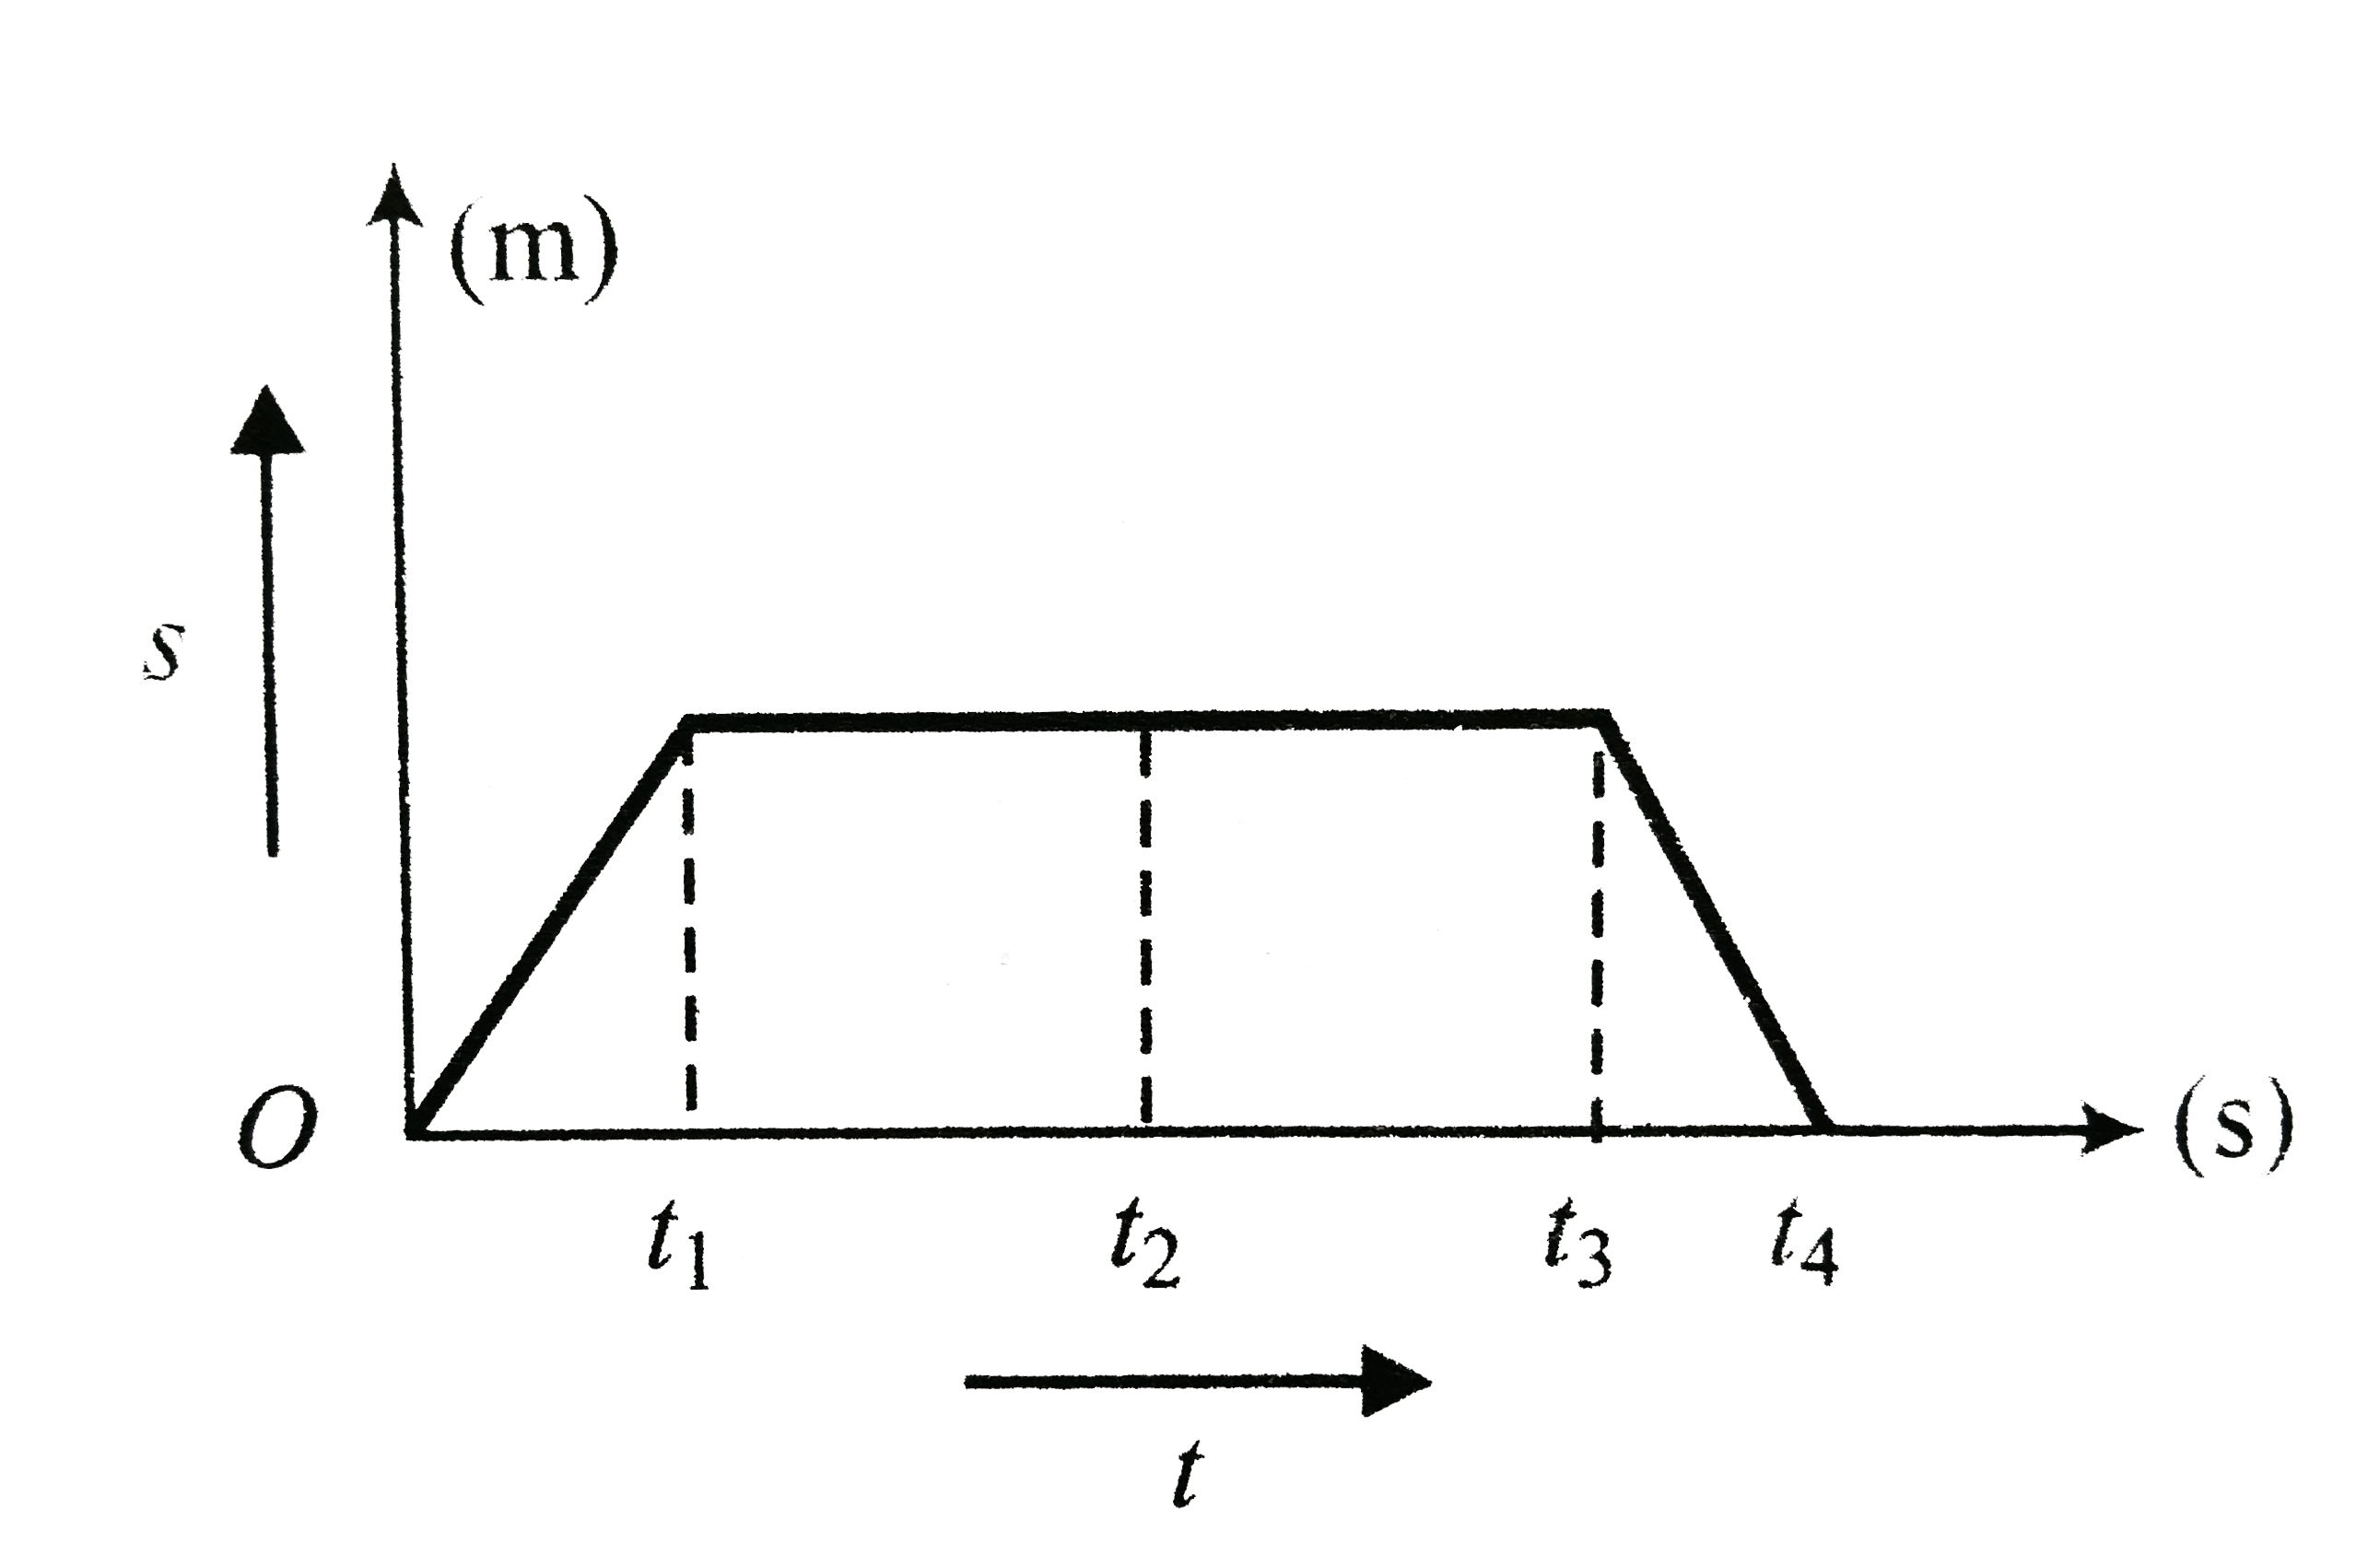
The displacement time graph of a body is shown in figure. The velocity-time graph of the motion of the body will be
A
B
C
D
Text Solution
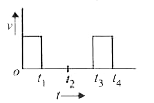
The correct Answer is:D
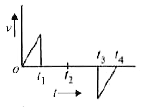
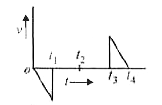
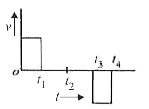
From 0 t1 , velocity is positive and constant as indicated by positive and constant slope. From t1, to t3, slope is zero, hence velocity 1s zero. From t3 to t4 , velocity is negative and constant as indicated by negative and constant slope. Option (d) satisfies all these observations.
|
Topper's Solved these Questions
- KINEMATICS BOOK - MTG-WBJEECHAPTER - KINEMATICS EXERCISE - WB JEE WORKOUT ( CATEGORY 3 : One or More than One Option Correct Type (2 Marks))
10 Videos
- KINEMATICS BOOK - MTG-WBJEECHAPTER - KINEMATICS EXERCISE - WB JEE Previous Years Questions (CATEGORY 1 : Single Option Correct Type (1 Mark) )
9 Videos
- KINEMATICS BOOK - MTG-WBJEECHAPTER - KINEMATICS EXERCISE - WB JEE Previous Years Questions (CATEGORY 3 : One or More than One Option Correct Type (2 Marks) )
1 Videos
- HEAT AND THERMAL PHYSICSBOOK - MTG-WBJEECHAPTER - HEAT AND THERMAL PHYSICSEXERCISE - WB JEE PREVIOUS YEARS QUESTIONS
15 Videos
- KINETIC THEORY OF GASES BOOK - MTG-WBJEECHAPTER - KINETIC THEORY OF GASES EXERCISE - WB JEE PREVIOUS YEARS QUESTIONS (MCQ)
7 Videos
Similar Questions
Knowledge Check
The displacement-time graph of a body is shown in.
 .
.
The velocity-time graph of the motion of the body will be .A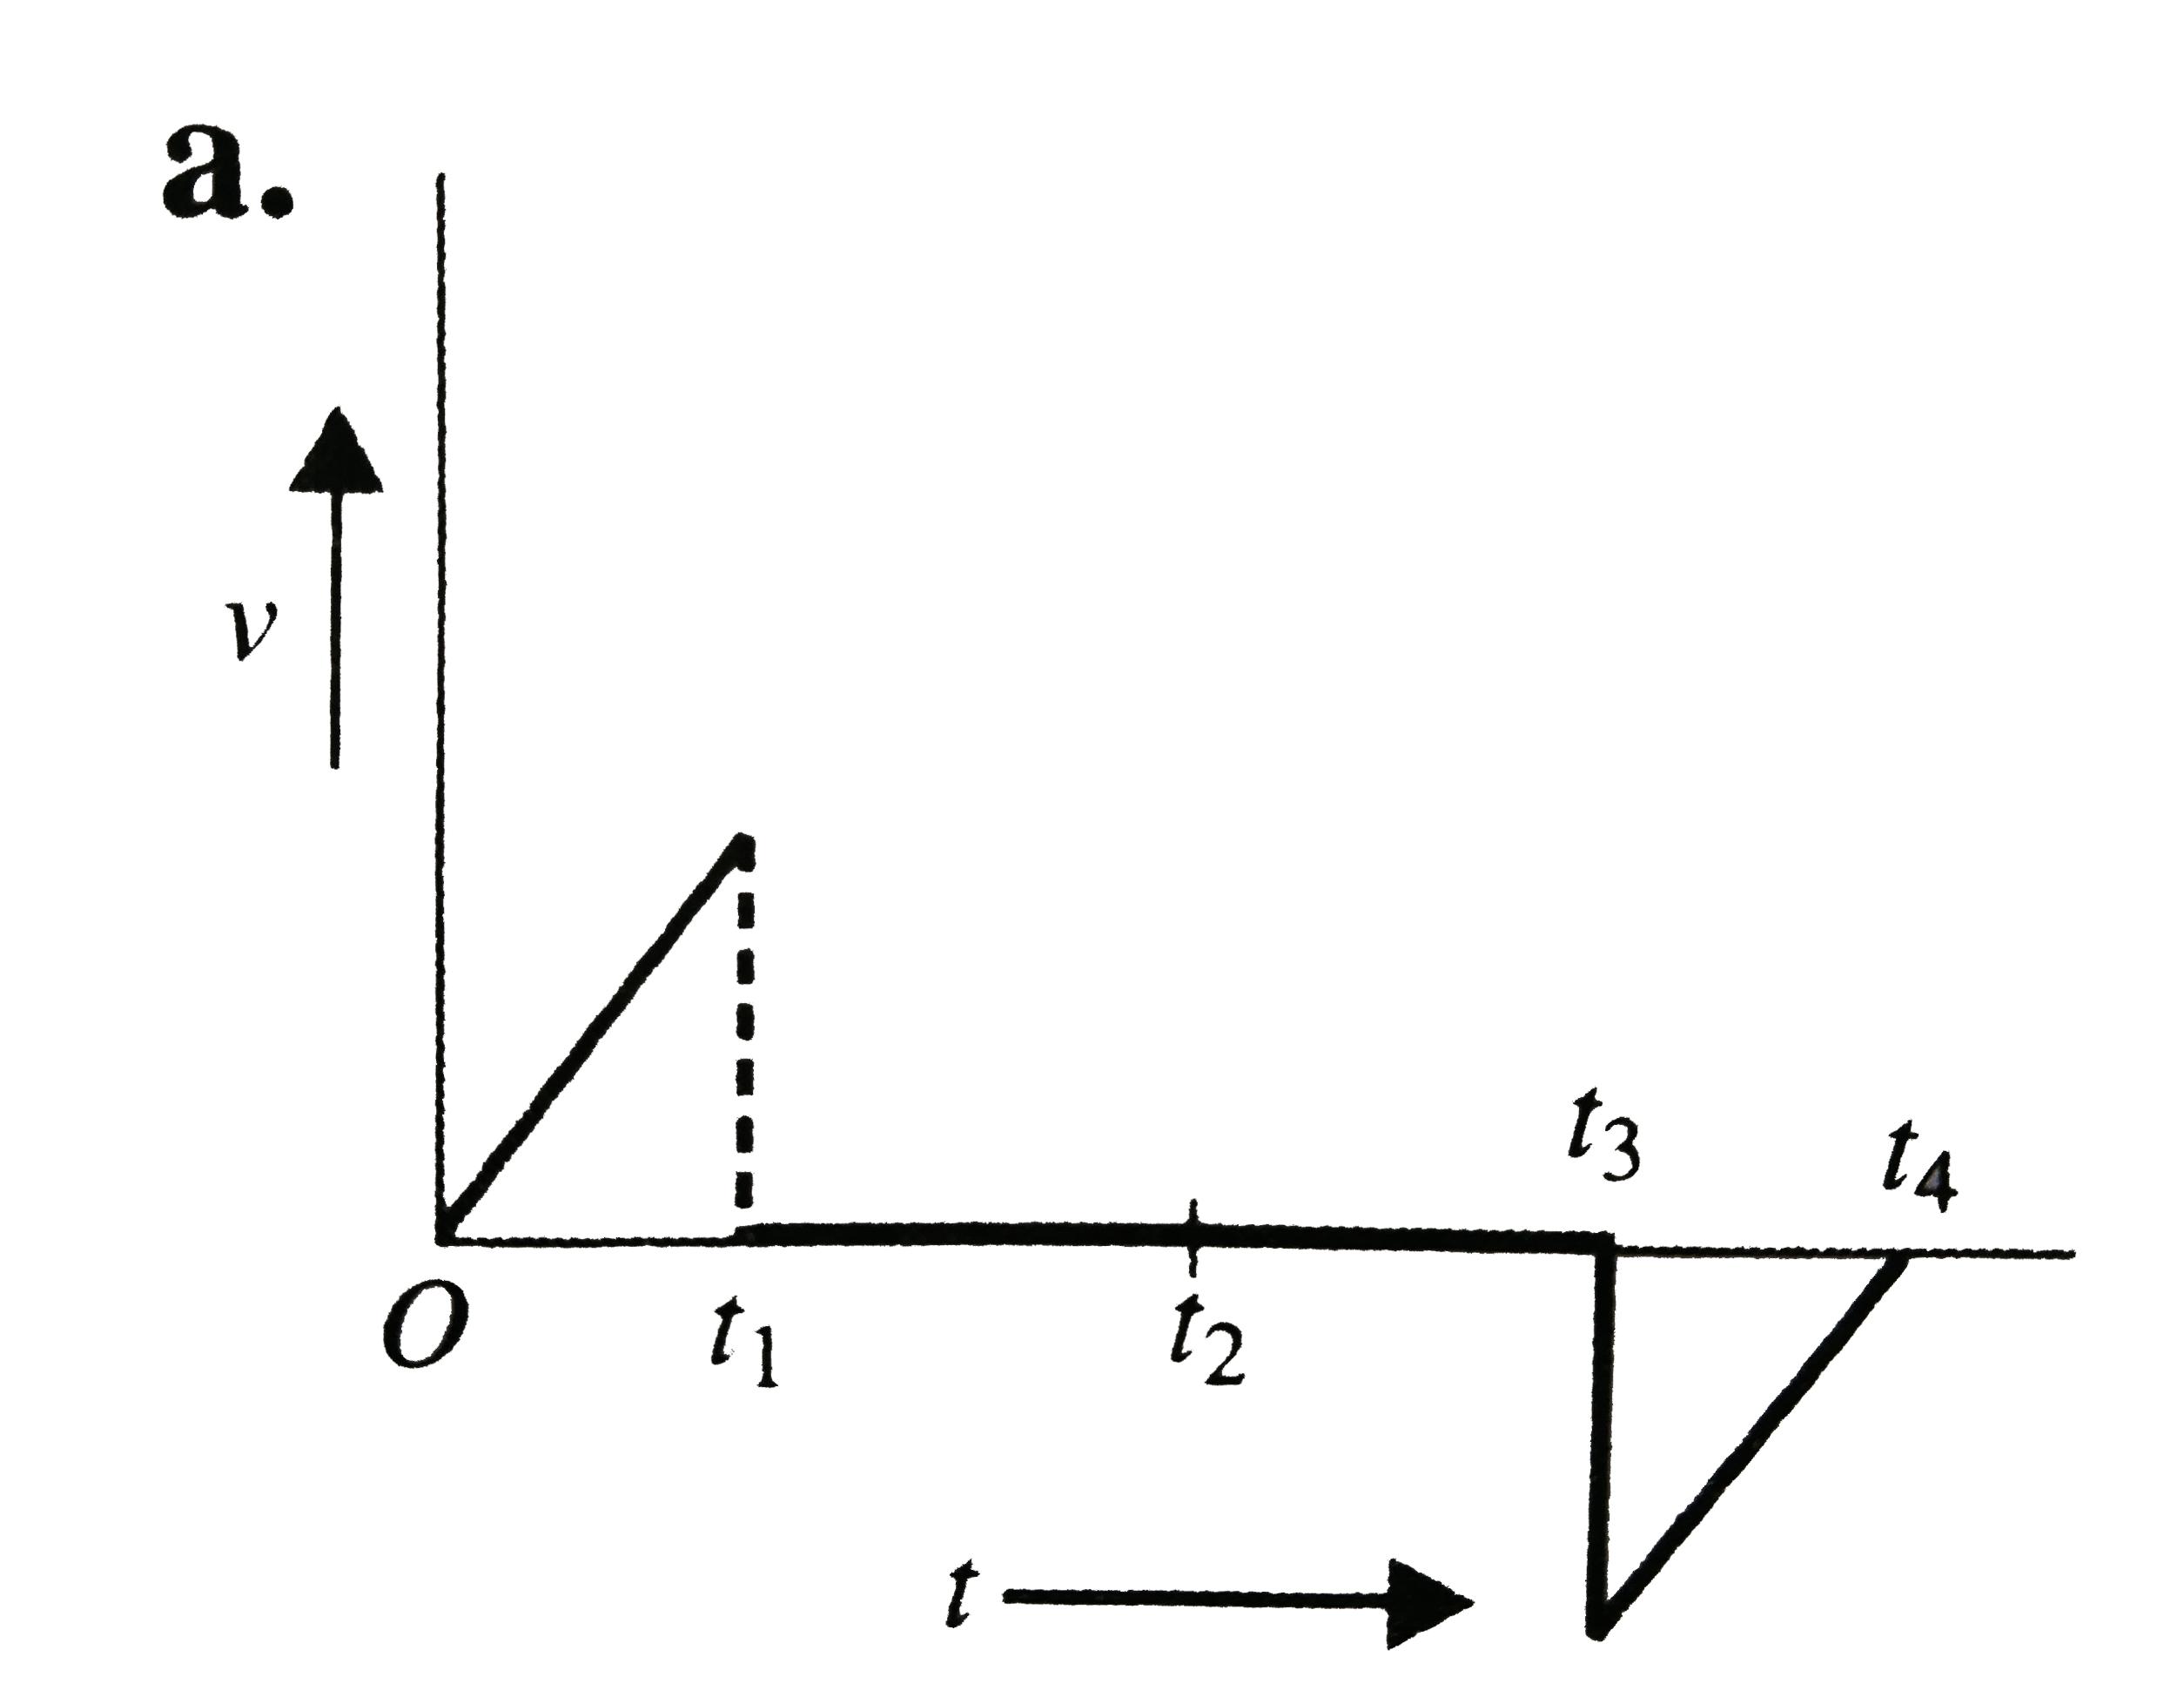 .B
.B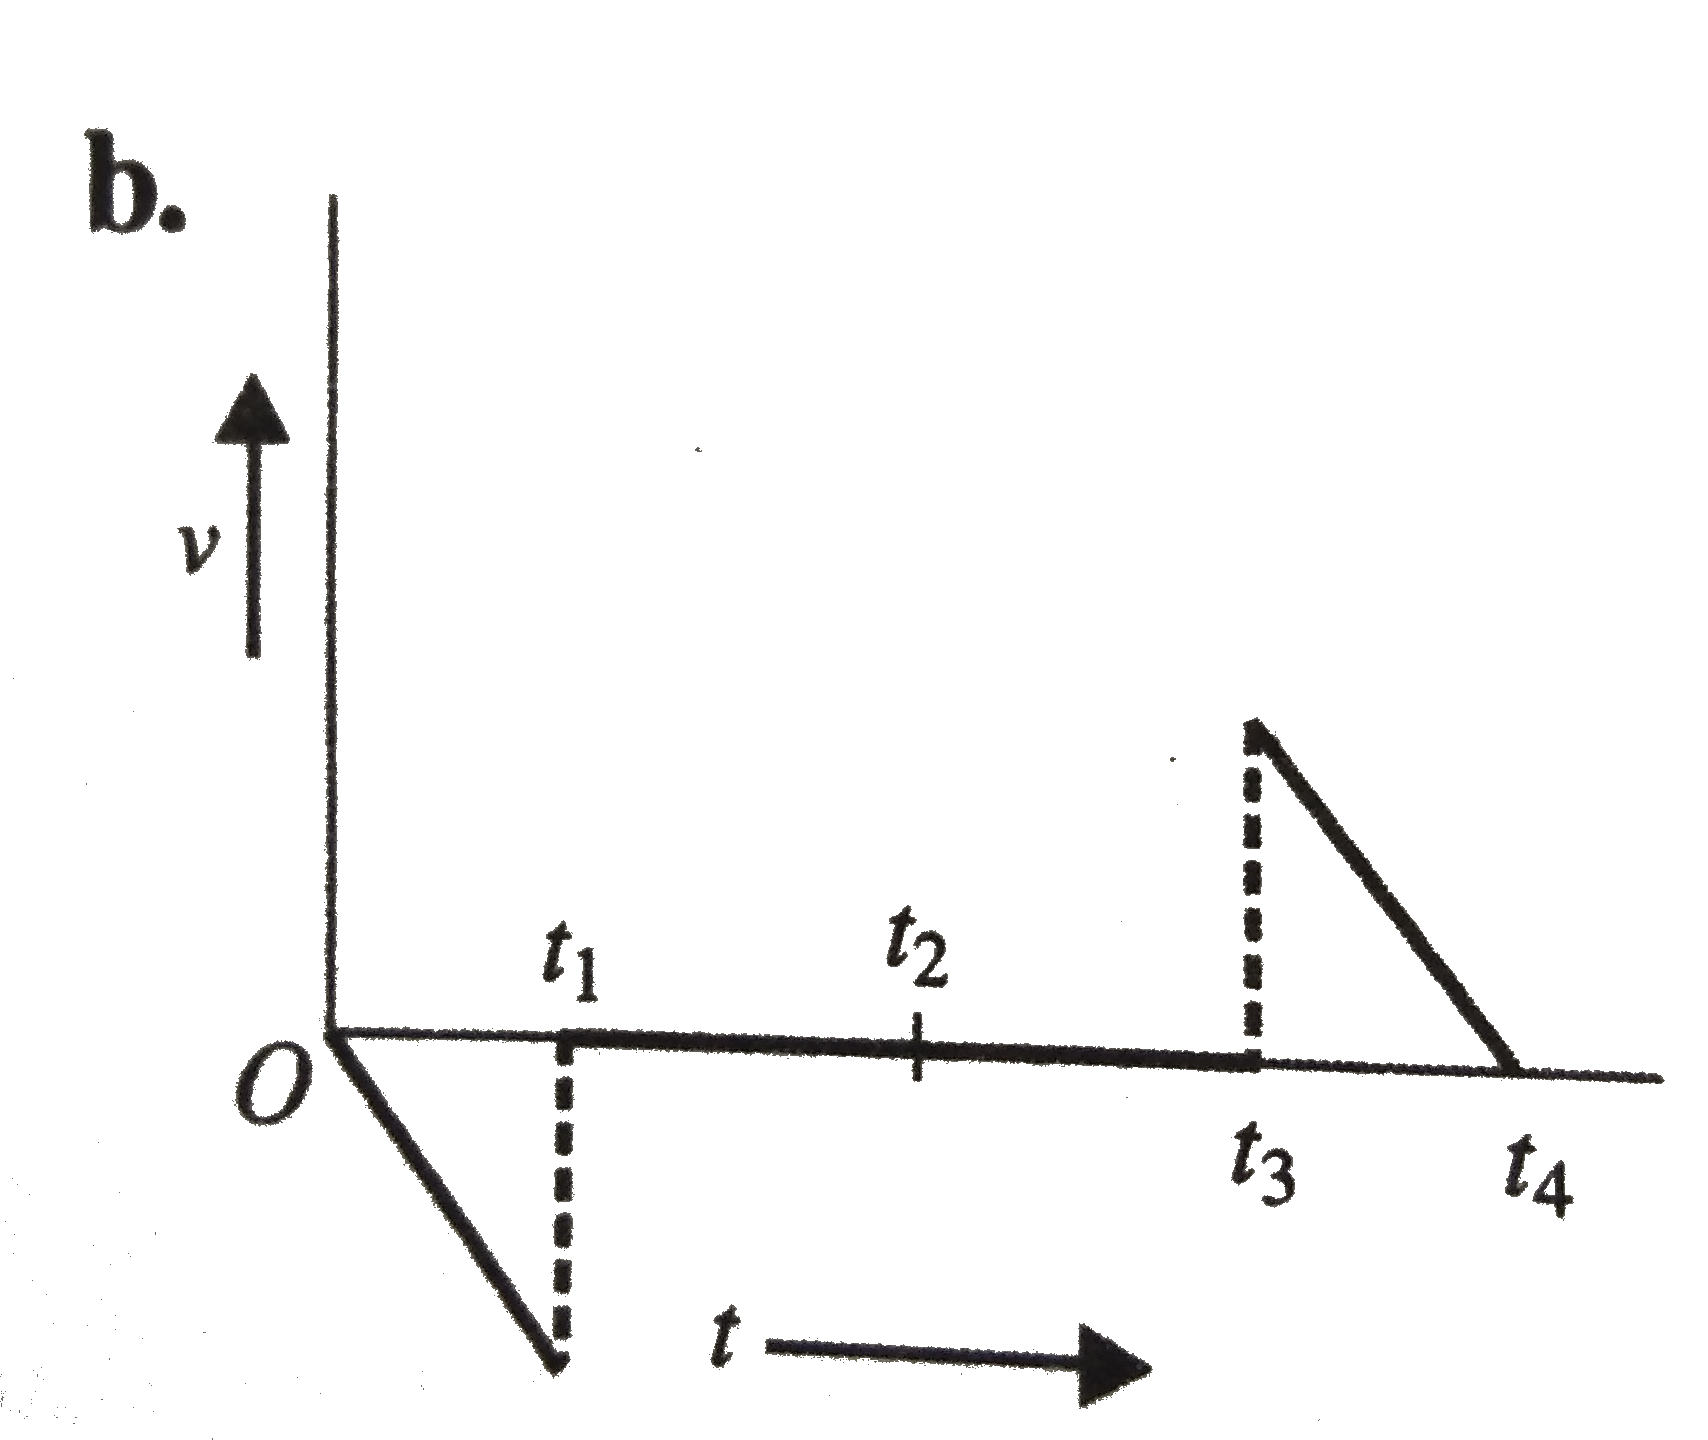 .C
.C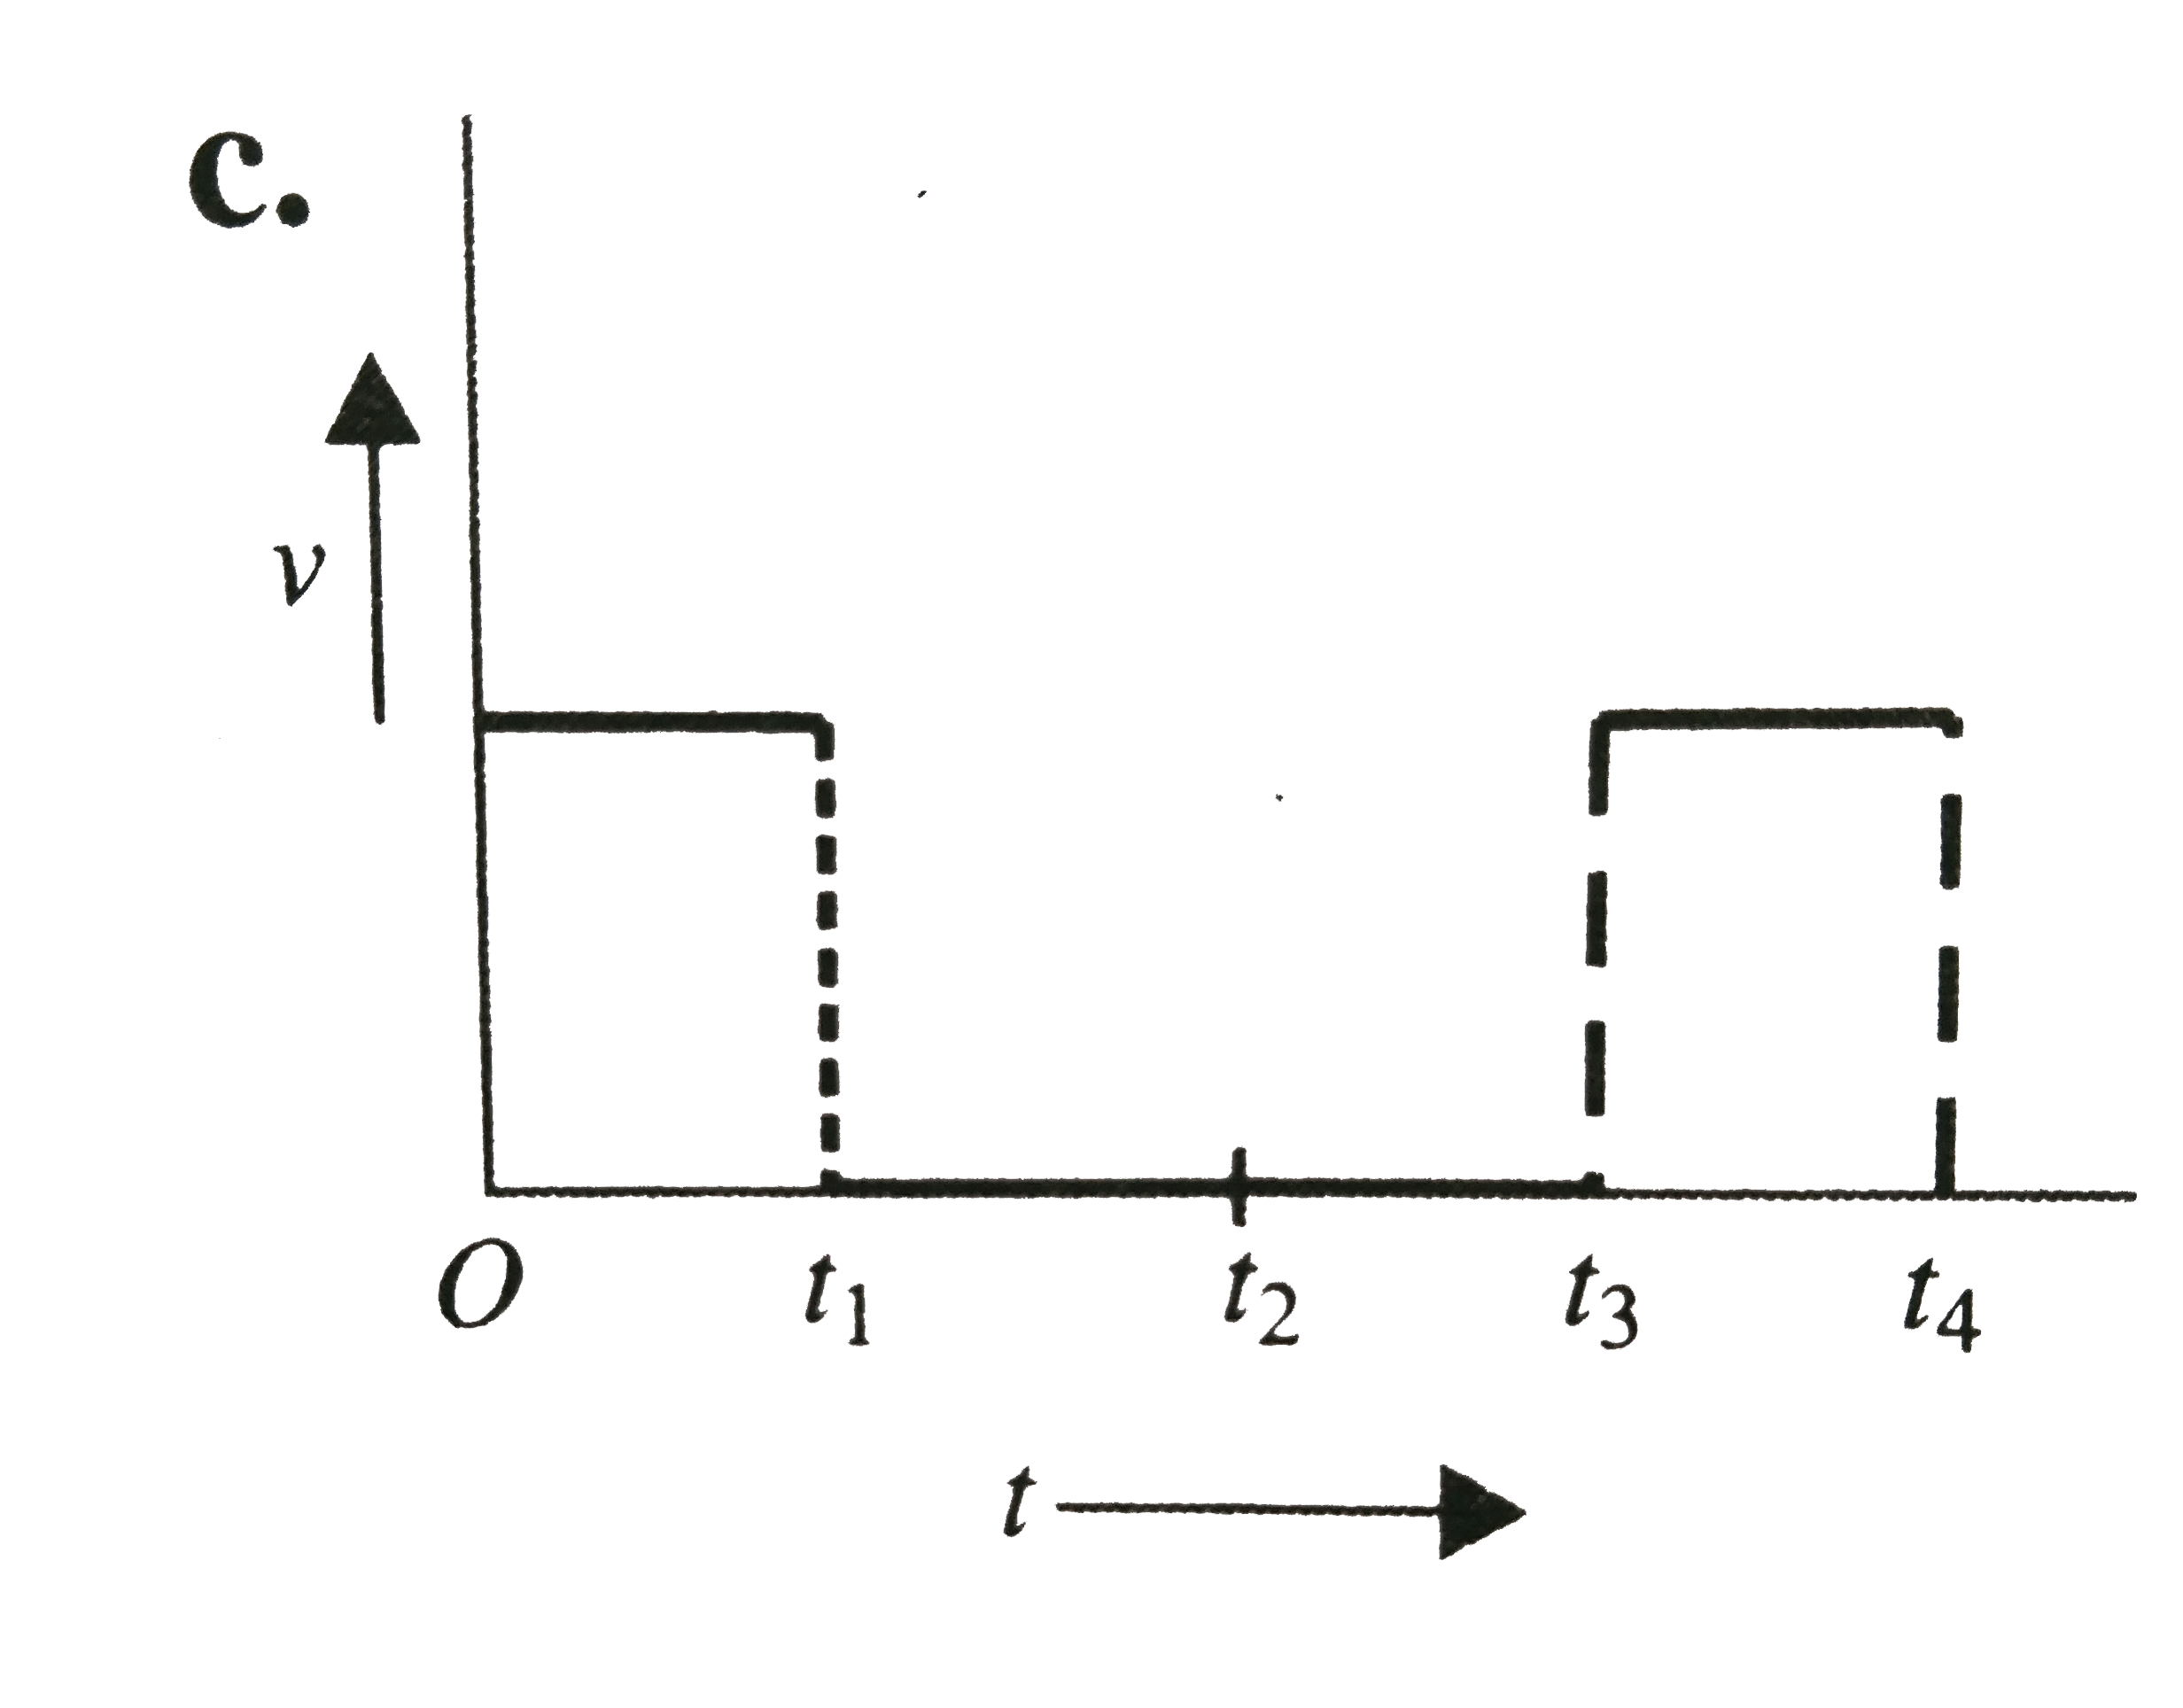 .D
.D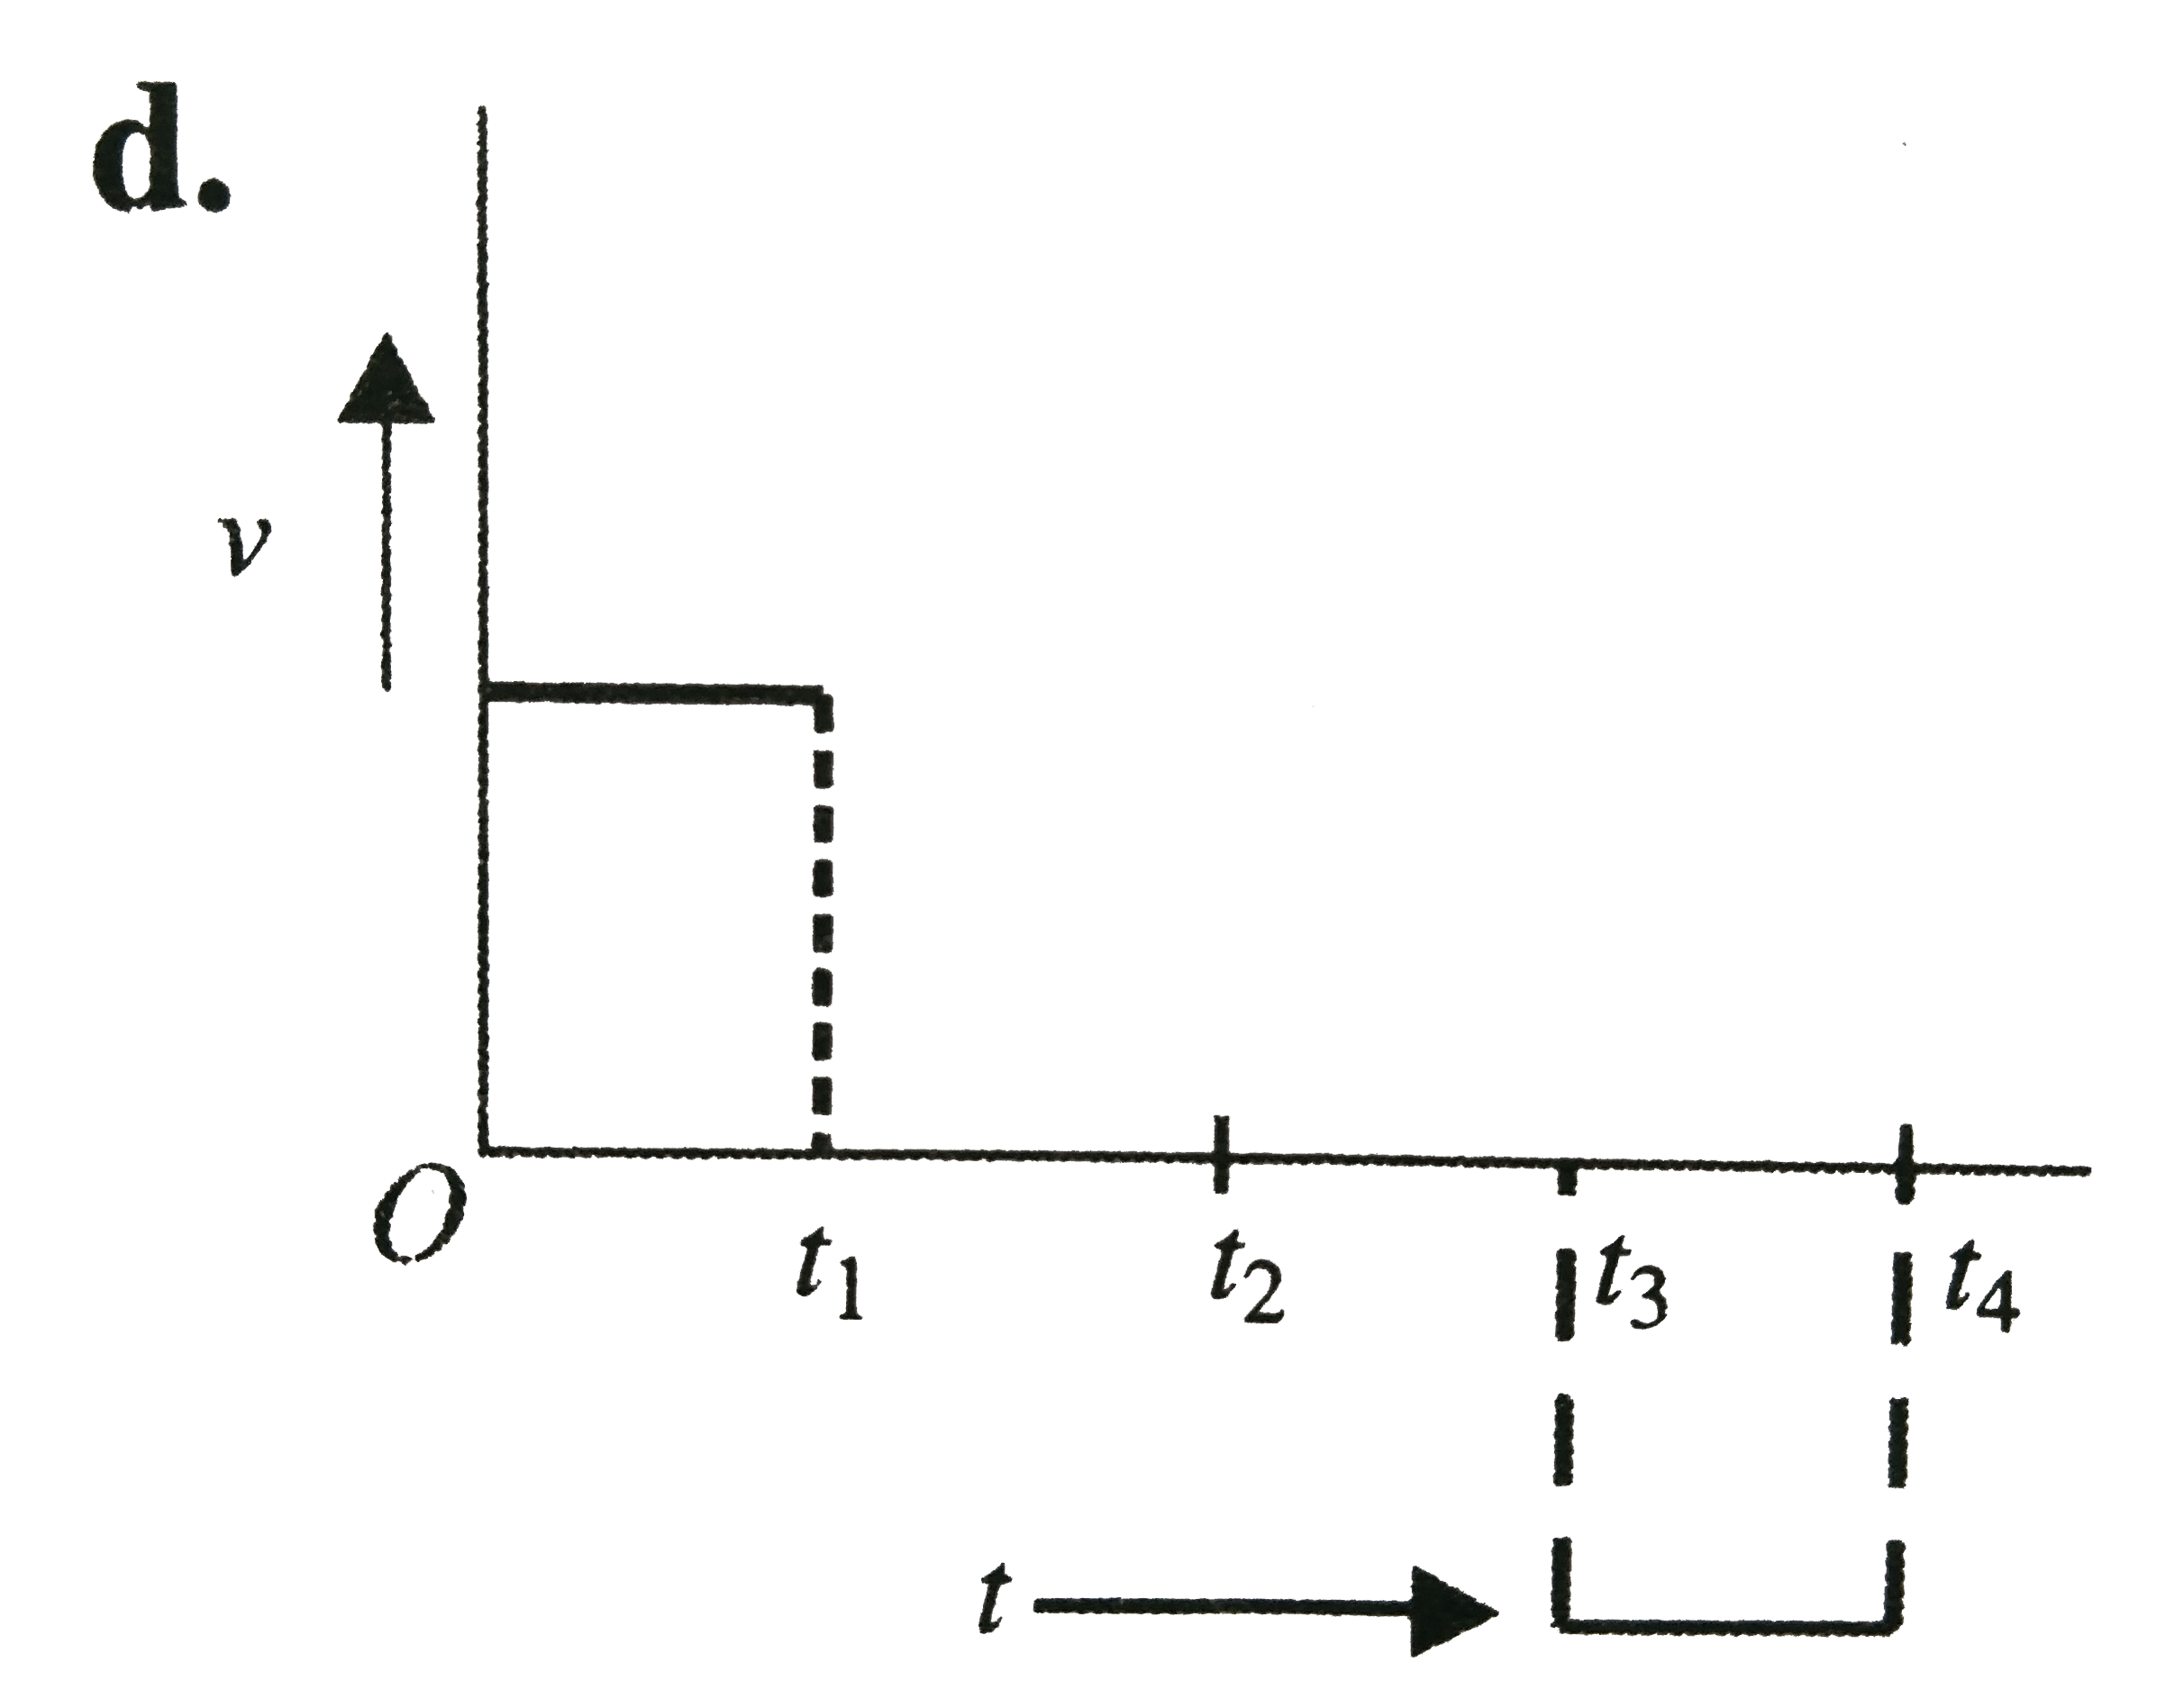 .
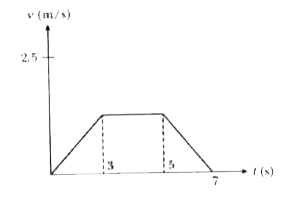
.The velocity - time graph of a body is given in figure below .
The acceleration-time graph of the motion of the body isA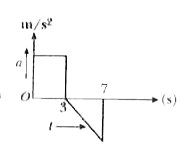 B
B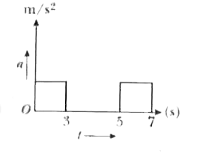 C
C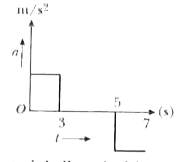 D
D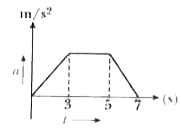
Acceleration-time graph of a body is shown. The corresponding velocity-time graph of the same body is.
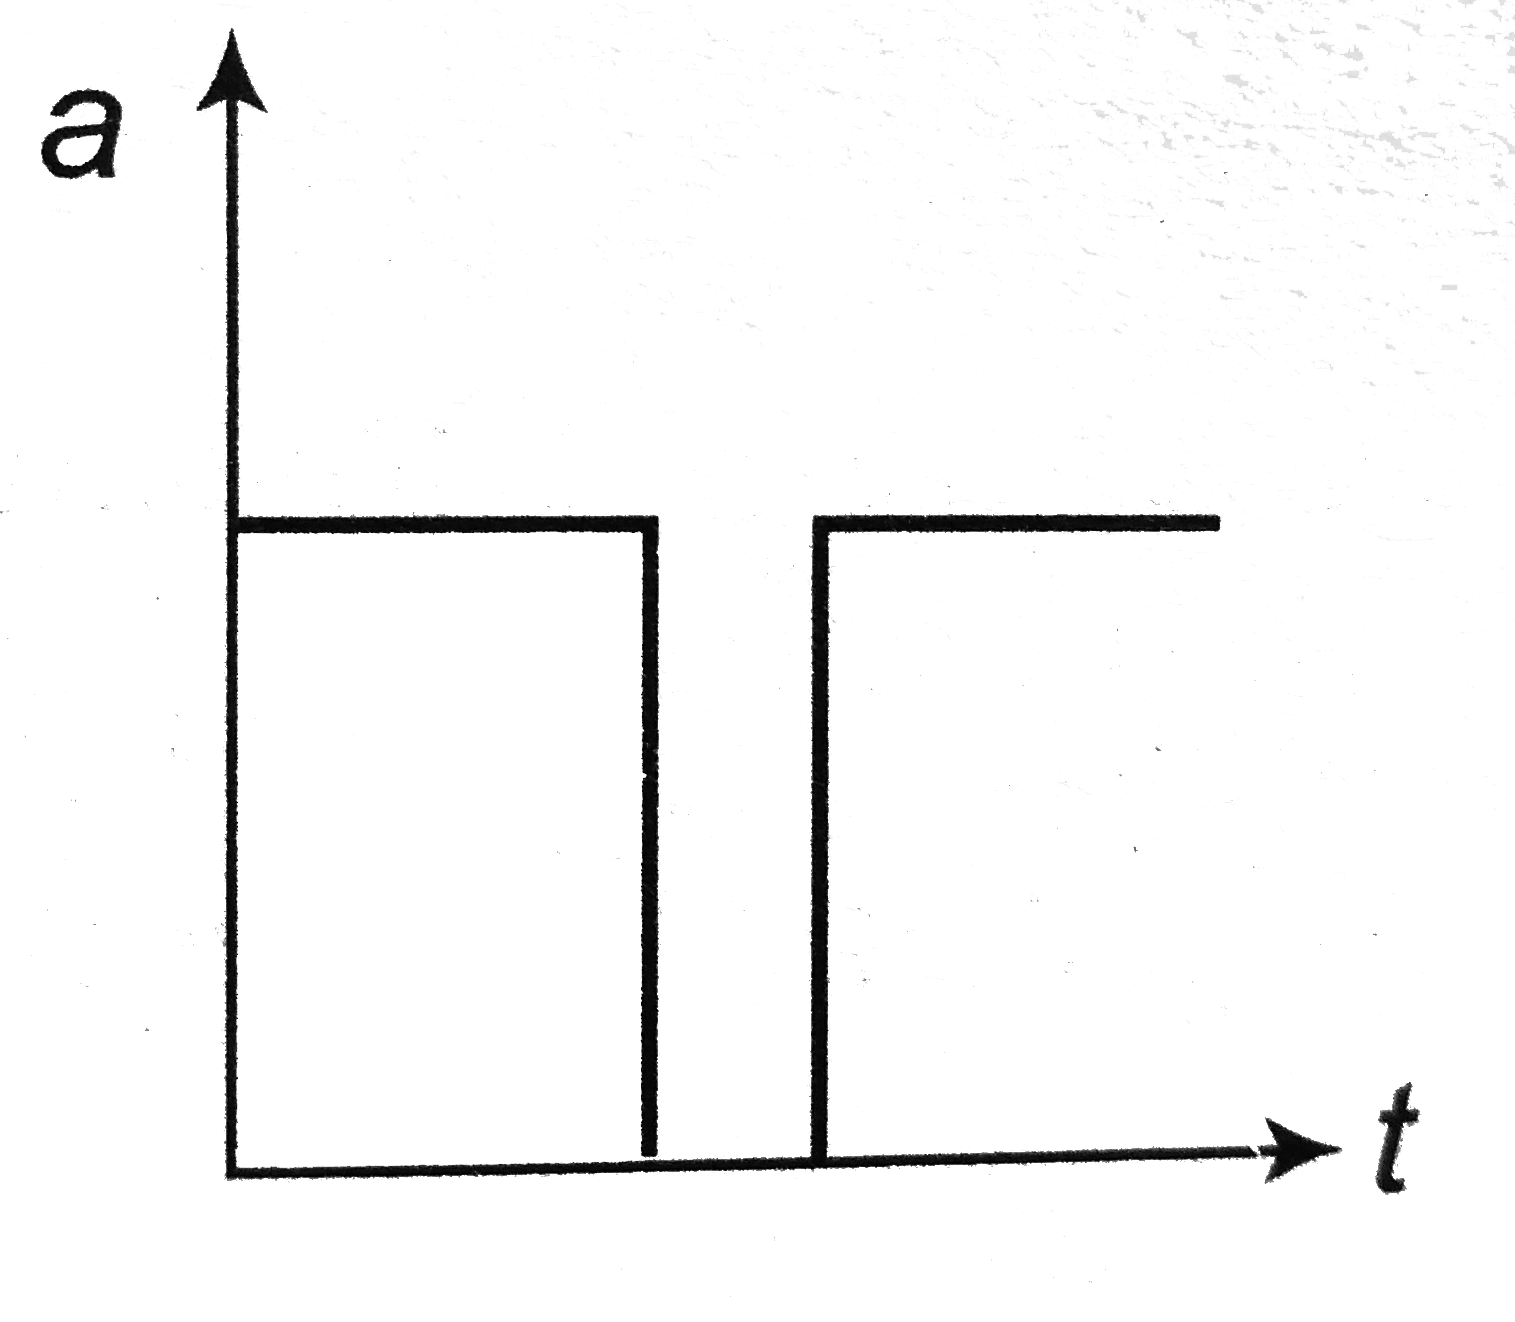 A2sB1sC32sD12s
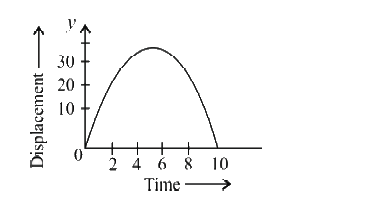
The displacement-time graph of a moving object is shown in figure. Which of the velocity-time graphs shown in figure could represent the motion of the same body ?
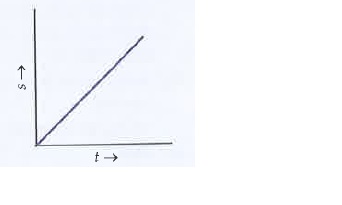
View SolutionDisplacement-time graph of any object is shown in the adjacent figure. Draw velocity-time graph for this motion.
View SolutionThe displacement-time grpah of a body is shown in the figure below.
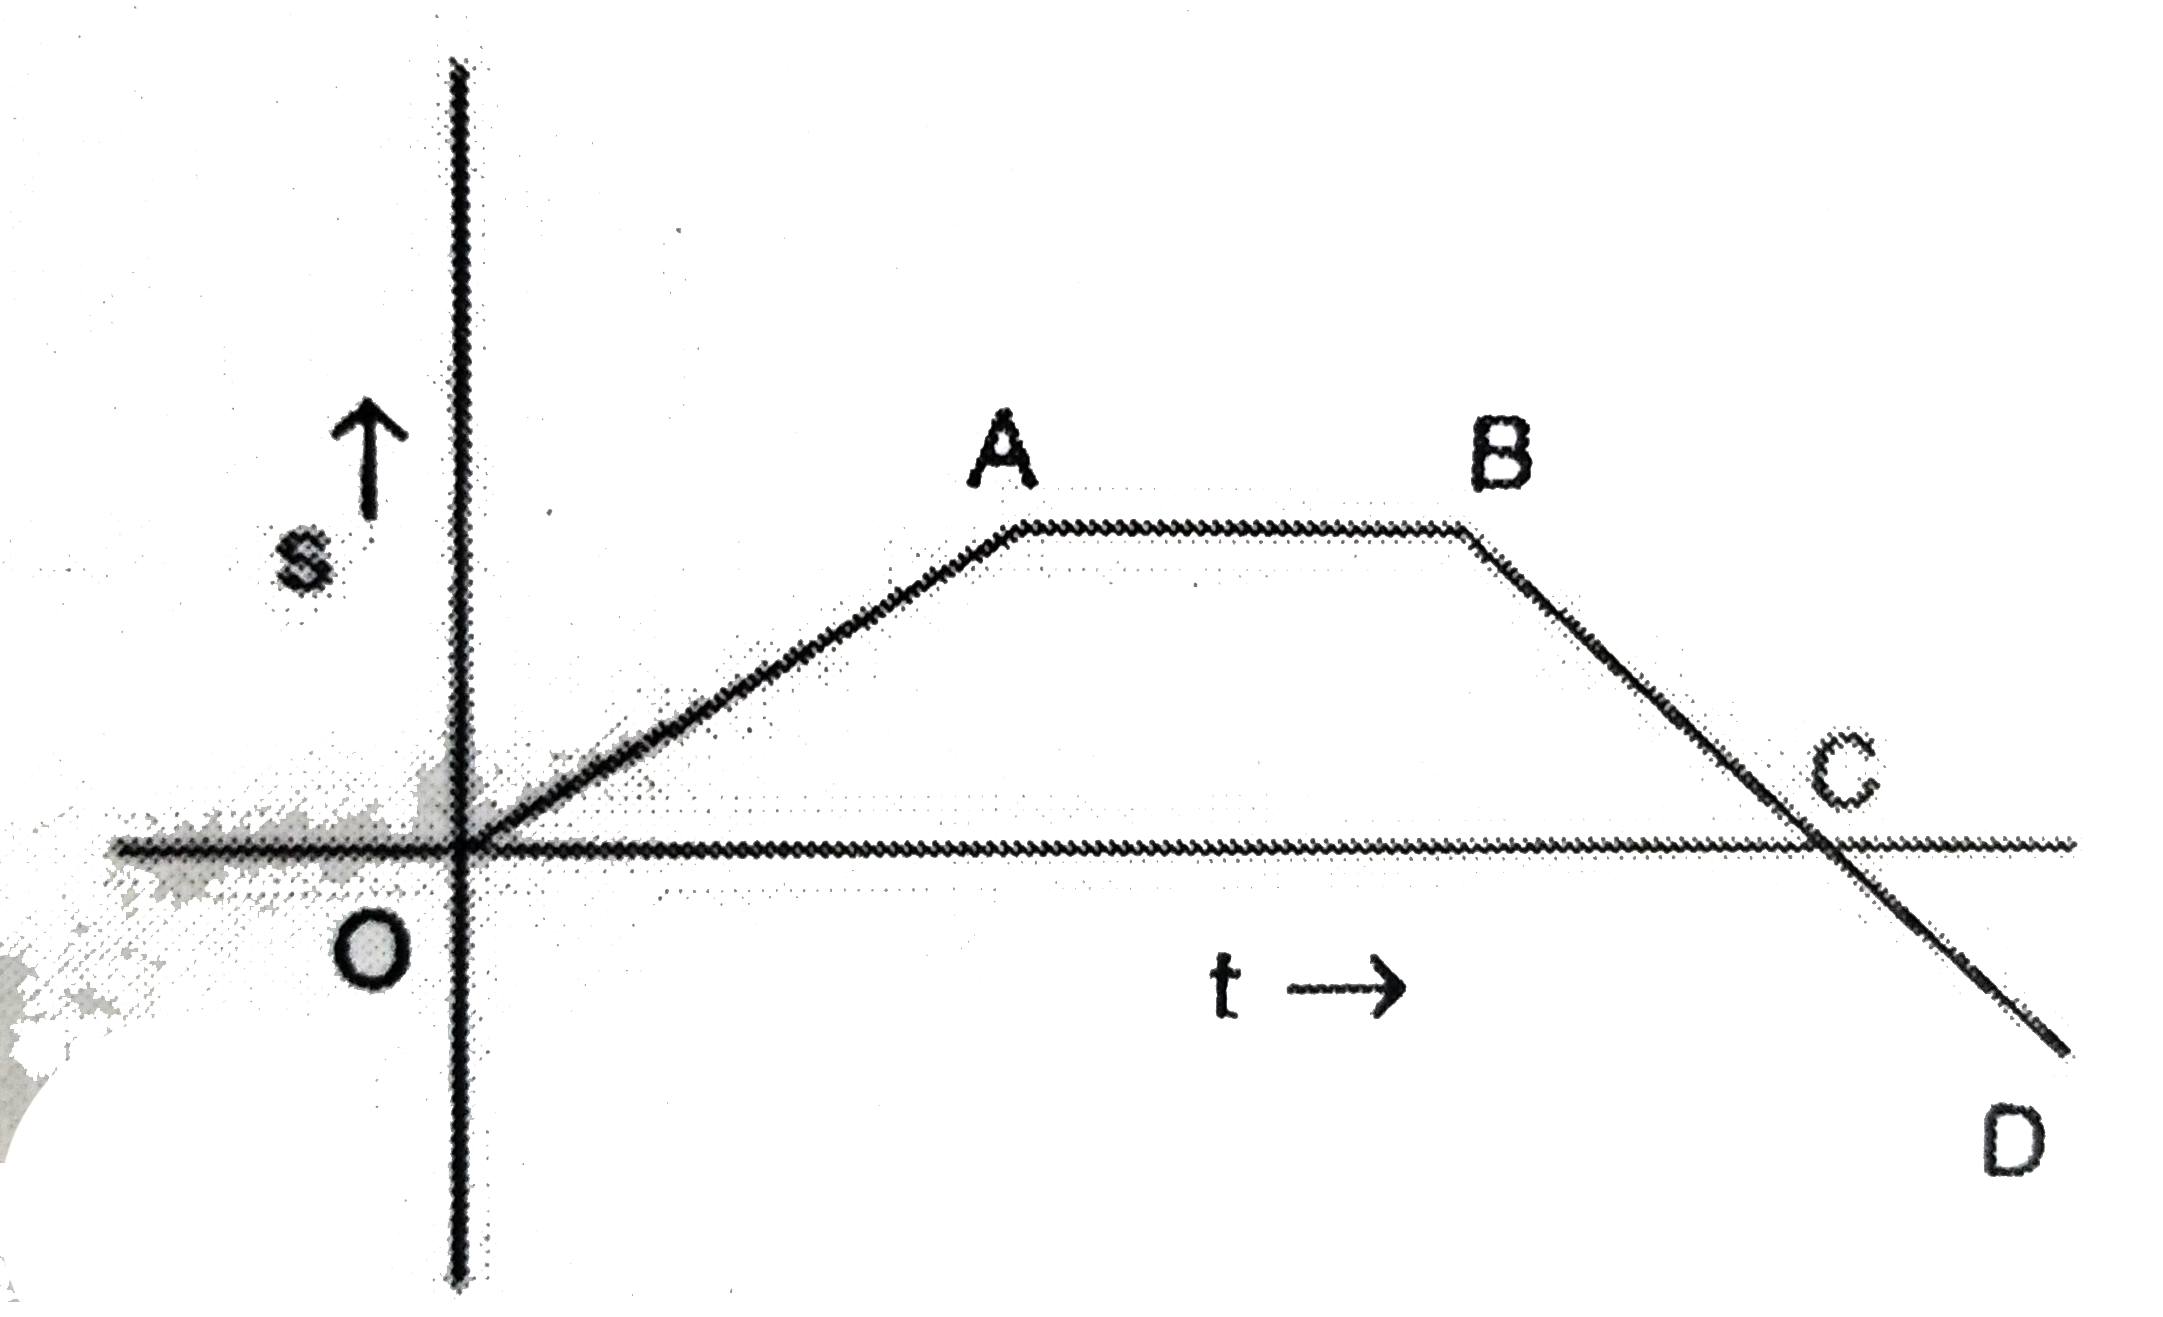
The part of the graph that represens the body at rest is
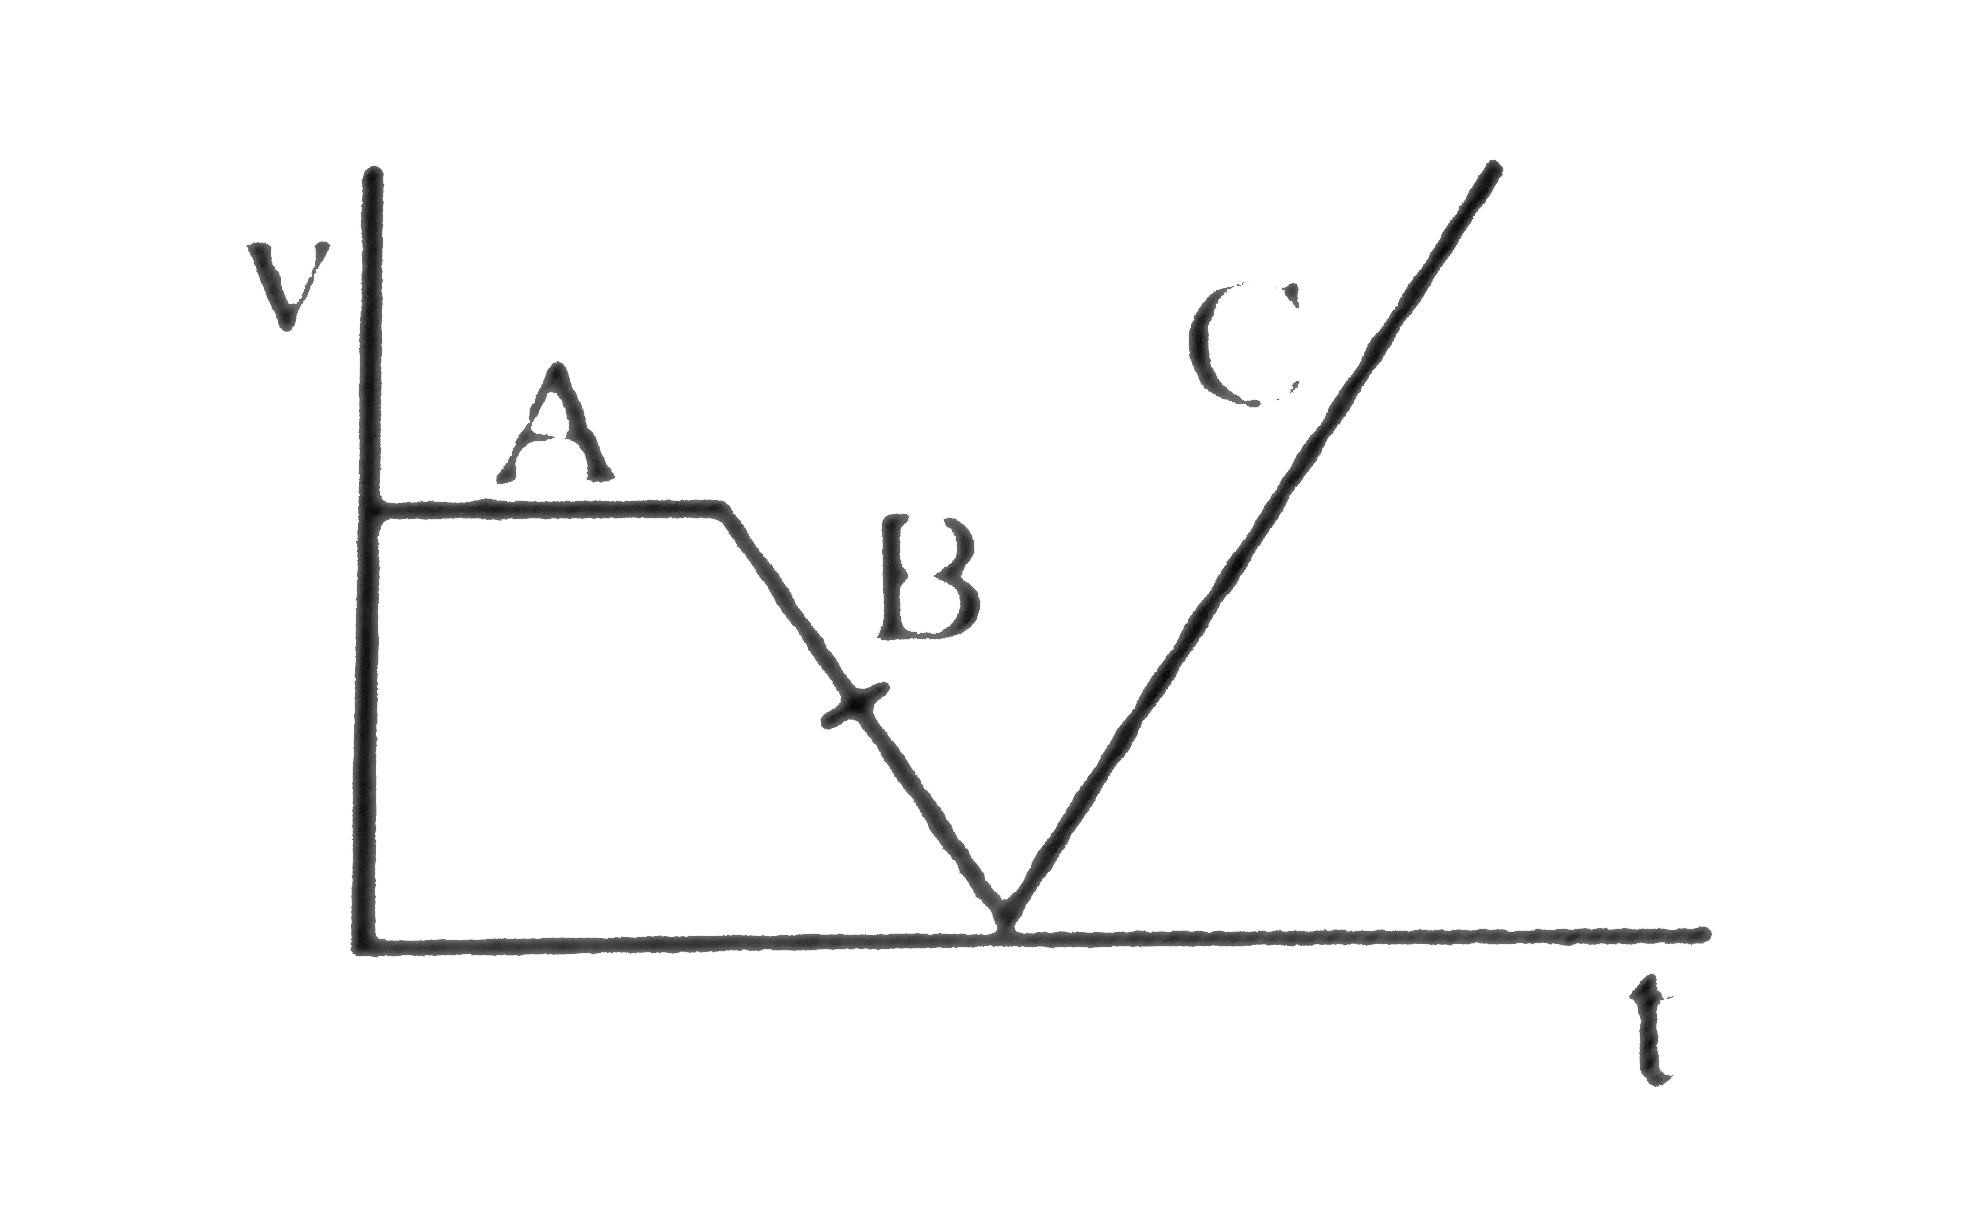
View SolutionVelocity versus time graph of a body is shown in figure. It explains that
View SolutionThe displacement-time grpah of a body is shown in the figure below.

The part of the graph that represens the body at rest is
View Solution
