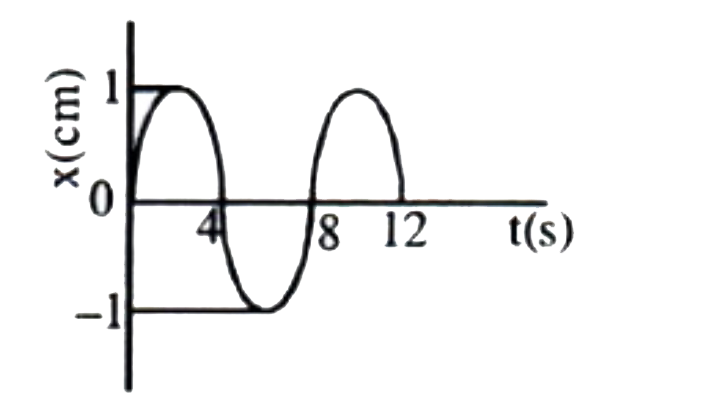
The displacement vs time graph of a particle undergoing S.H>M. Is shown below . The acceleration of the particle at t=2/3s is

A
√3π28cm/s2
B
π28cm/s2
C
−√3π28cm/(s2)
D
−π280cm/s2
Video Solution
Text Solution
The correct Answer is:C
From the x -t graph,
T = 4 s
ω=2πT=2π4=π2 rad
t=23s
ωt=π2×23=π3rad
|a|=ω2Asinωt
=(π2)2×1×sin(π)3
=π24×√32=√38π2cm/s2
|
Topper's Solved these Questions
- OSCILLATIONS BOOK - MODERN PUBLICATIONCHAPTER - OSCILLATIONS EXERCISE - Competition File (Multiple choice questions) AIPMT/NEET other State Boards for Medical Entrance
14 Videos
- OSCILLATIONS BOOK - MODERN PUBLICATIONCHAPTER - OSCILLATIONS EXERCISE - Competition file (Multiple choice question) JEE (Main) & Other State Boards for Engineering Entrance
25 Videos
- OSCILLATIONS BOOK - MODERN PUBLICATIONCHAPTER - OSCILLATIONS EXERCISE - Revision Exercises (Numerical Problems)
23 Videos
- MOTION IN A STRAIGHT LINE BOOK - MODERN PUBLICATIONCHAPTER - MOTION IN A STRAIGHT LINE EXERCISE - CHAPTER PRACTICE TEST
16 Videos
- PHYSICAL WORLD BOOK - MODERN PUBLICATIONCHAPTER - PHYSICAL WORLD EXERCISE - Revision exercises (Long answer questions)
6 Videos
Similar Questions
Knowledge Check
The x-t graph of a particle undergoing SHM is as shown in figure. The acceleration of the particle at t=2/3 is
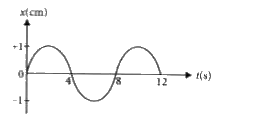 A√332π2cms−2B−π232cms−2Cπ232cms−2D−√332π2cms−2
The x−t graph of a particle undergoing simple harmonic motion is shown below. The accelertion of the particle at t=4/3s is
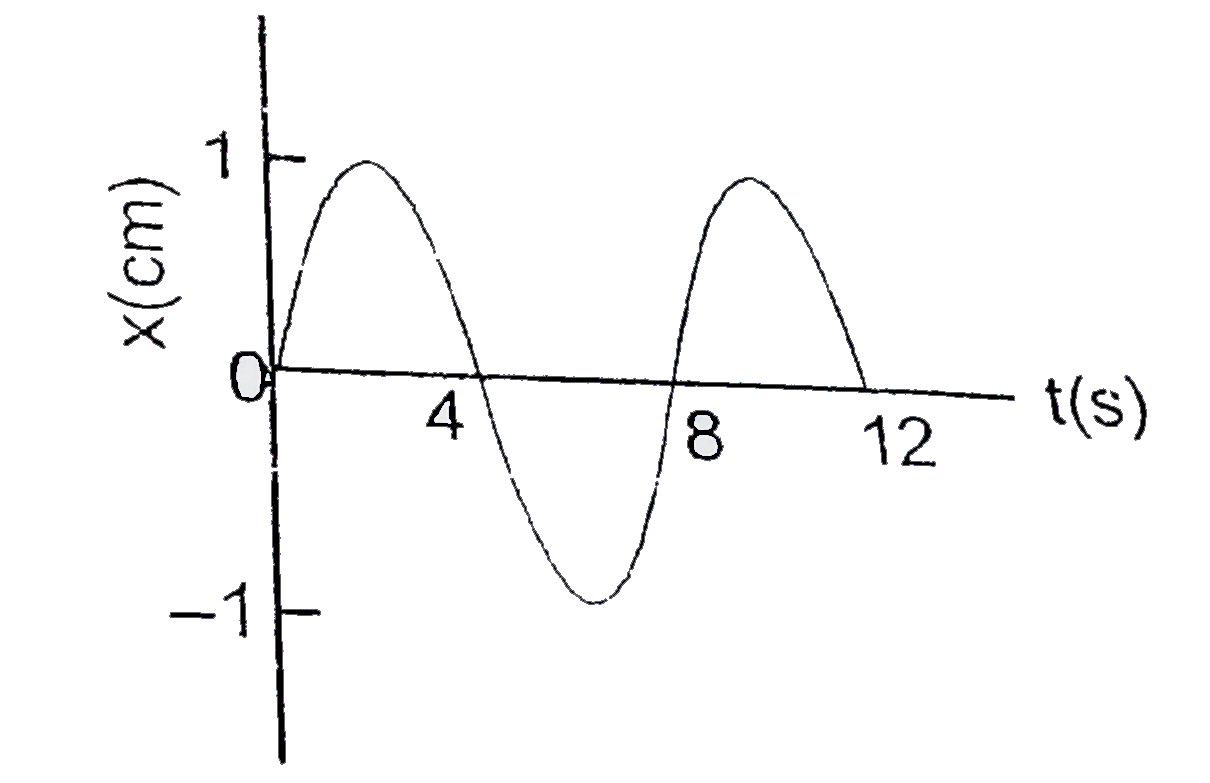 A√332π2cm/s2B−π232cm/s2Cπ232cm/s2D−√332π2cm/s2
The x-t graph of a particle undergoing simple harmonic motion is shown below. The acceleration of the particle of t=4/3s is
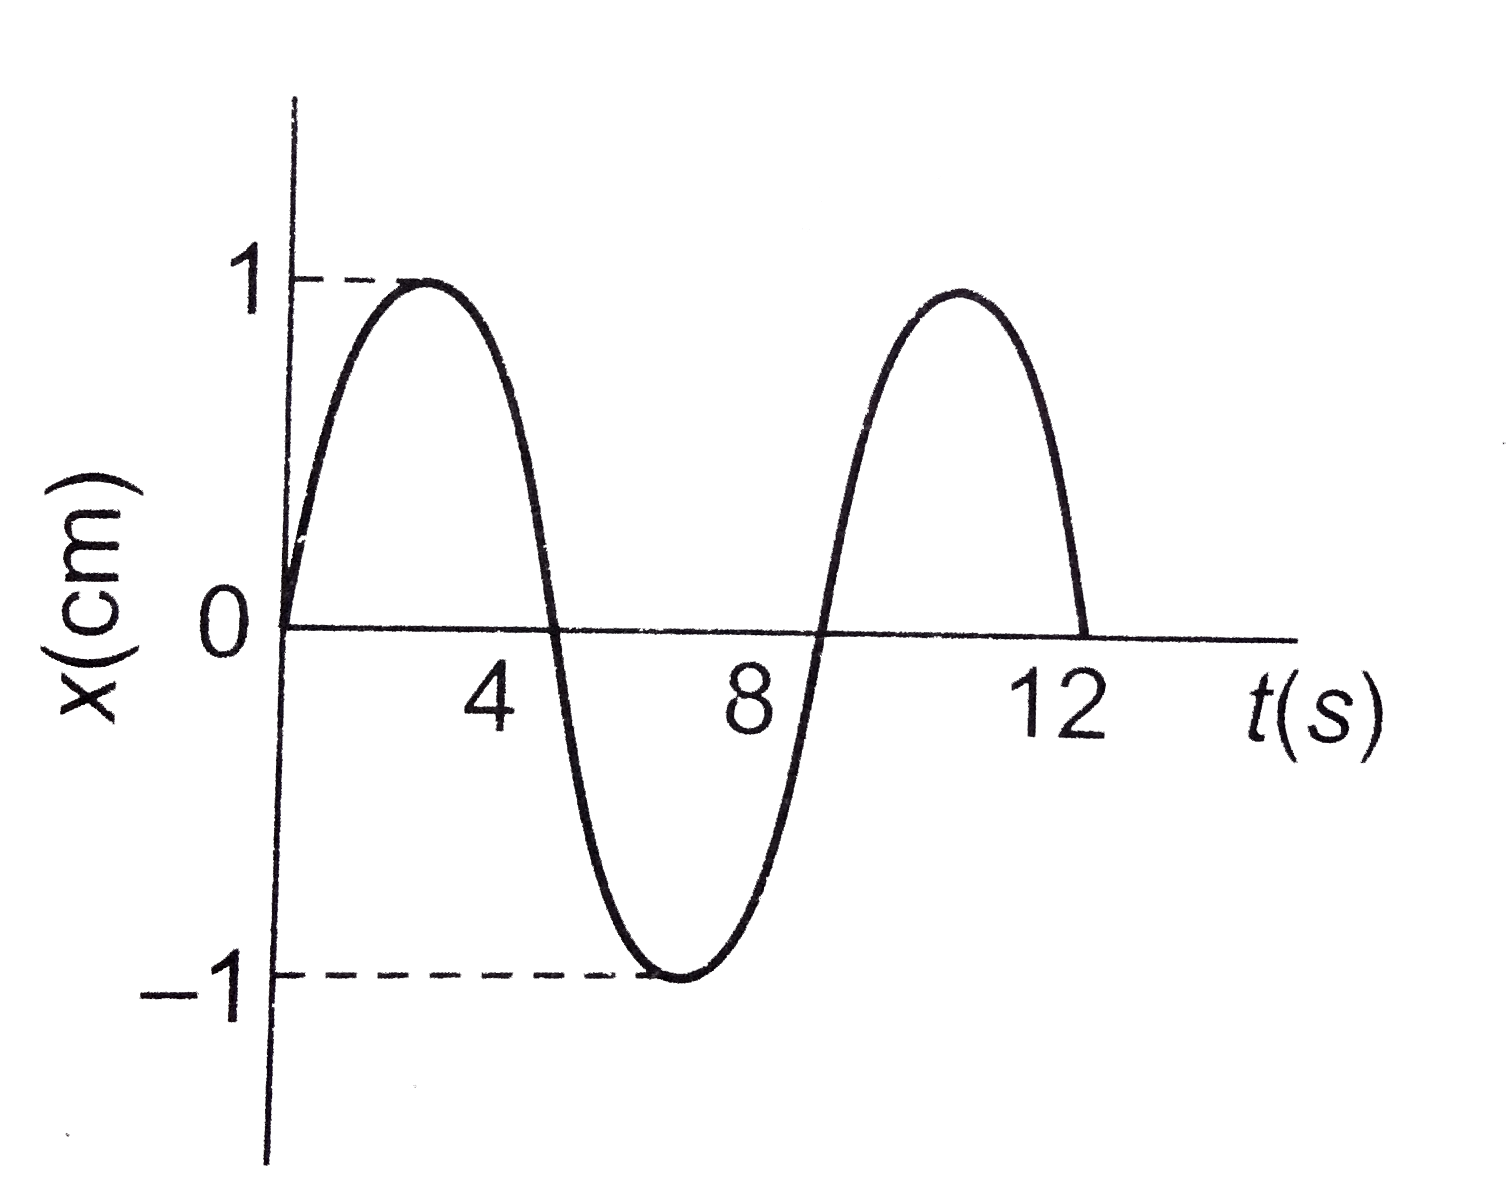 A√332π2cm/s2B−π232cm/s2Cπ232cm/s2D−√332π2cm/s2
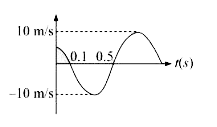
The velocity time graph of a particle executing SHM is shown. The maximum acceleration of the particle is nπm/s2, where n is______.
View SolutionThe x-t graph of a particle executing S.H.M.is given as shown in the figure. Then maximum accleration of the particle is given as?
View SolutionThe displacement-time graph of a particle is as shown below. It indicates that
View SolutionThe velovity-time graph of a particle moving in a straitht line is shown in . The acceleration of the particle at t=9s is.
 .
.
View SolutionThe x−t graph of a particle undergoing simple harmonic motion is shown in figure. Acceleration of particle at t=4/3s is

View Solution

