The distance- time graph for the motion of three vechicles,A , B and C are as shown in the figure , SA,SBndSC are the speeds, of A,B and C , respectively , compare the speeds of A, B and C.
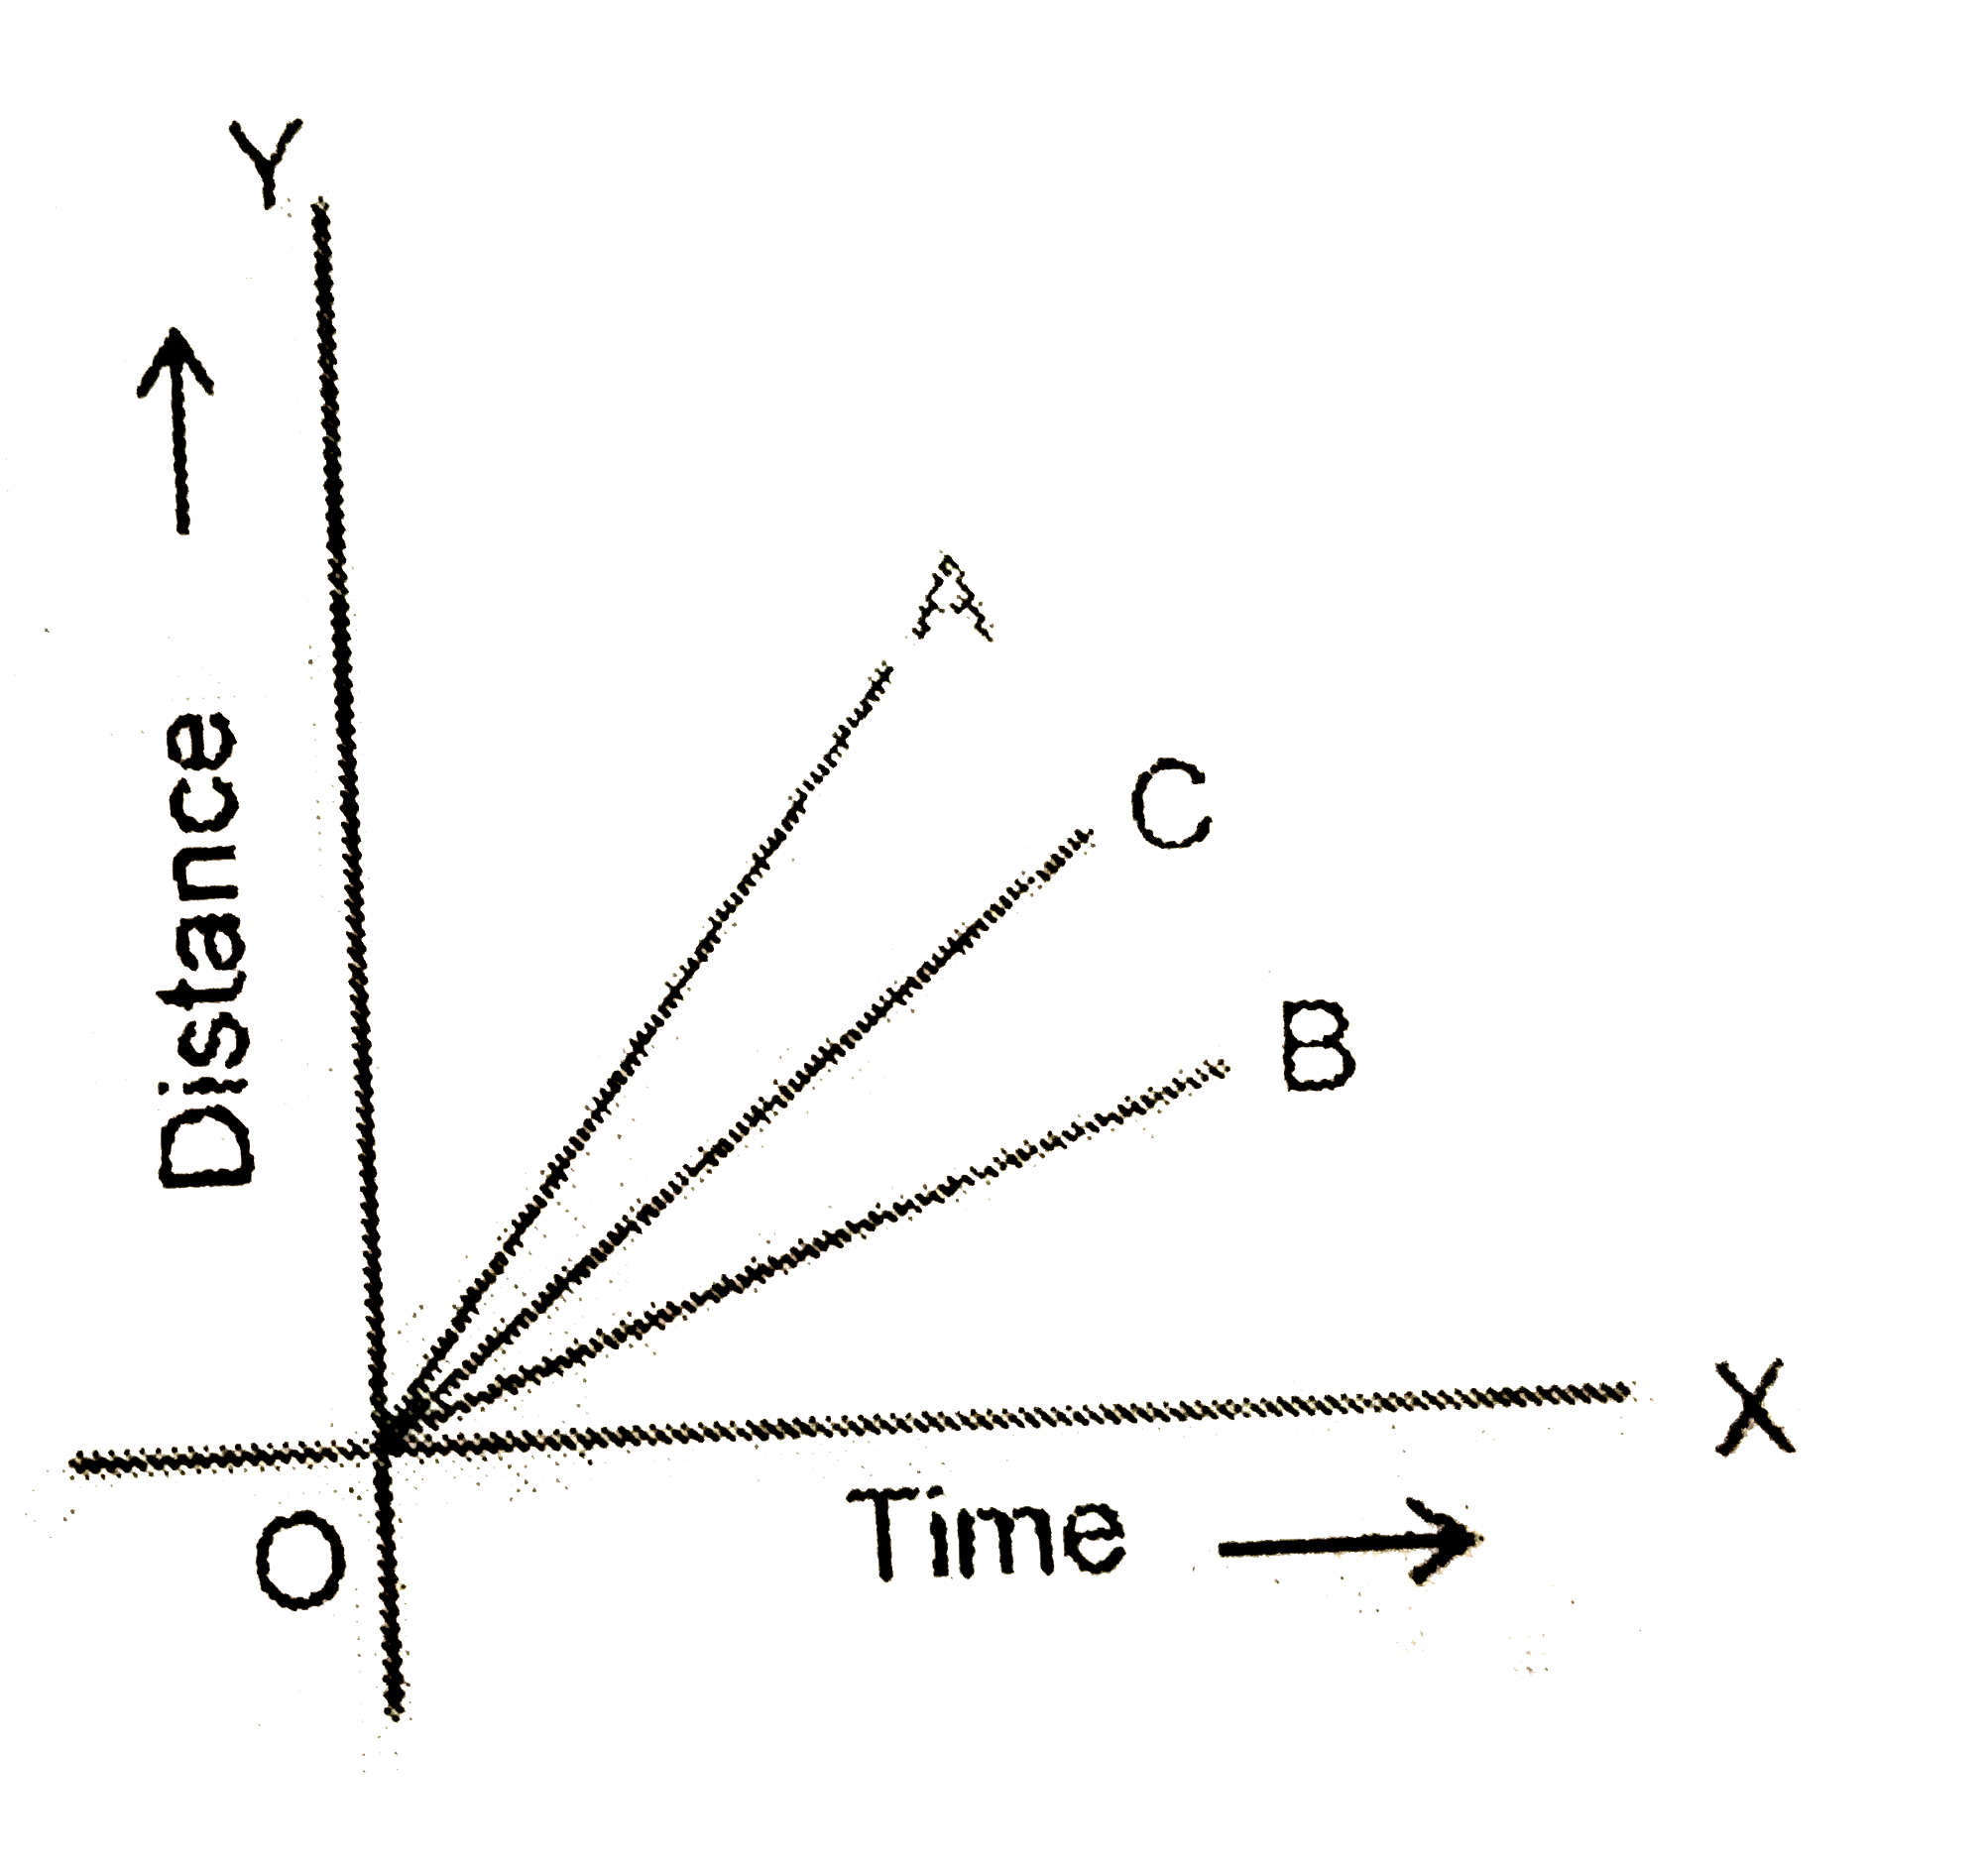
The speed of body is the slope of distance-time graph.
The slope of A > slope of C > slope of B
∴SA>SC>SB.
Topper's Solved these Questions
- KINEMATICSBOOK - PEARSON IIT JEE FOUNDATIONCHAPTER - KINEMATICSEXERCISE - CONCEPT APPLICATION (LEVEL 3)
6 Videos
- KINEMATICSBOOK - PEARSON IIT JEE FOUNDATIONCHAPTER - KINEMATICSEXERCISE - ASSESSMENT TEST (TEST 1 (SELECT THE CORRECT ALTERNATIVE)
14 Videos
- KINEMATICSBOOK - PEARSON IIT JEE FOUNDATIONCHAPTER - KINEMATICSEXERCISE - CONCEPT APPLICATION (LEVEL 1 (MATCH THE COLUMN))
3 Videos
- HEAT BOOK - PEARSON IIT JEE FOUNDATIONCHAPTER - HEAT EXERCISE - Test 2
14 Videos
- LIGHTBOOK - PEARSON IIT JEE FOUNDATIONCHAPTER - LIGHTEXERCISE - ASSESSMENT TEST (TEST 2 (SELECT THE CORRECT ALTERNATIVE))
15 Videos
Similar Questions
The distance- time graph for the motion of three vechicles,A , B and C are as shown in the figure , SA,SBndSC are the speeds, of A,B and C , respectively , compare the speeds of A, B and C.

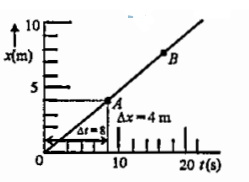
View SolutionThe graph of an object’s motion (along the x-axis) is shown in the figure.The instantaneous velocity of the object at points A and B arevA and vB respectively. Then
View Solution
Knowledge Check
The distance- time graph for the motion of three vechicles,A , B and C are as shown in the figure , SA,SBndSC are the speeds, of A,B and C , respectively , compare the speeds of A, B and C.
 ASA>SB>SCBSA<SB<SCCSA=SB=SCDSA<SB<SC
For the circuit shown in figure the charges on three capacitors, A, B and C are respectively
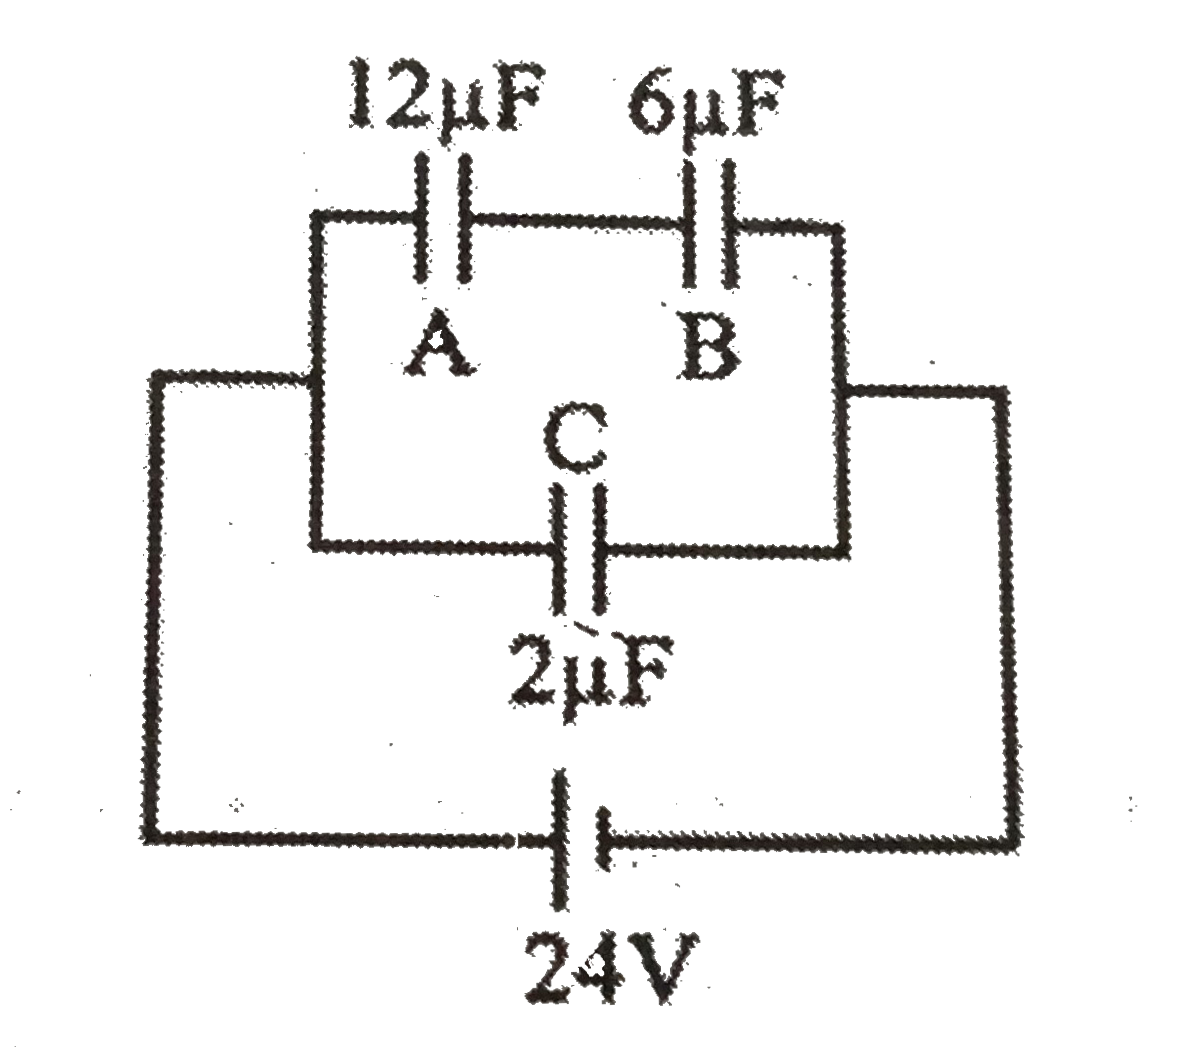 A96μC,96μC,and48μCB32μC,64μC,and48μCC64μC,32μC,and48μCD32μC,32μC,and48μC
The ratio of the speed of A, B and C is 2 : 3 : 6 respectively. What is the ratio of the time taken by A, B and C respectively to cover the same distance?
A2 : 3 : 6B6 : 3 : 2C3 : 2 : 1D1:2:3
Three progressive waves A,B and C are shown in figure. With respect to wave A
_S01_014_Q01.png) .
.
View SolutionThree conducting spheres A, B and C are shown in figure. The radii of the spheres are a, b and c respectively. A and B connected by a conducting wire. The capacity of the system is

View SolutionThree progressive waves A,B,C are shown in the figure
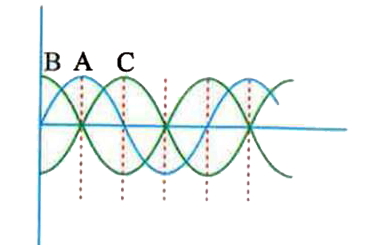
With respect to A, the progressive wave
View Solution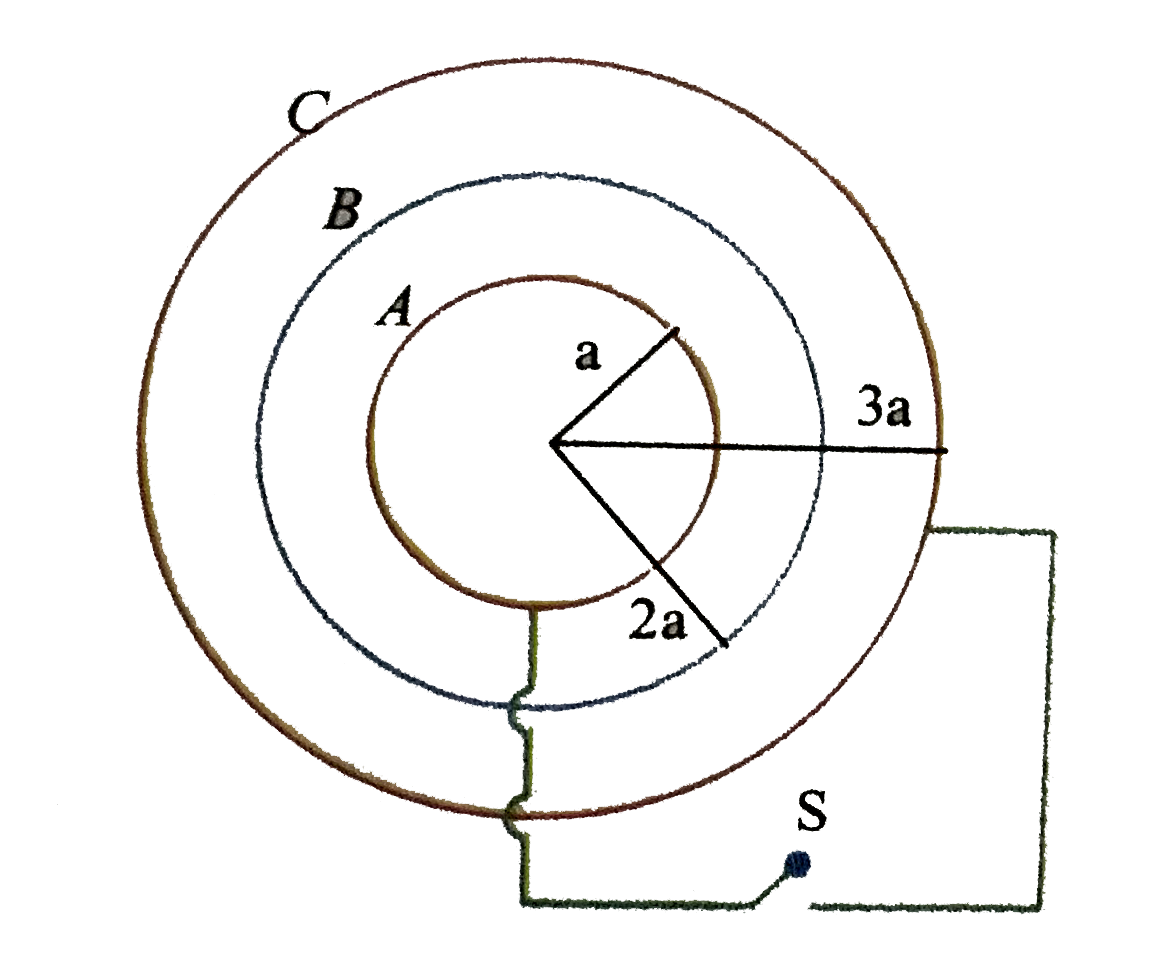
Three conducting concentric shell sA,B,andC of radius a,2a,3a are as shown in the figure.The charge on shell B is Q..The switch S is closed.Then after closing the switch
If σA,σB and σC are the surface charge densities on A,BandC respectively then σA:σ(B):σ(C)is
View SolutionIf A, B and C are three points position vectors a, b and c respectively, then perpendicular distance of A from the line joining B and C is
View Solution
