The graph of an object’s motion (along the x-axis) is shown in the figure.The instantaneous velocity of the object at points A and B are and respectively. Then
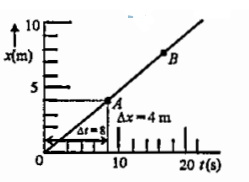
= 0.5m/s
Step by step video & image solution for The graph of an object’s motion (along the x-axis) is shown in the figure.The instantaneous velocity of the object at points A and B are v_A and v_B respectively. Then by Physics experts to help you in doubts & scoring excellent marks in Class 12 exams.
Updated on:21/07/2023Topper's Solved these Questions
Similar Questions
The velocity (u)-time (t) graph of an object moving along a straight line is as shown is Fig. 2 (b) . 30. Calculate the distance covered by object between (i)t=0→t=5s (ii) t=0→t=10s.
 .
.
View SolutionThe velocity (u)-time (t) graph of an object moving along a straight line is as shown is Fig. 2 (b) . 30. Calculate the distance covered by object between (i)t=0→t=5s (ii) t=0→t=10s.
 .
.
View Solution
Knowledge Check
The v-t plot of a moving object ios shown in the figure. The average velocity of the object during the first 10 s is
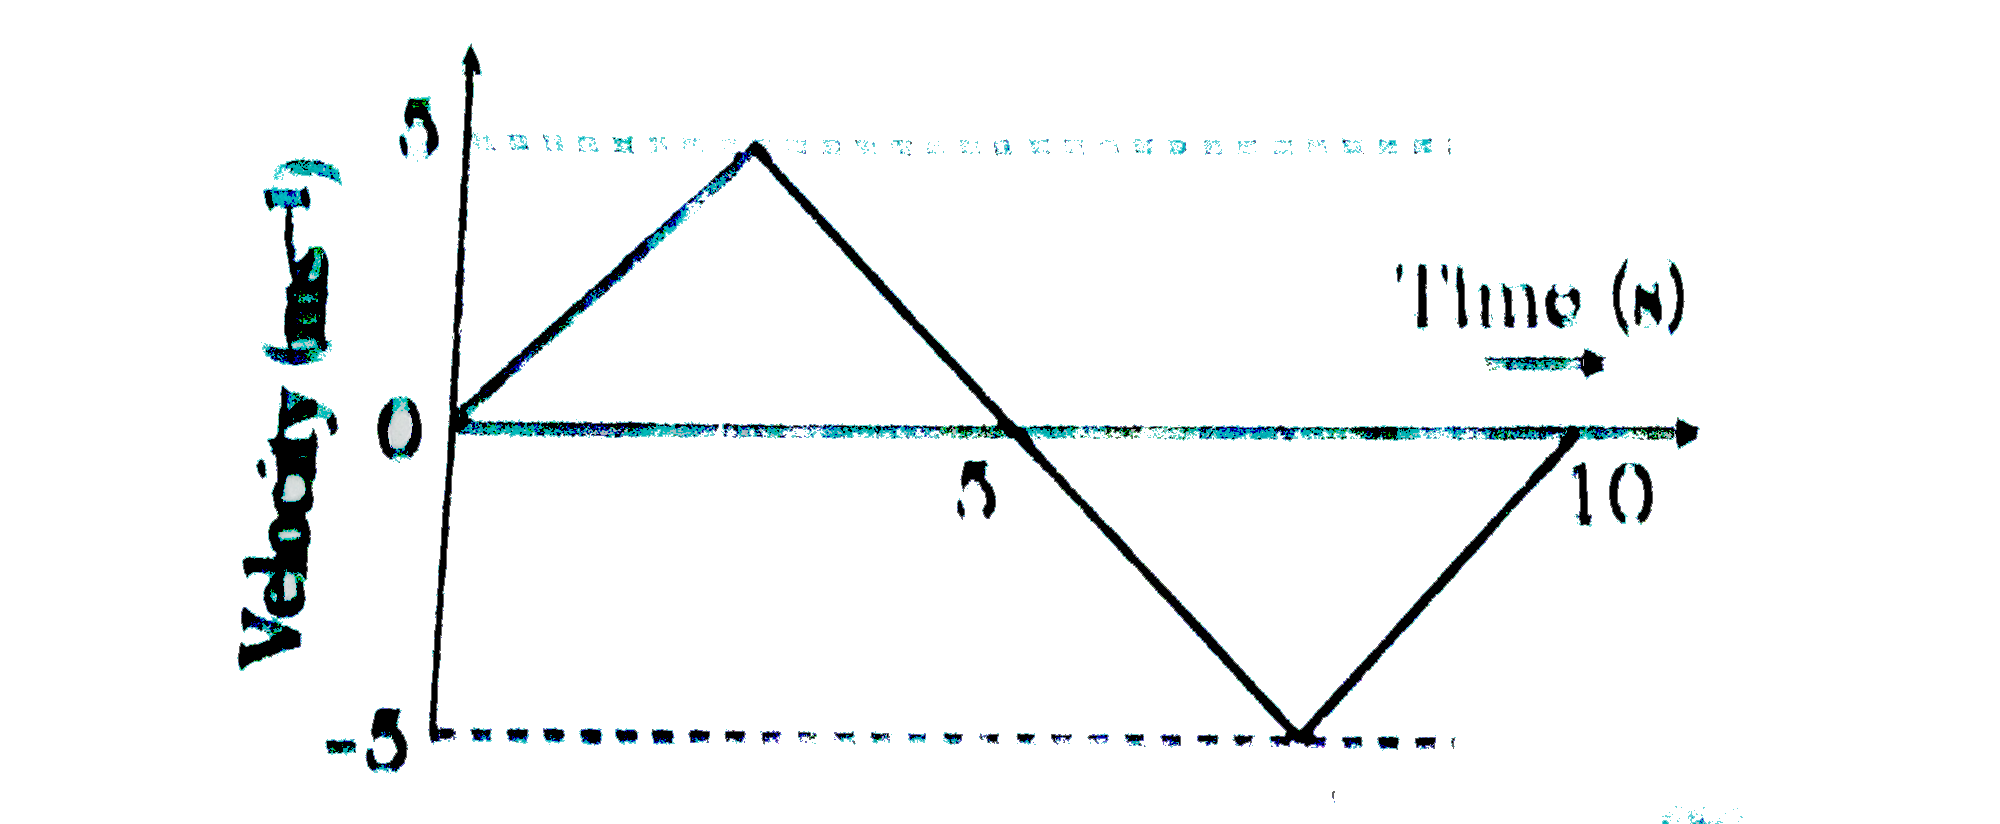 AzeroB2.5ms−1C5ms−1D2ms−1
Velocity time graph of an object of mass 2kg is shown in figure. The force required to move the object for first four seconds is
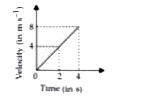 A0NB4NC2ND8N
The v-x graph for a particle moving along a straight line is shown in the figure. At which of the points marked, the acceleration is negative?
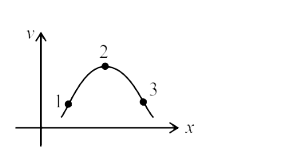 A1B3C1 and 2D3 and 2
Represent the motion of an object in unifrom motion along a straight line when both initial distance and velocity of the object is positive .
View SolutionThe v-t graph for a particle moving along x-axis is shown in the figure, find
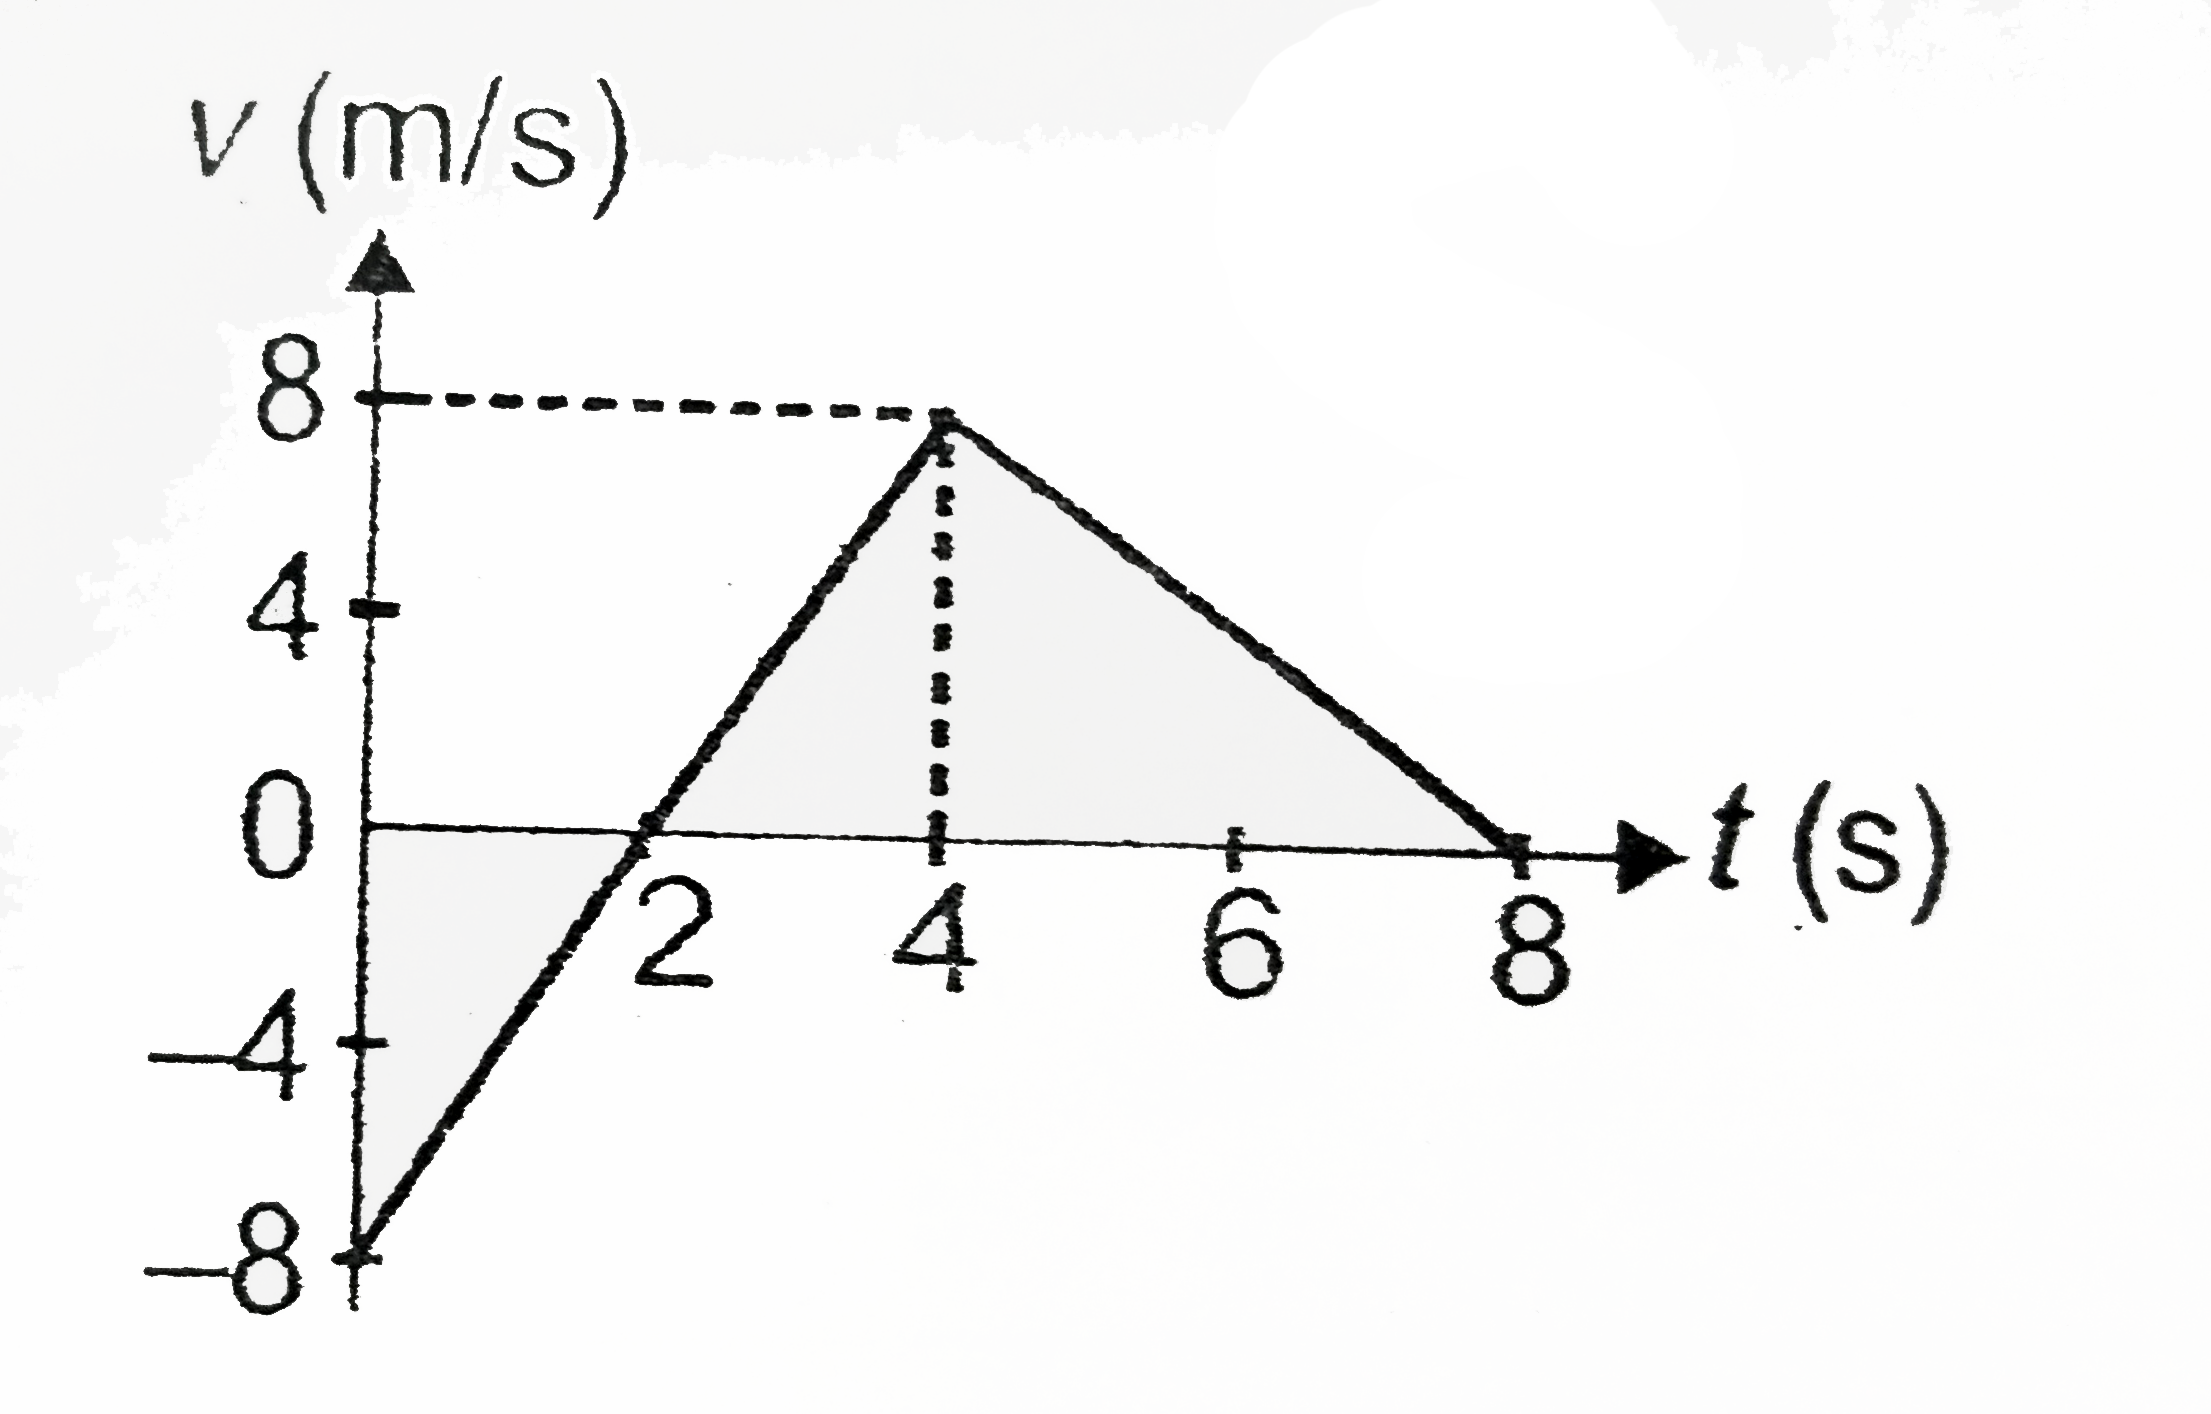
(a) Average velocity in the interval 0 to 8 s.
(b) Average speed in the interval 0 to 8 s.
(c) Average acceleration in the interval 0 to 4 s.
(d) Instantaneous acceleration at t = 2.5 s.
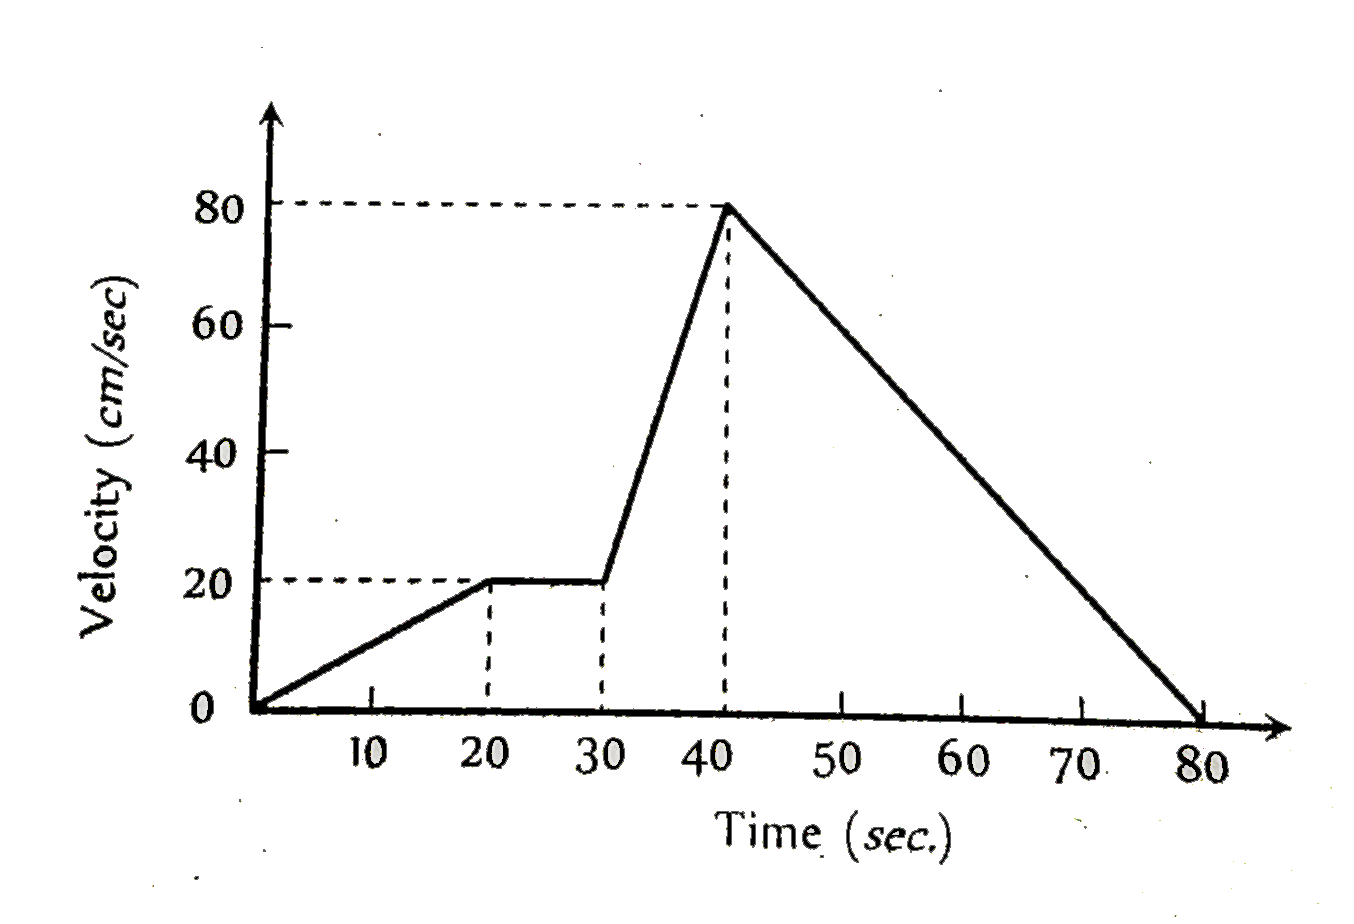
View SolutionThe v−t graph of a moving object is given in figure. The maximum acceleration is
View SolutionThe x-t graph of a particle moving along a straight line is shown in figure

The v-t graph of the particle is correctly shown by
View SolutionThe x−t graph of particle moving along a straight line is shown in figure
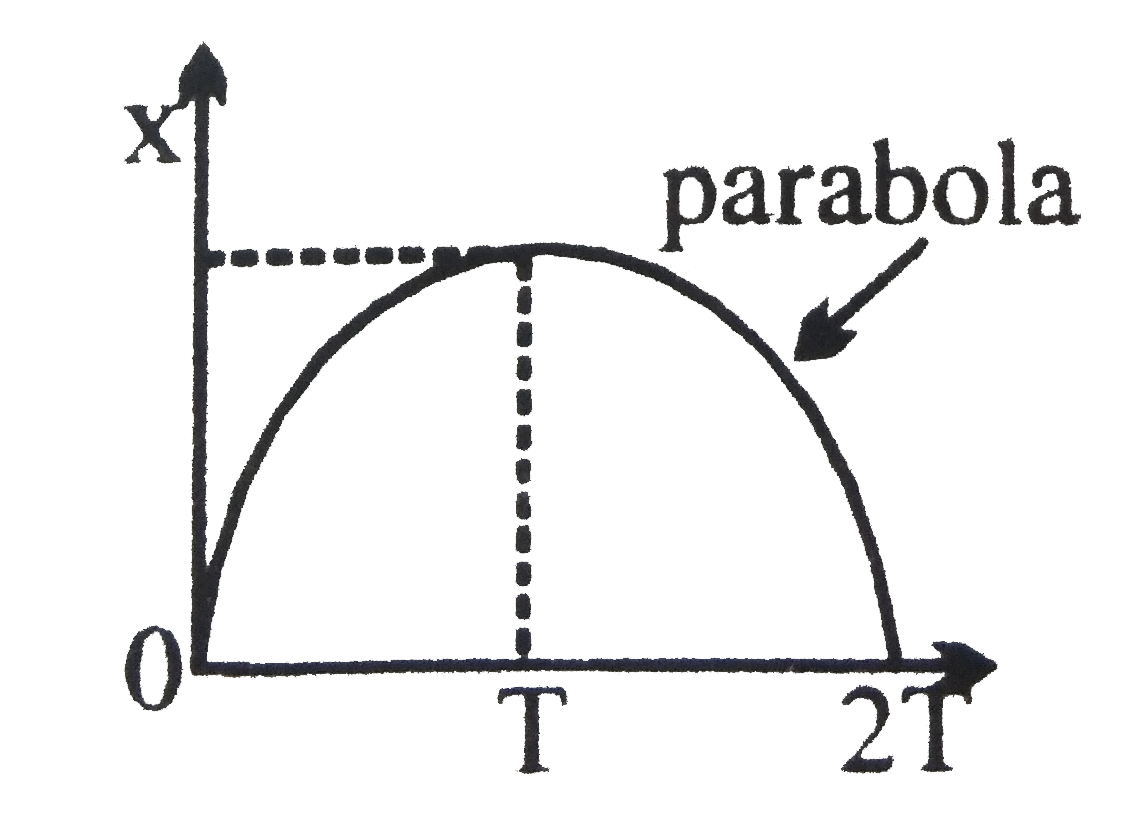
The v−t graph of the particles is correctly shown by
View Solution
