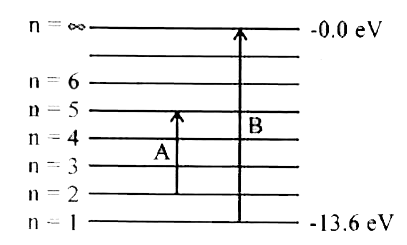
The energy level diagram for the hydrogen spectrum with transitions A and B are as shown in the figure. What is represented by A and B

Sepctral line of Balmer series and the maximum wavelength of Lyman series
Spectral line of Lyman series and the absorption of greater wavelength of limiting value of Paschen series
Abroption line of Balmer series and the wavelength lesser than lowest of the Lyman series
Absorption line of balmer series and the ionization energy of hydrogen
The correct Answer is:D
(1) ( n=5 to n=2) represents an emission line but A represents the transition from 2 to 5 . This represents an absorption line of balmer series.
(2) In B we consider the transition from n =1 to n=∞ . It represents the ionisation enery for H2 atom in the ground state Eionisation=+13.6eV .
Topper's Solved these Questions
Similar Questions
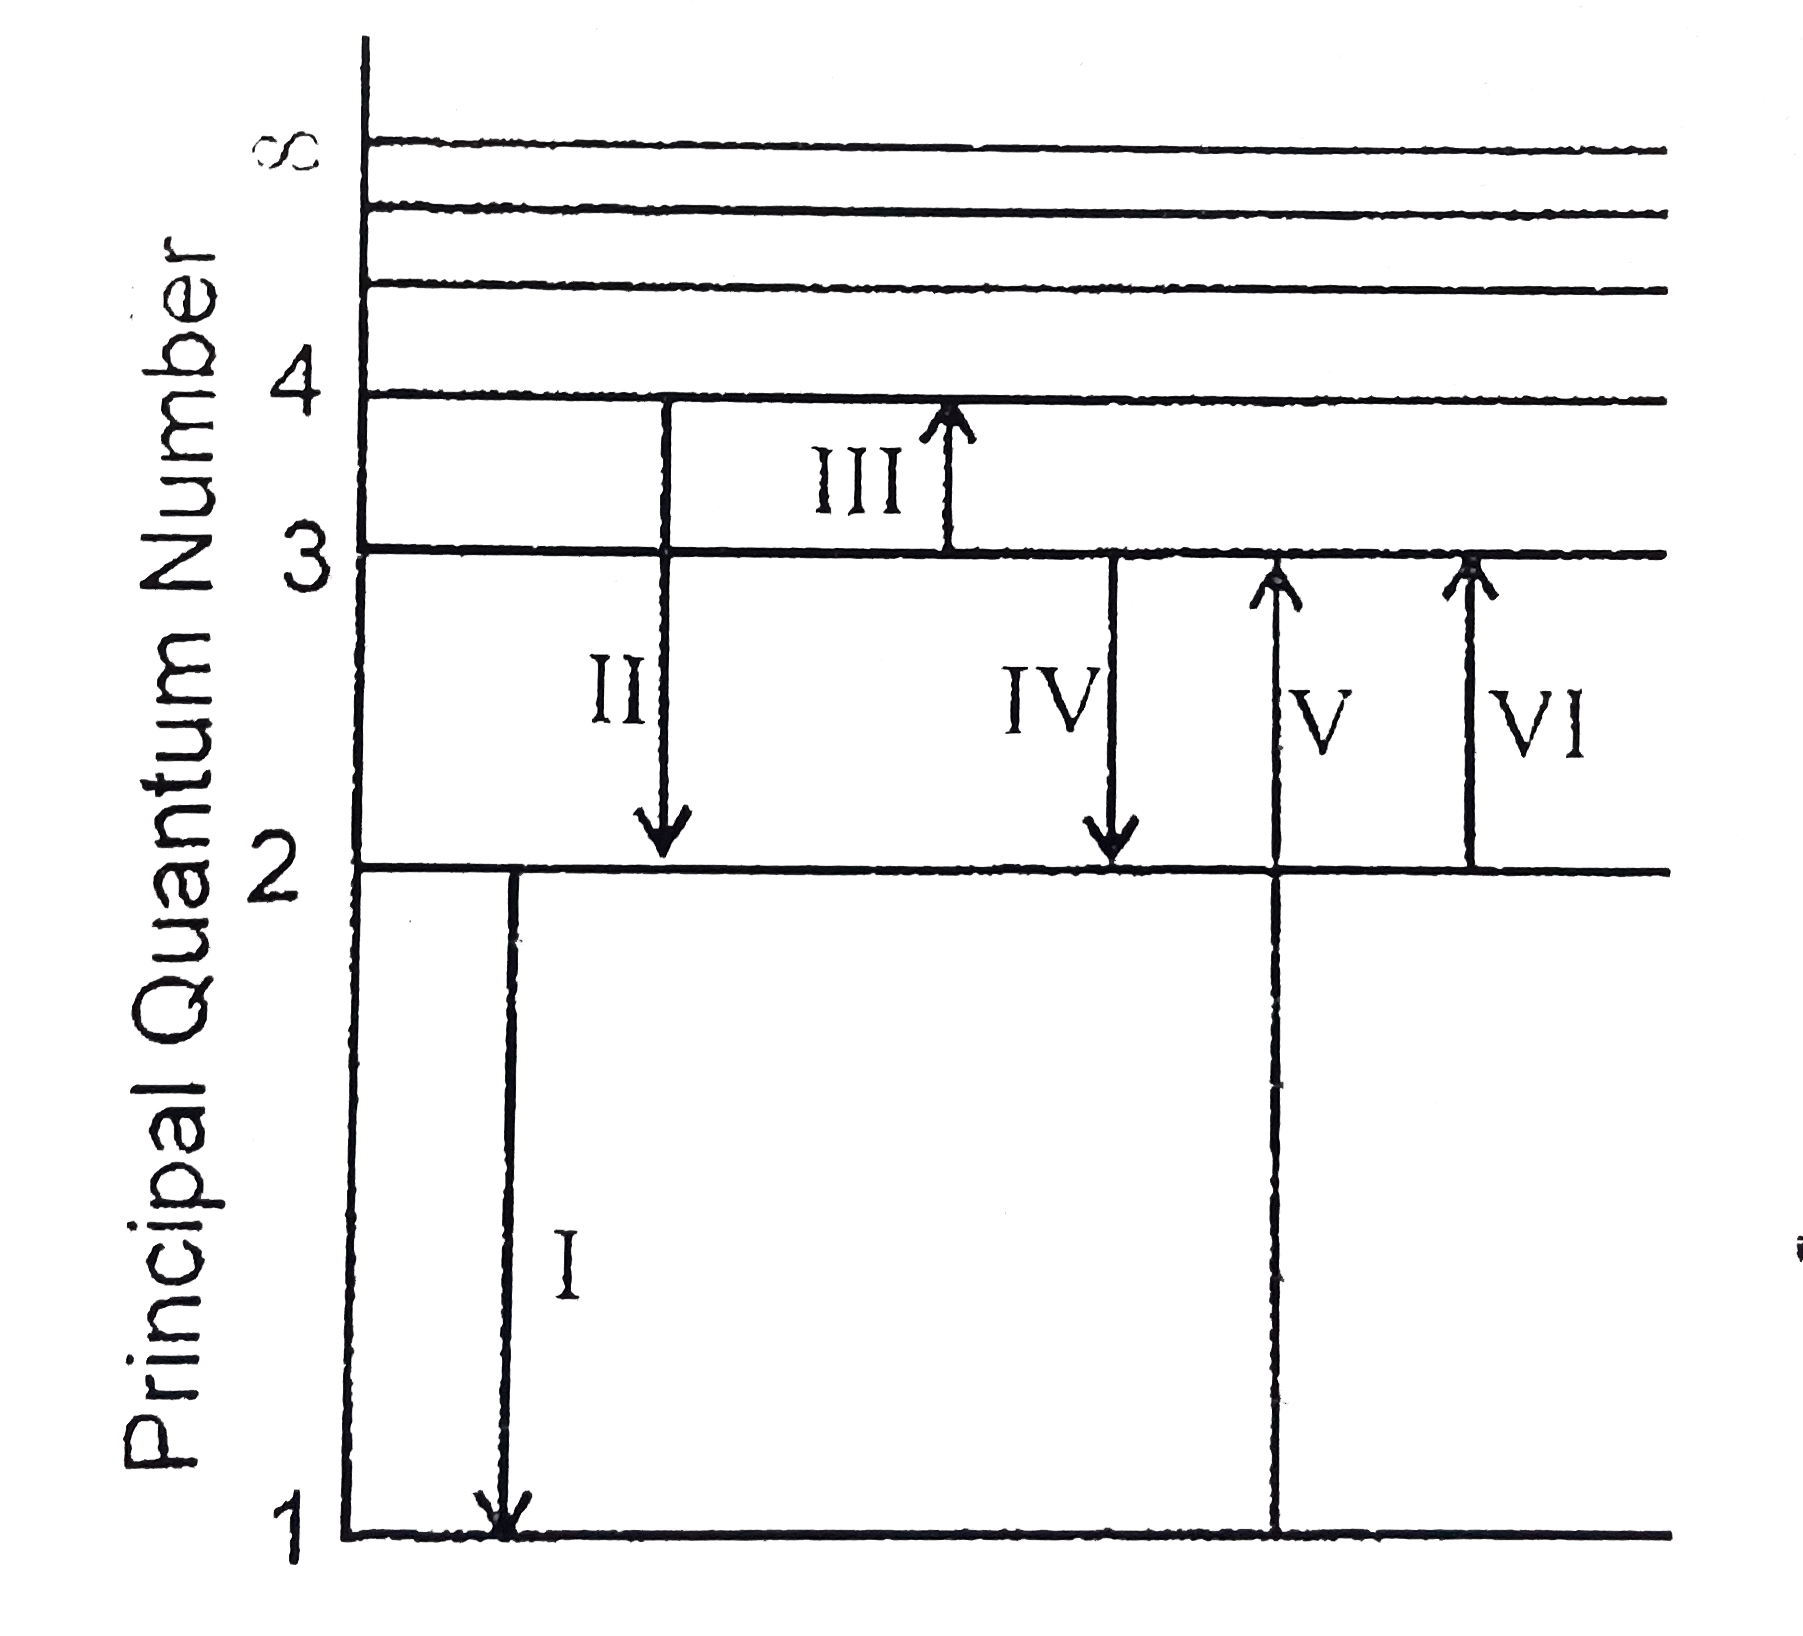
The figure shows an energy level diagram for the hydrogen atom. Several transitions are marked as I,II,III ,______, the diagram is only indicative and not to scale.
_E01_150_Q01.png) .
.
Which transition involves the longest wavelength line in the visible portion of the hydrogen spectrum
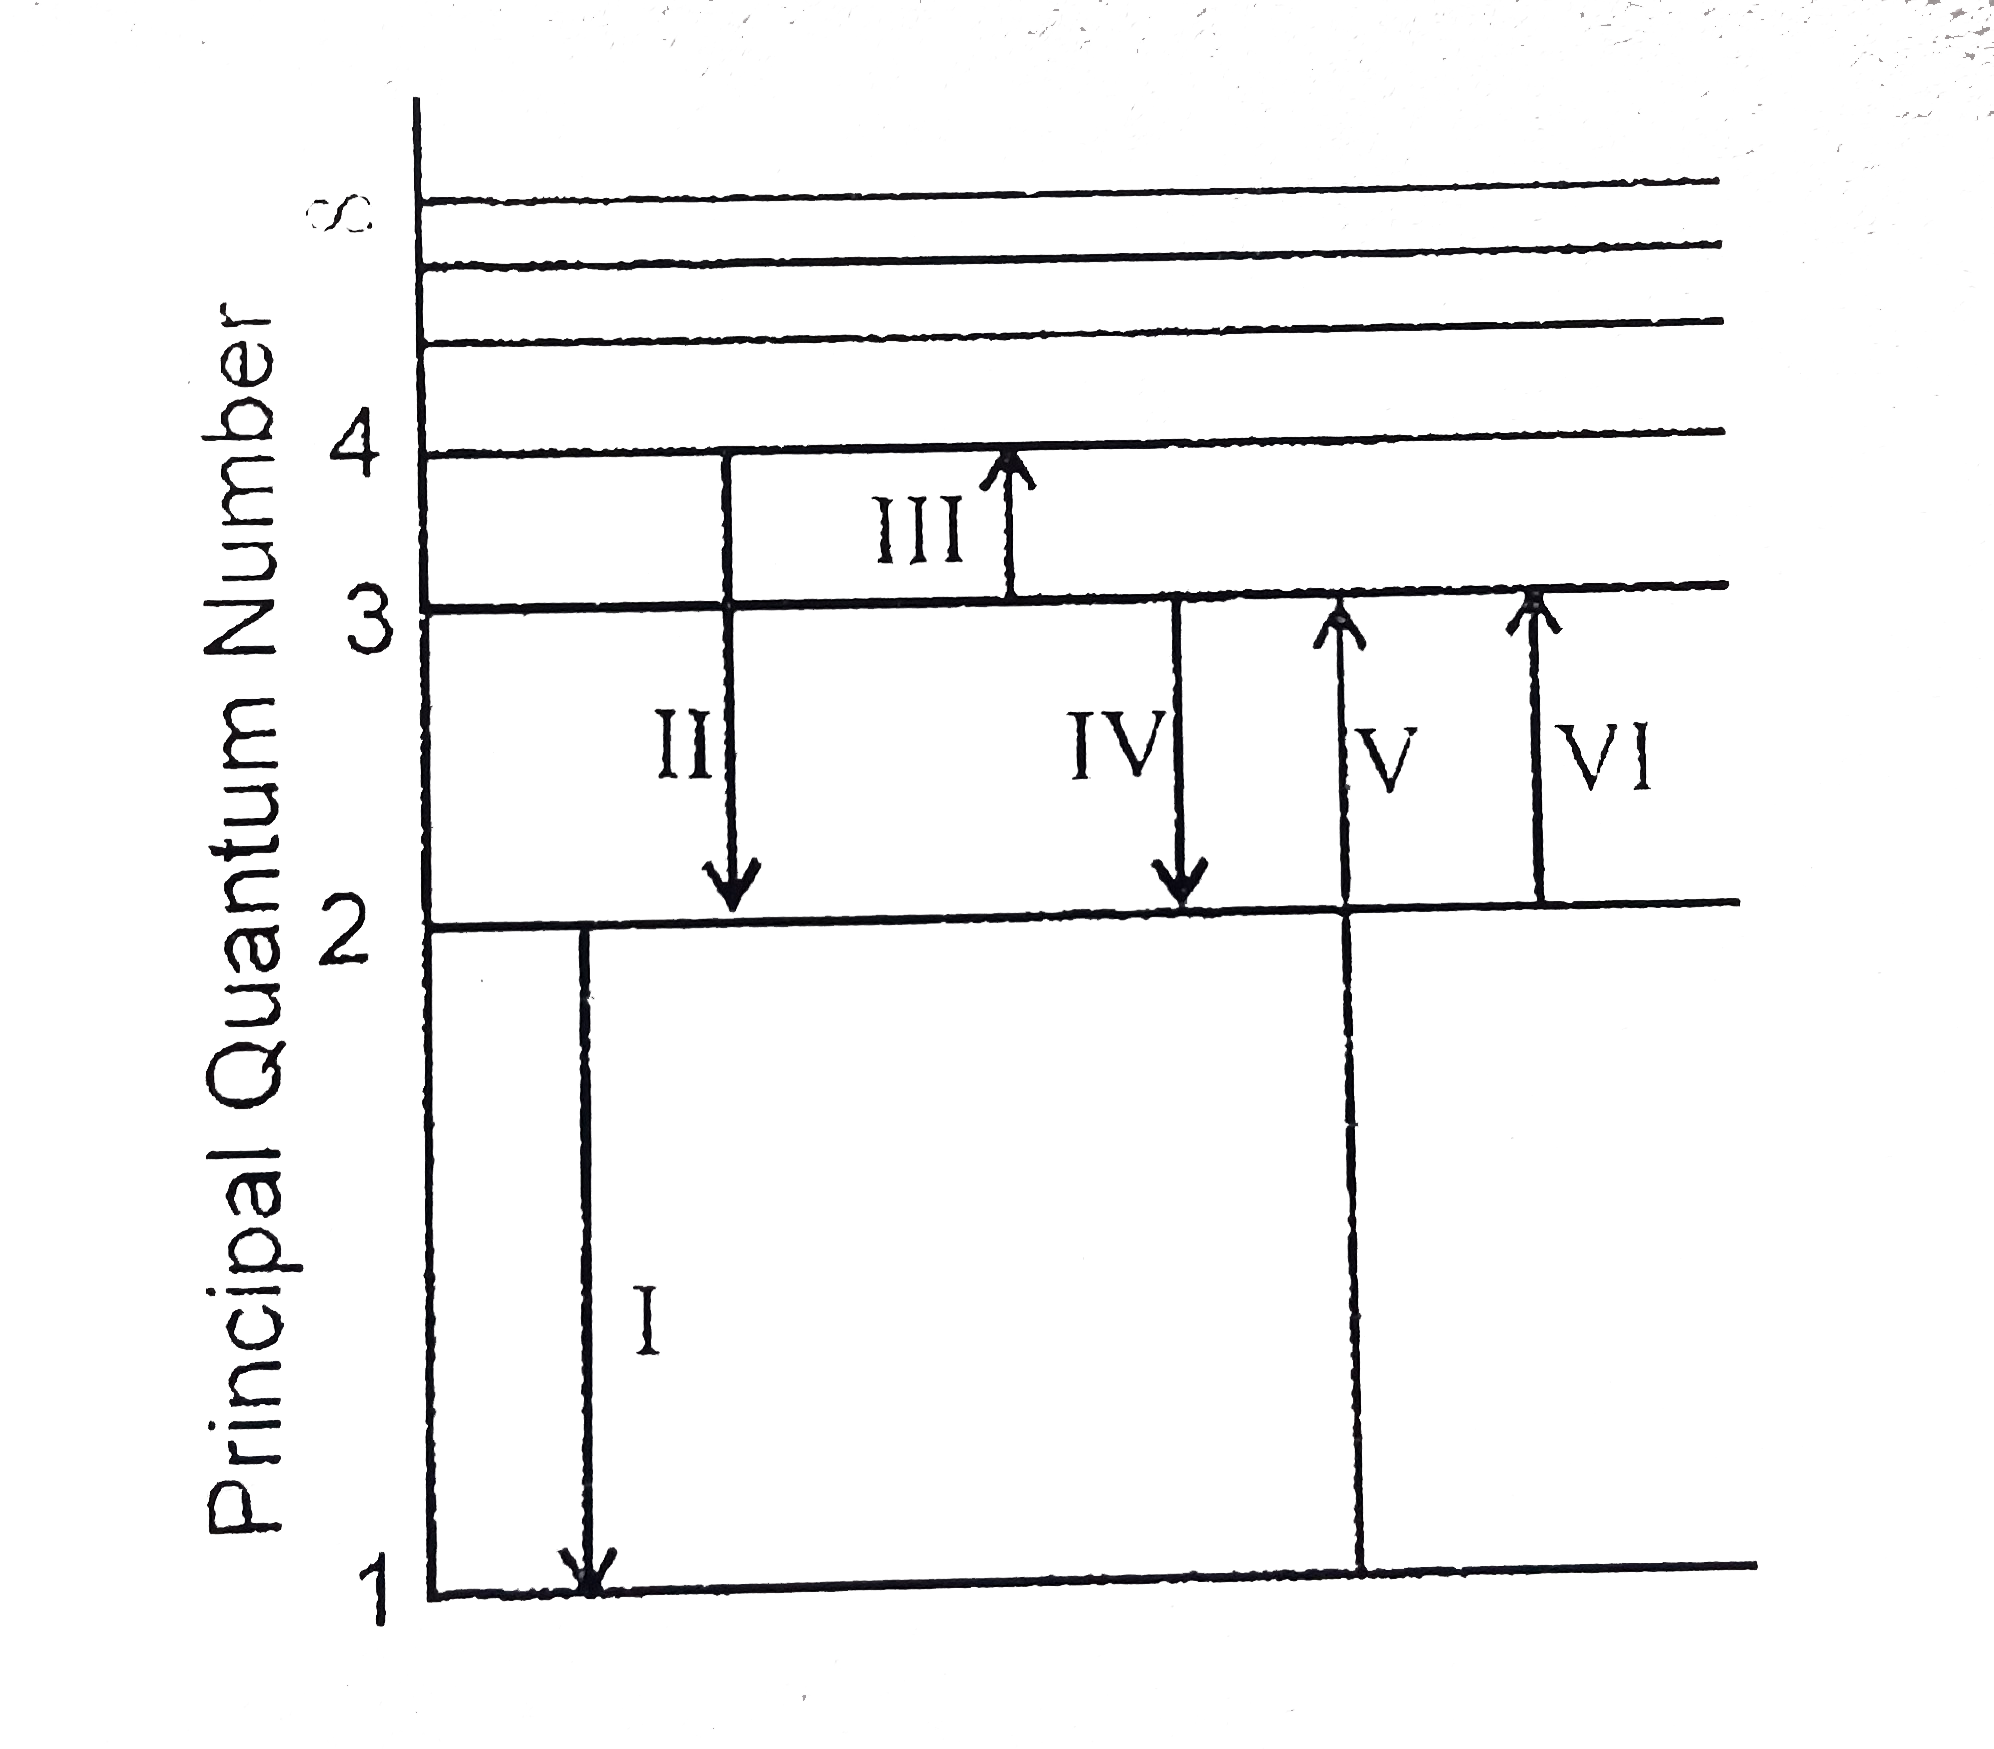
View SolutionThe figure shows an energy level diagram for the hydrogen atom. Several transitions are marked as I, II, III,_____. The diagram is only indicative and not be scale.

Which transition will occur when a hydrogen atom is irradiated with radiation of wavelength 103nm.
View Solution
Knowledge Check
The figure shows an energy level diagram for the hydrogen atom. Several transitions are marked as I,II,III ,______, the diagram is only indicative and not to scale.
_E01_150_Q01.png) .
.
Which transition involves the longest wavelength line in the visible portion of the hydrogen spectrumAIIBIIICVIDIVThe figure shows an energy level diagram for the hydrogen atom. Several transitions are marked as I, II, III,_____. The diagram is only indicative and not be scale.

Which transition will occur when a hydrogen atom is irradiated with radiation of wavelength 103nm.AIBIICIVDVThe figure shows an energy level diagram for the hydrogen atom. Several transition are marked as I, II, III, …………. The diagram is only indicative and not to scale.
 AThe transition in which a Balmer series photon absorbed is VIBThe wavelength of the radiation involved in transition II is 486 nmCIV transition will occur when a hydrogen atom is irradiated with radiation of wavelength 103nmDIV transition will emit the longest wavelength line in the visible portion of the hydrogen spectrum
The figure shows an energy level diagram for the hydrogen atom. Several transitions are marked as I, II, III,_____. The diagram is only indicative and not be scale.

Which transition will occur when a hydrogen atom is irradiated with radiation of wavelength 103nm.
View SolutionThe figure shows an energy level diagram for the hydrogen atom. Several transitions are marked as I, II, III,_____. The diagram is only indicative and not be scale.

In which transitions is a Balmer photn absorbed?
View SolutionDraw energy level diagram for Balmer series for transition between eriergy levels.
View SolutionDraw the energy level diagram for the hydrogen atom, neatly labelled and showing the transitions which give rise to the first five series of spectral lines for hydrogen.
View SolutionThe figure shows an energy level diagram for the hydrogen atom. Several transitions are marked as I, II, III,_____. The diagram is only indicative and not be scale.

In which transitions is a Balmer photn absorbed?
View Solution
