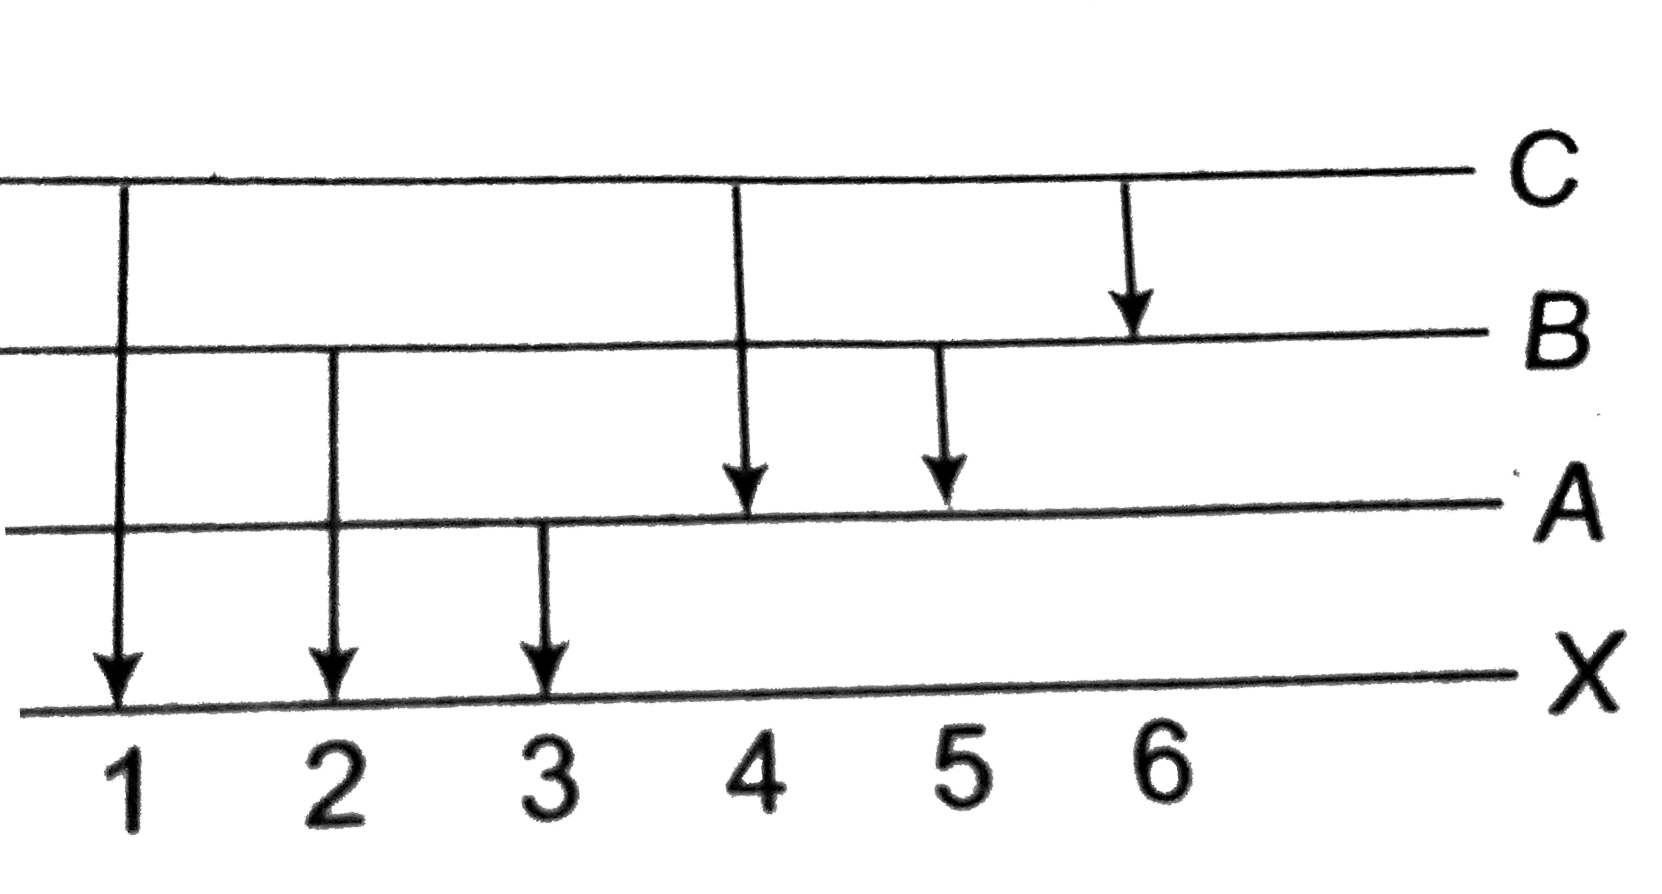
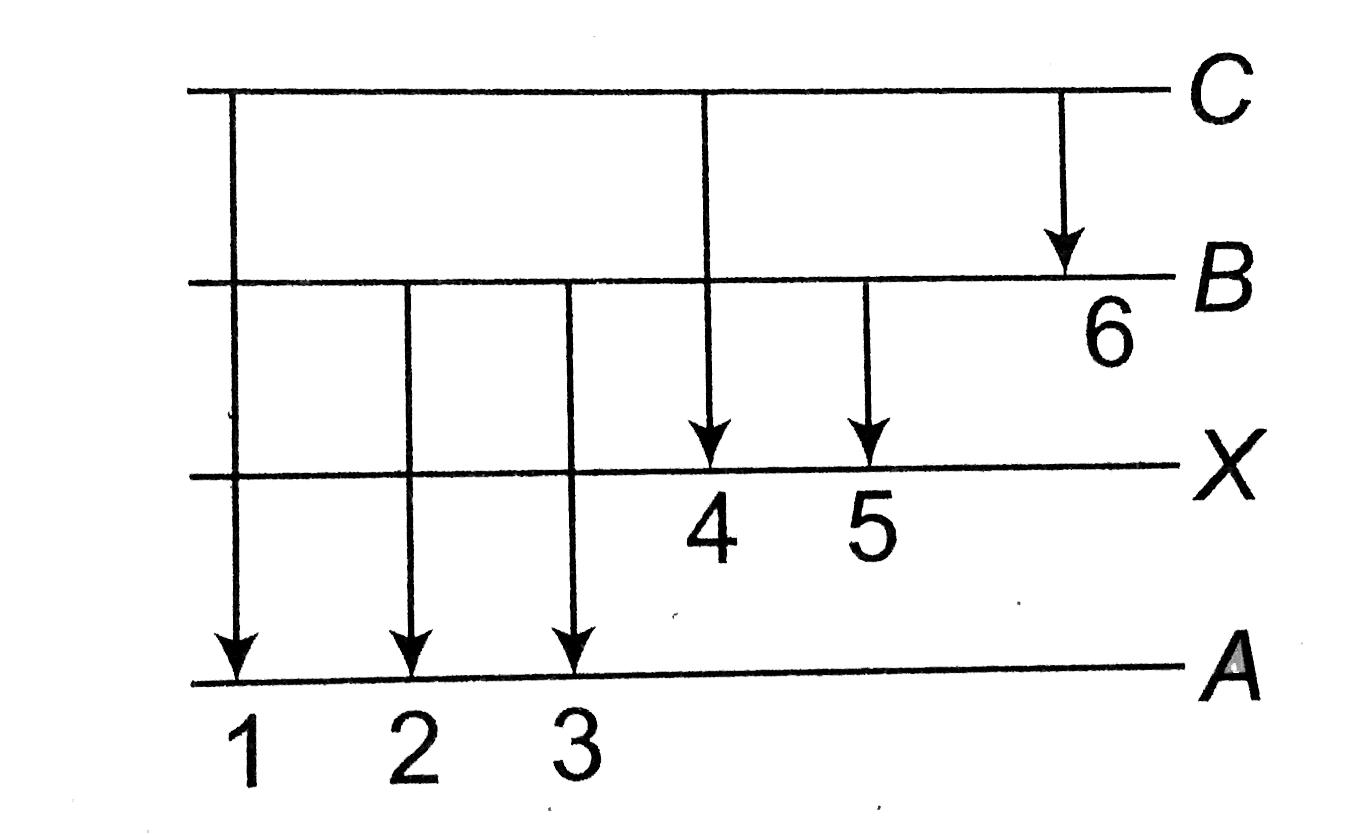
The figure indicates the energy level diagram of an atom and the origin of six spectral line in the emission spectrum. (e.g. line no. 5 arises from the transition from level B to A.) Which spectral lines will occur in the absorption spectrum ?

1,2,3,4,5,6
1,2,3
1,4,6
4,5,6
The correct Answer is:B
When an electron goes from the ground stat level (X or G ) corresponding to n =1, to a higher energy state, absorption lines are obtained . In this case we will get 3 absorption lies, 1,2,3 for the transitions , X→C,X→BandX→A .
Topper's Solved these Questions
Similar Questions
The figure indicates the enegry level diagram of an atom and the origin of six spectral lines in emission (e.g. line no.5 series from the transition from level B to A). The following spectral lines will also occur in the absorption spectrum

View SolutionThe figure indicates the energy level diagram of an atom and the origin of six spectrsl lines in emission (e.g. Line number 5 arises from the transition from level B to A). Which of the following spectral lines will also occur in the absorption spectrum?

View Solution
Knowledge Check
The figure indicates the enegry level diagram of an atom and the origin of six spectral lines in emission (e.g. line no.5 series from the transition from level B to A). The following spectral lines will also occur in the absorption spectrum
 A1,4,6B4,5,6C1,2,3D1,2,3,4,5,6
Values of n1 and n2 for Hb spectral line in the hydrogen emission spectrum
A1 and 2B2 and 3C3 and 2D2 and 4In the figure six lines of emission spectrum are shown. Which of them will be absent in the absorption spectrum.
 A1,2,3B1,4,6C4,5,6D1,2,3,4,5,6
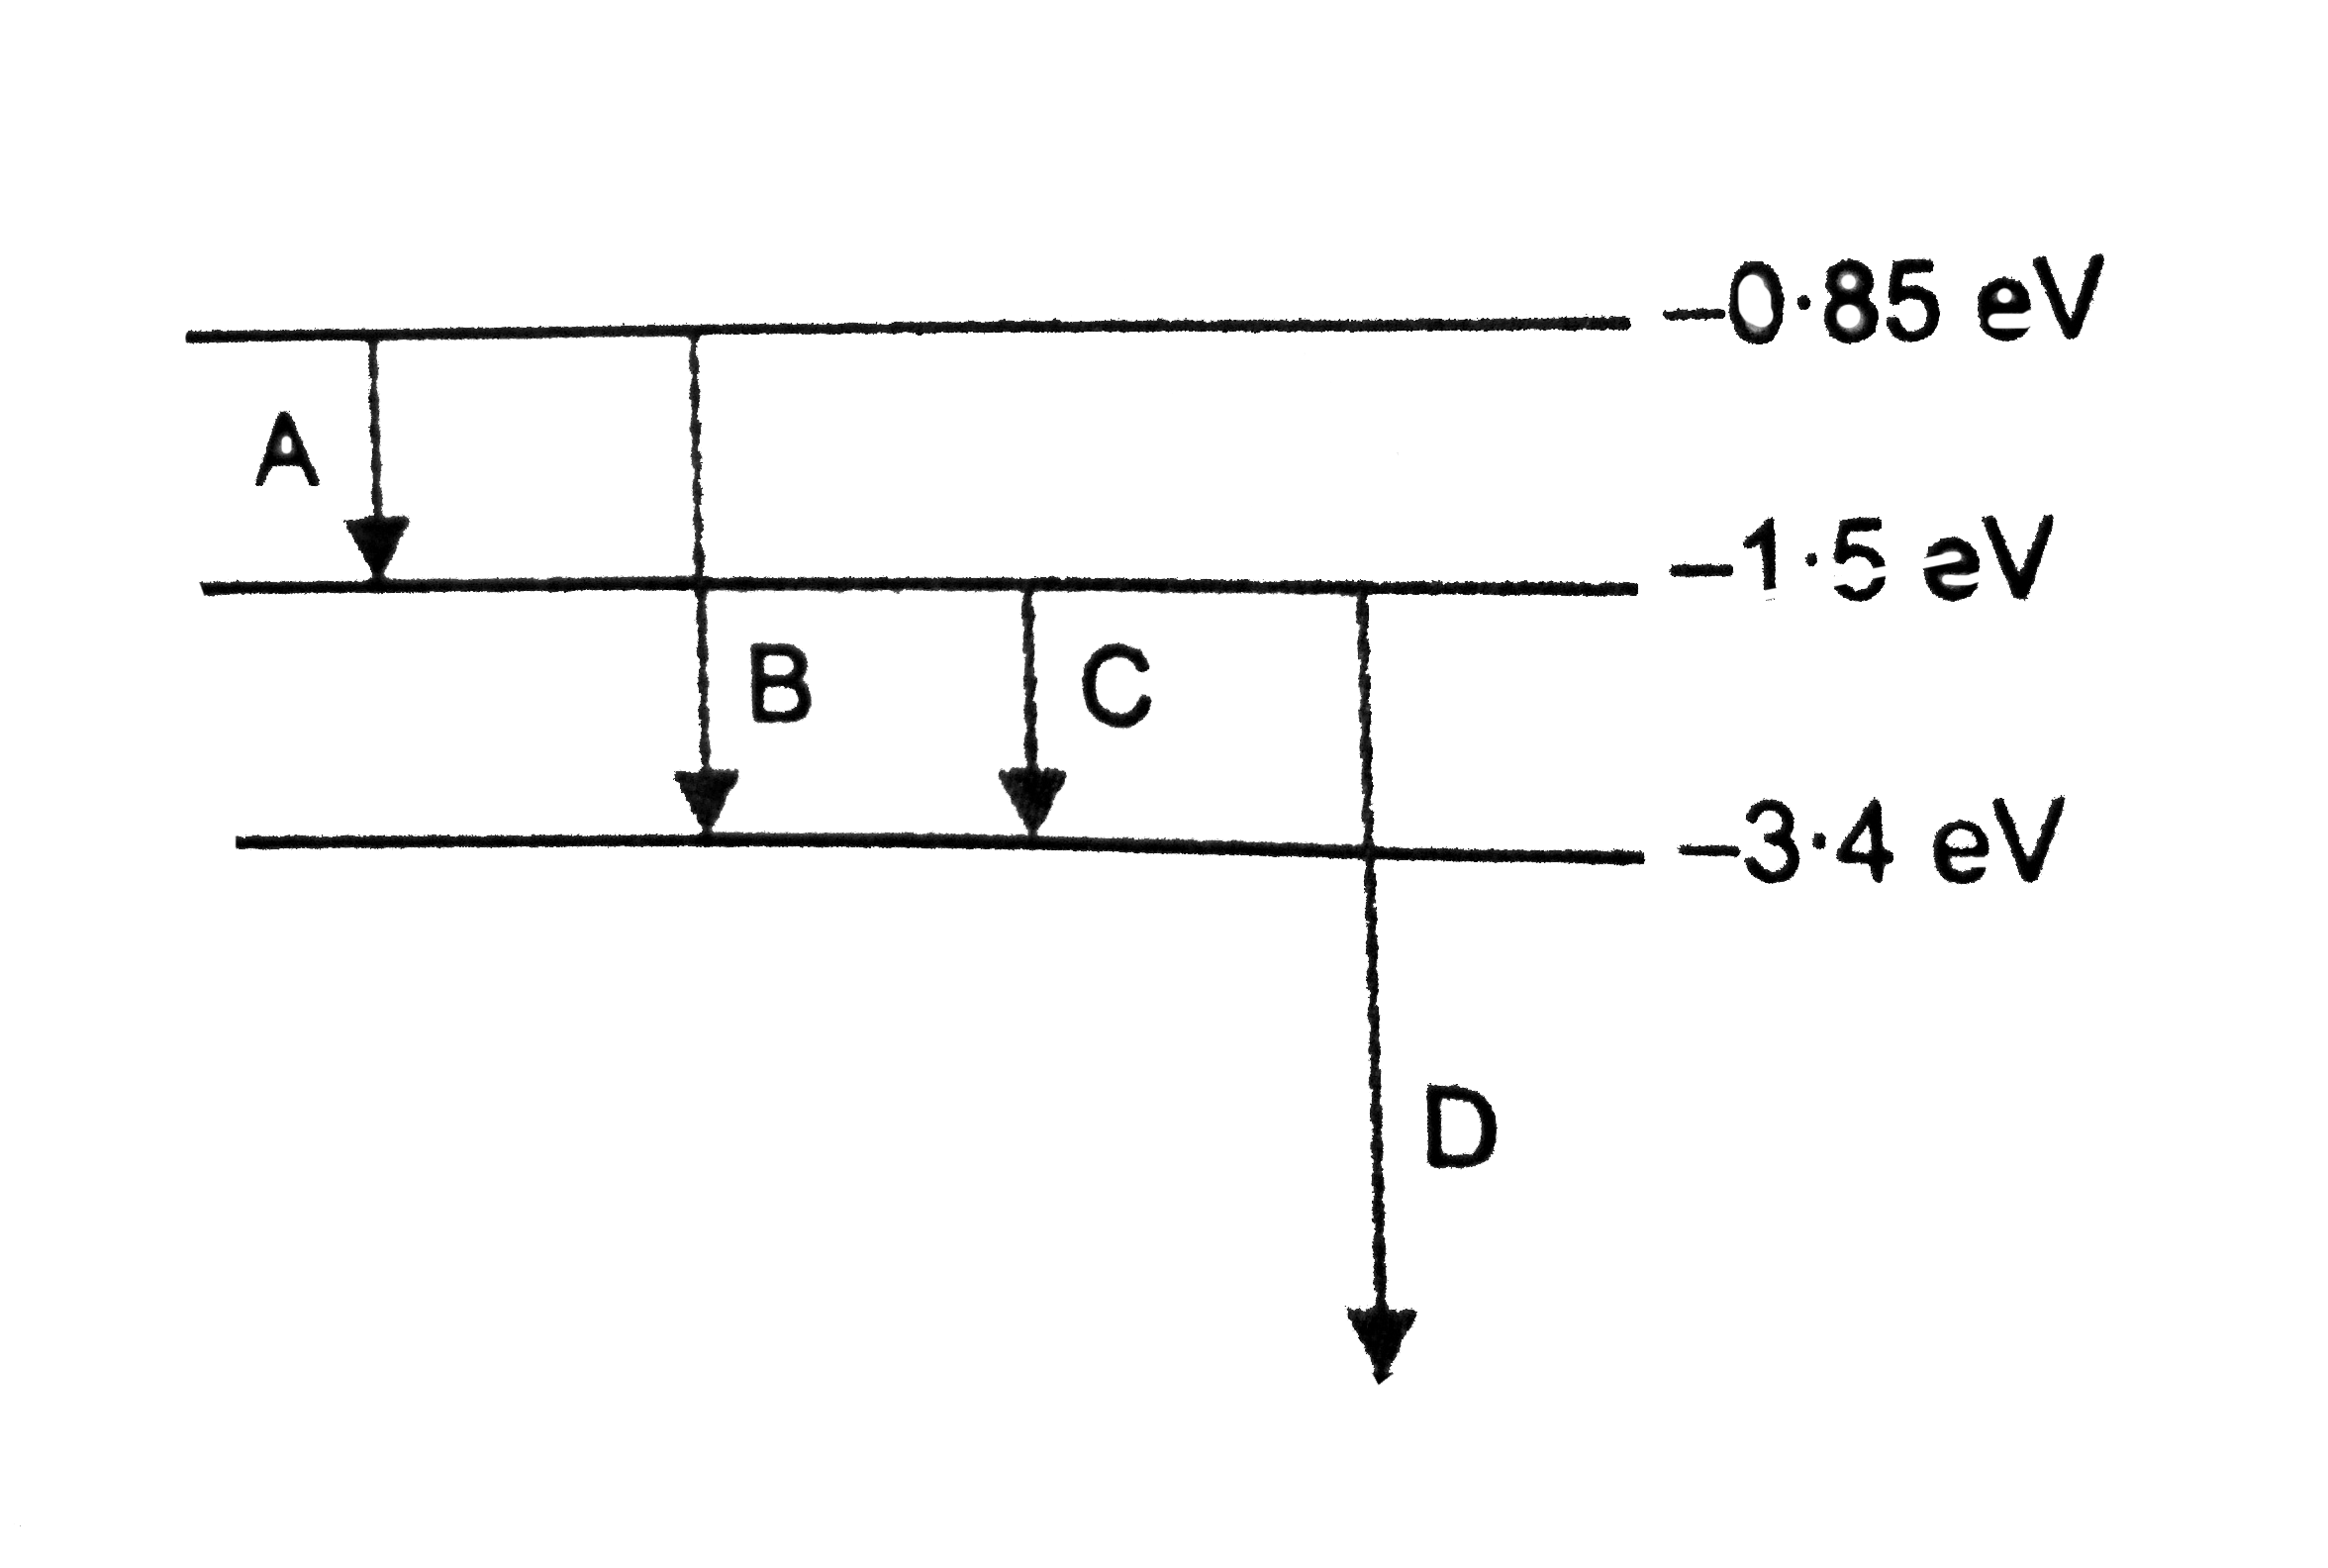
The energy level diagram of an element is given here. Which transition corresponds to the emission of a spectral line of wavelength 102.7nm?

View SolutionDraw energy level diagram for hydrogen atom and show the various line spectra originating due to transition between energy levels.
View SolutionThe shortest wavelength spectral line in the brackett series of the spectrum of atomic hydrogen is the transition :
View SolutionIn a sample of H like atoms highest quantum state is n = 6. Find total number of spectral lines in emission spectrum
View SolutionThe shortest wavelength spectral line in the brackett series of the spectrum of atomic hydrogen is the transition :
View Solution
