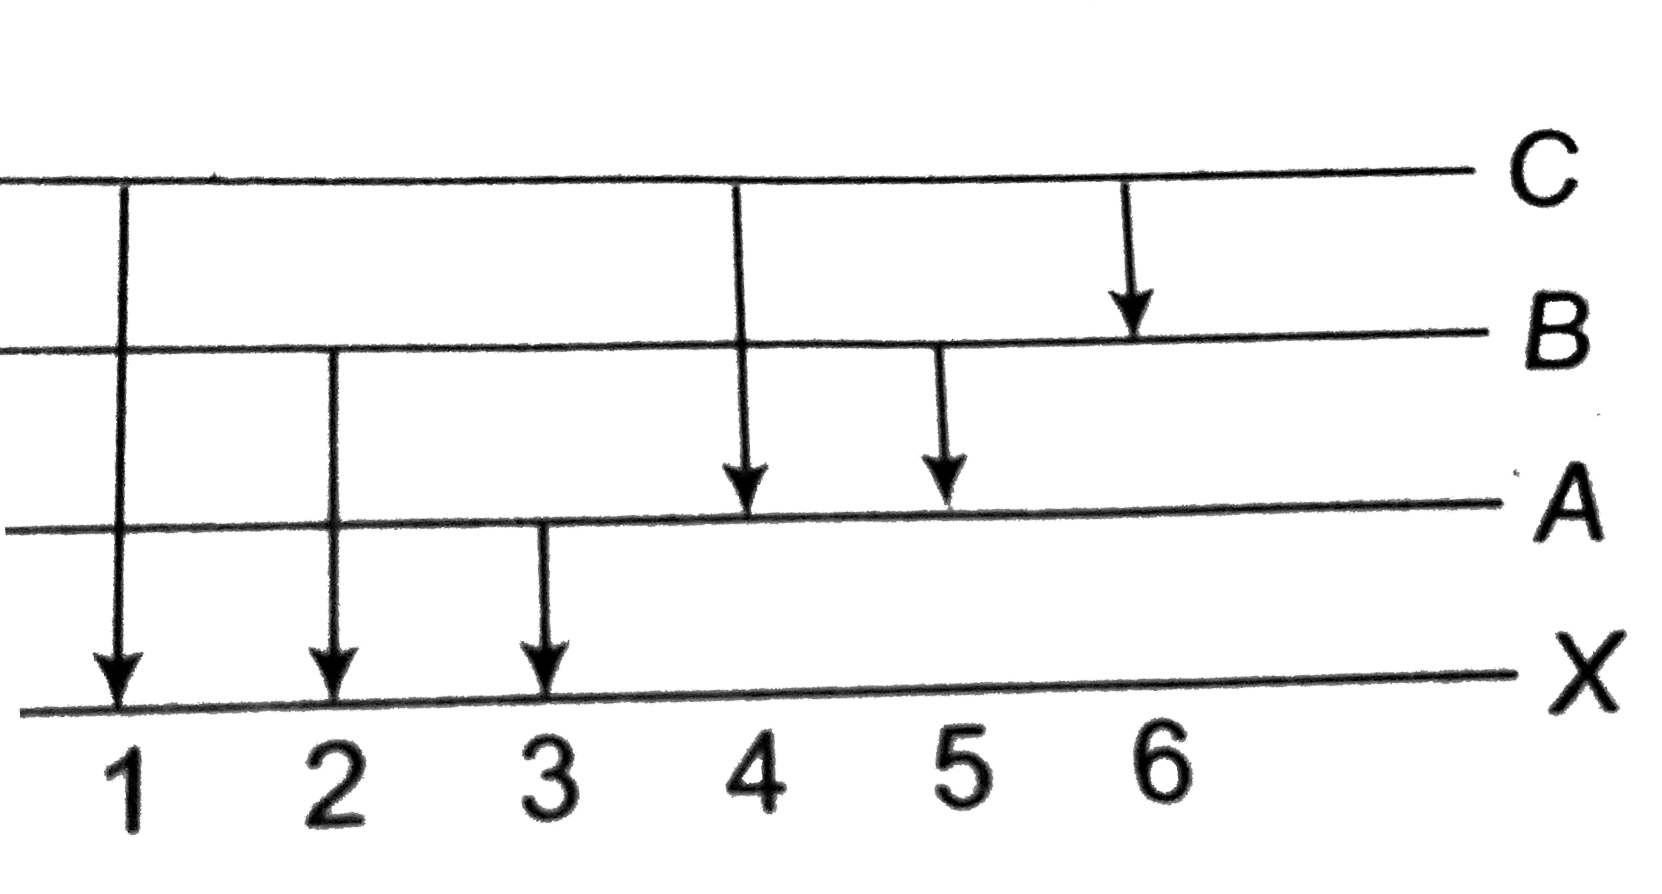
The figure indicates the enegry level diagram of an atom and the origin of six spectral lines in emission (e.g. line no.5 series from the transition from level B to A). The following spectral lines will also occur in the absorption spectrum

1,4,6
4,5,6
1,2,3
1,2,3,4,5,6
The correct Answer is:C
Step by step video & image solution for The figure indicates the enegry level diagram of an atom and the origin of six spectral lines in emission (e.g. line no.5 series from the transition from level B to A). The following spectral lines will also occur in the absorption spectrum by Physics experts to help you in doubts & scoring excellent marks in Class 12 exams.
Updated on:21/07/2023Topper's Solved these Questions
- ATOMIC PHYSICSBOOK - CENGAGE PHYSICS ENGLISHCHAPTER - ATOMIC PHYSICSEXERCISE - ddp.4.3
15 Videos
- ATOMIC PHYSICSBOOK - CENGAGE PHYSICS ENGLISHCHAPTER - ATOMIC PHYSICSEXERCISE - dpp-4.1
15 Videos
- ALTERNATING CURRENTBOOK - CENGAGE PHYSICS ENGLISHCHAPTER - ALTERNATING CURRENTEXERCISE - Single Correct
10 Videos
- CAPACITOR AND CAPACITANCEBOOK - CENGAGE PHYSICS ENGLISHCHAPTER - CAPACITOR AND CAPACITANCEEXERCISE - Integer
5 Videos
Similar Questions
The figure indicates the energy level diagram of an atom and the origin of six spectrsl lines in emission (e.g. Line number 5 arises from the transition from level B to A). Which of the following spectral lines will also occur in the absorption spectrum?

View SolutionDraw the energy level diagram of hydrogen atom and show the transitions responsible for :
(i) absorption lines of Lyman series.
(ii) emission lines of Balmer series.
View Solution
Knowledge Check
The third line of the Balmer series, in the emission spectrum of the hydrogen atom, is due to the transition from the
Afourth Bohr orbit to the first Bohr orbitBfifth Bohr orbit to the second Bohr orbitCsixth Bohr orbit to the third Bohr orbitDseventh Bohr orbit to the third Bohr orbit.
The third line of the Balmer series, in the emission spectrum of the hydrogen atom, is due to the transition from the
View SolutionWhat will be the number of spectral lines in infrared region when electron transition occur from n=7 to n=2 in hydrogen atom :
View SolutionThe wavelength of the spectral line when the electron is the hydrogen atom undergoes a transition from the energy level 4 to energy level 2 is.
View SolutionThe number of spectral lines obtain in Bohr spectrum of hydrogen atom when an electron is excited from ground level to 5th orbit is
View SolutionThe wavelength of spectral line in Lyman series for electron jumping back from 2nd orbit is
View SolutionNumber of spectral lines orbitals in Bohr spectrum of hydrogen atom when an electron is excited from ground level is 5th orbit is
View SolutionIn the atomic spectrum of hydrogen, the spectral lines pertaining to electronic transition of n = 4 to n = 2 refers to
View Solution
