The figure shows the variation of photoelectric current (I) with potential (V) for a photo-sensitive surface for two radiations of frequencies va and vb for the curves a and b respectively. From the graph we find that

va=vb
va>vb
va<vb
va=√2vb
The correct Answer is:A
For the photo-sensitive surface, Emax=eV0=hv−W0
Since both radiations have the same stopping potential
V0,hva−W0=hvb−W0 ...(1)
But the work function W0 of the surface has only one value W0
∴ From(1), hva=hvb or va=vb
Topper's Solved these Questions
- ELECTRONS AND PHOTONS BOOK - MARVEL PUBLICATIONCHAPTER - ELECTRONS AND PHOTONS EXERCISE - TEST YOUR GRASP - 17
15 Videos
- ELECTROMAGNETIC INDUCTION AND ALTERNATING CURRENTS BOOK - MARVEL PUBLICATIONCHAPTER - ELECTROMAGNETIC INDUCTION AND ALTERNATING CURRENTS EXERCISE - TEST YOUR GRASP - 16
30 Videos
- ELECTROSTATICSBOOK - MARVEL PUBLICATIONCHAPTER - ELECTROSTATICSEXERCISE - TEST YOUR GRASP
20 Videos
Similar Questions
The graph of Fig. shows the variation of photoelectric current (I) versus applied voltage (V) for the two different photosensitive materials for two different intensities of the incident radiation. Identify the pairs of curves that correspond to different materials but same intensity of incident radiation.
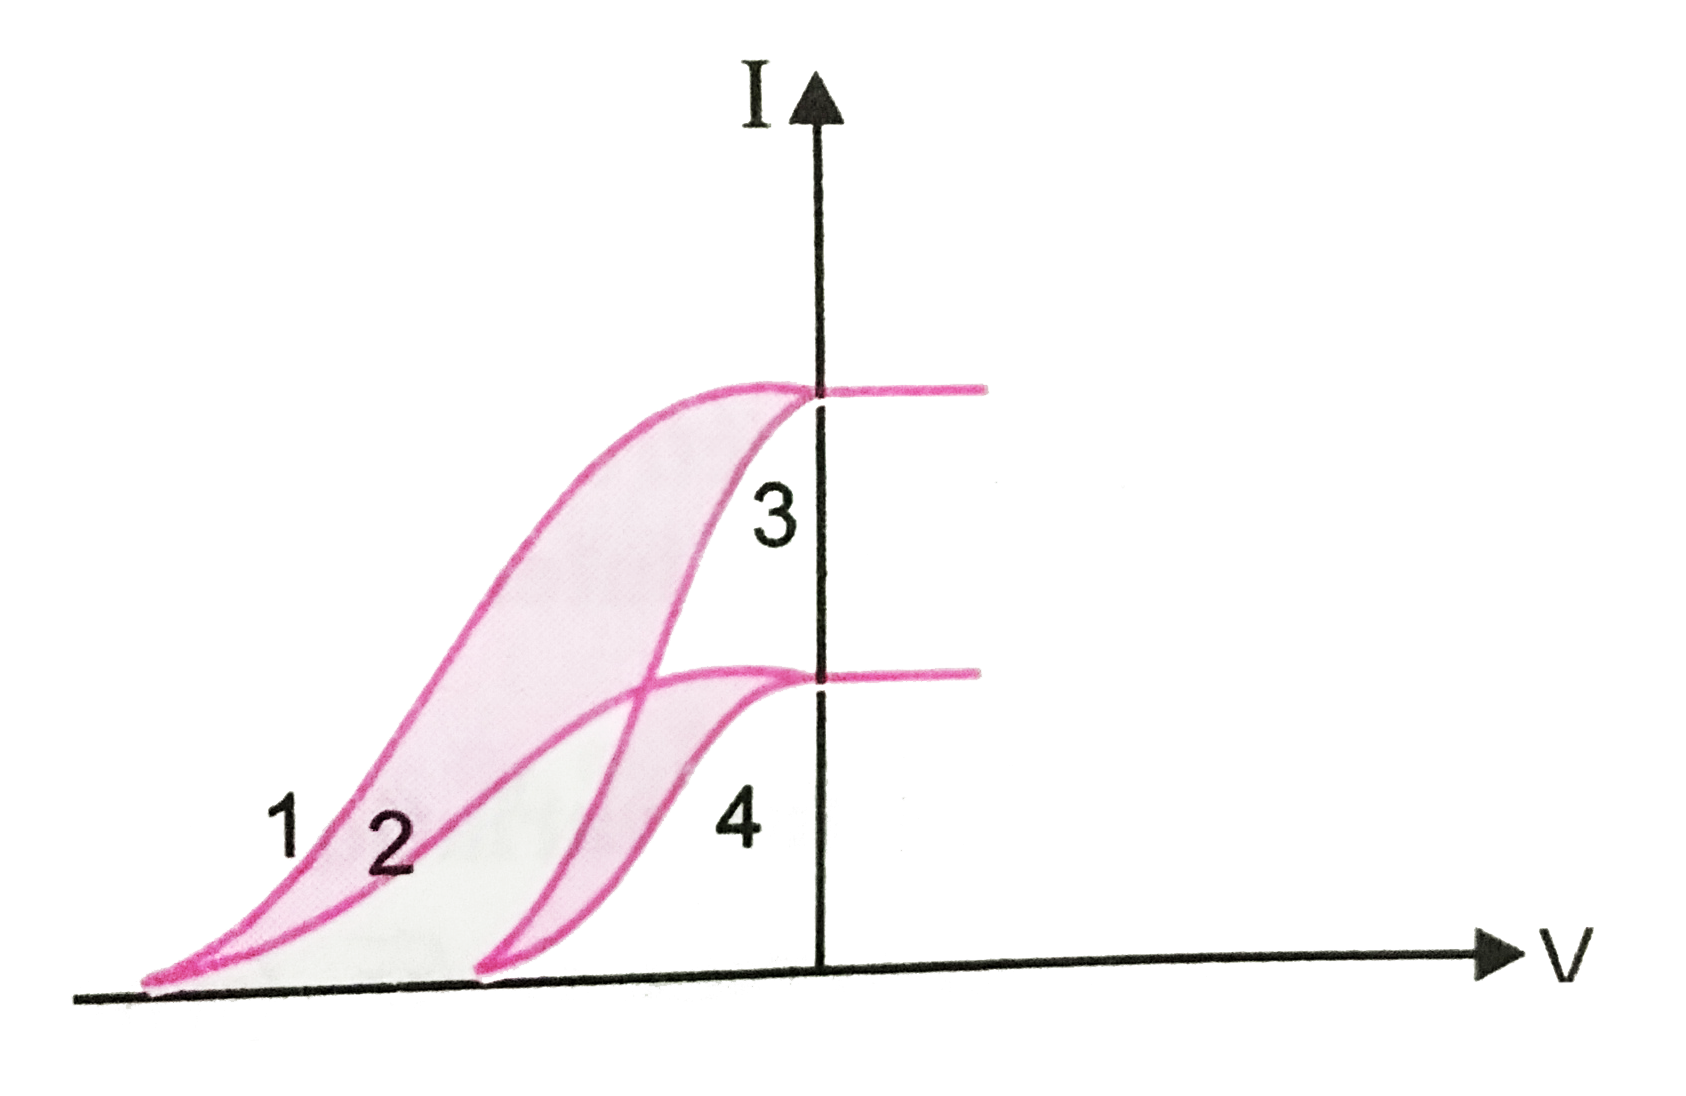
View SolutionThe graph of Fig. shows the variation of photoelectric current (I) versus applied voltage (V) for the two different photosensitive materials for two different intensities of the incident radiation. Identify the pairs of curves that correspond to different materials but same intensity of incident radiation.

View Solution
Knowledge Check
The fig. shows the variation of photon current with anode potential for a photo-sensitive surface for three different radiation. Let Ia,IbandIc be the intensities and fa,fbandfc be the frequency for the curves a,b and c respectively.
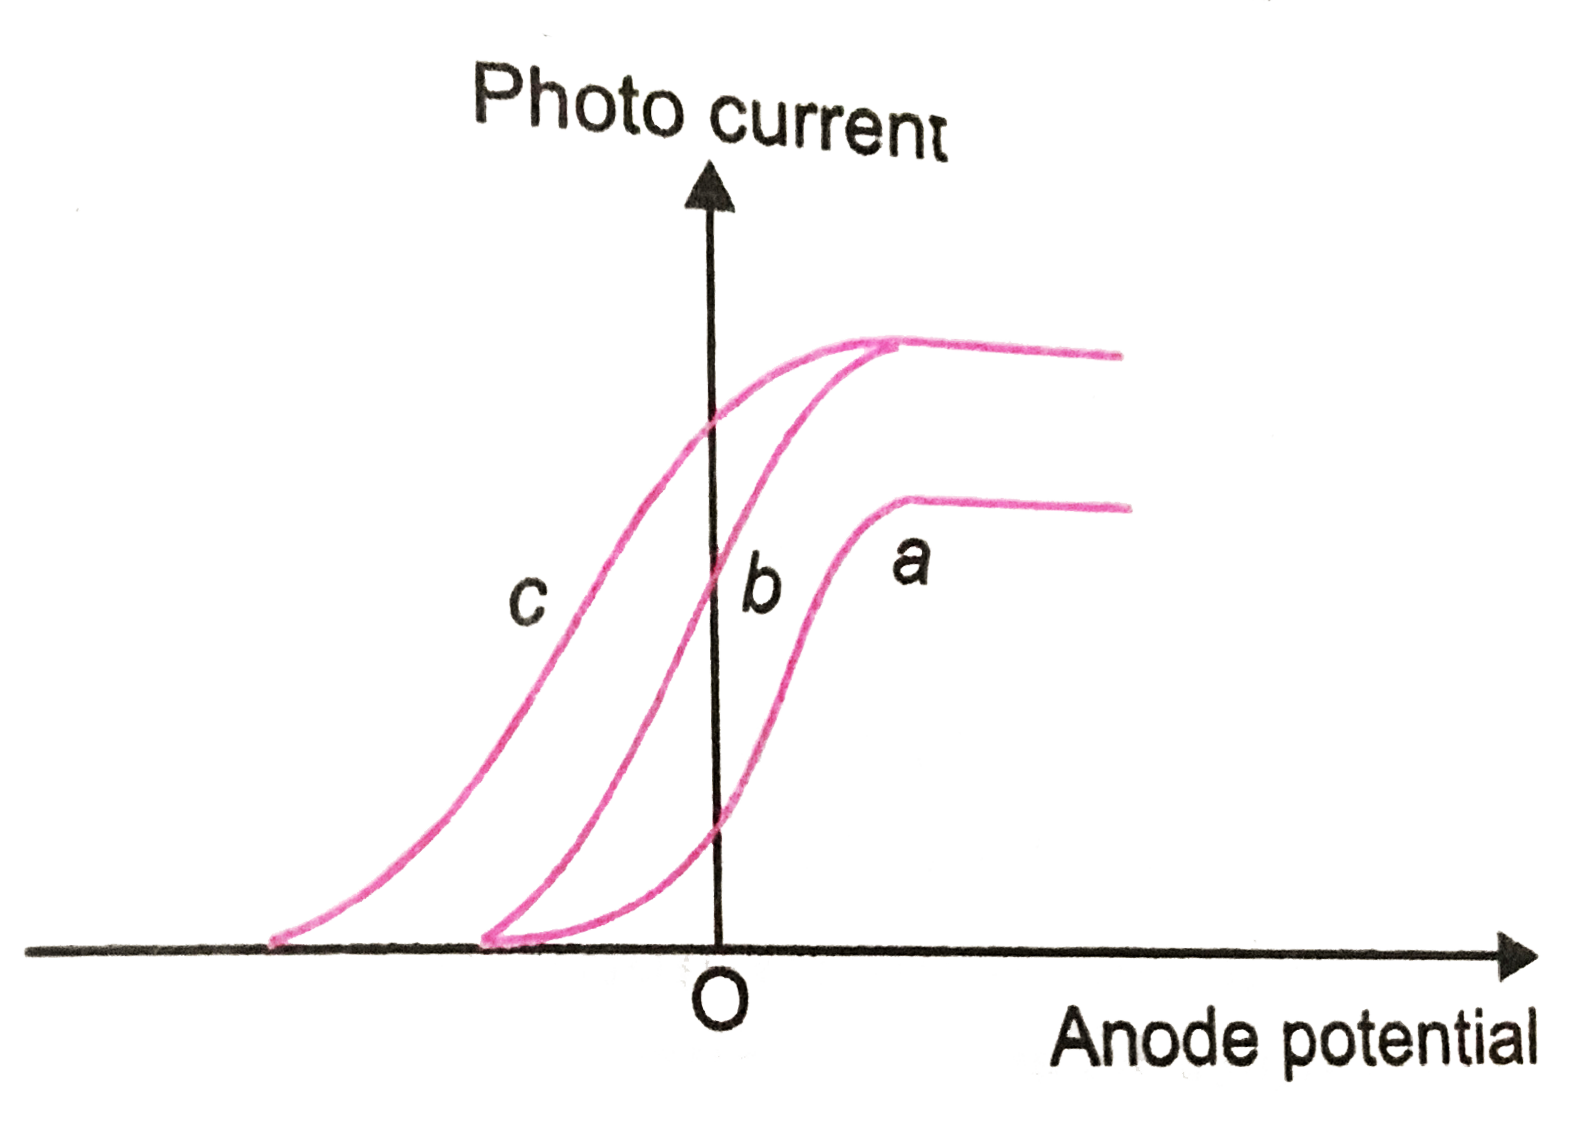 Ava=vbandIa≠IbBva=vcandIa=IcCva=vbandIa=IbDvb=vcandIb=Ic
The fig. shows the variation of photon current with anode potential for a photo-sensitive surface for three different radiation. Let Ia,IbandIc be the intensities and fa,fbandfc be the frequency for the curves a,b and c respectively.
 Afa=fbandIa≠IbBfa=fcandIa=IcCfa=fbandIa=IbDfb=fcandIb=Ic
Which one of the following graphs in figure shows the variation of photoelectric current (I) with voltage (V) between the electrodes in a photoelectric cell?
A B
B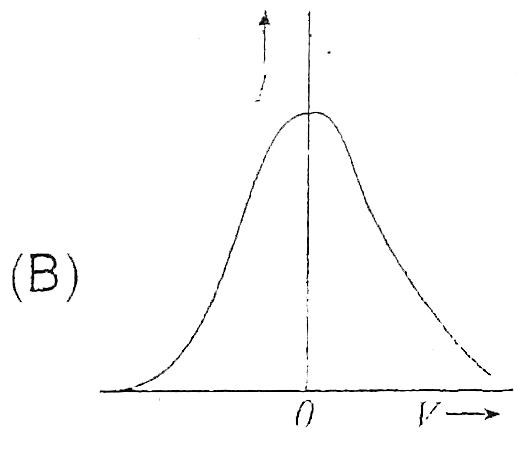 C
C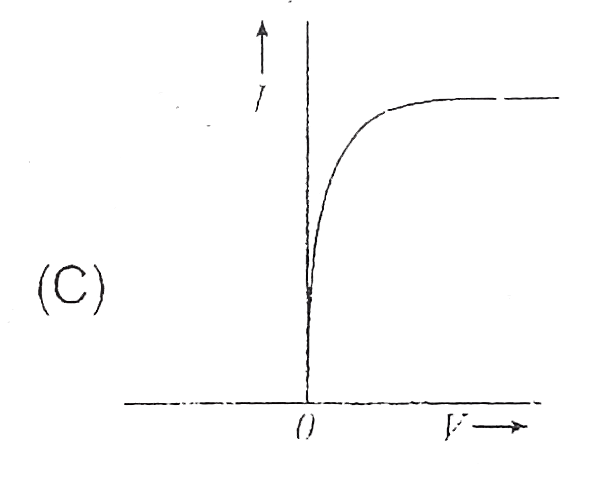 D
D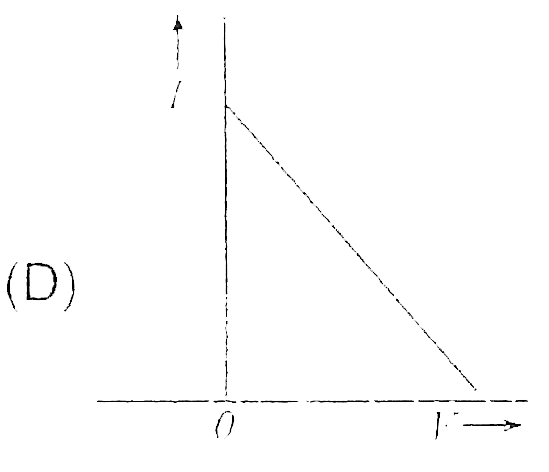
Draw a plot showing the variation of photoelectric current with collector plate potential for two different frequencies, v1>v2, of incident radiation having the same intensity. In which case will the stopping potential be higher ? Justify your answer.
View SolutionDraw a plot showing the variation of photoelectric current with collector plate potential for two different frequenciesv1andv2(v1>v2) of incident radiation having the same intensity. In which case will the stopping potential be higher? Justify your answer.
View SolutionWhich one of the following graphs in figure shows the variation of photoelectric current (I) with voltage (V) between the electrodes in a photoelectric cell?
View SolutionDraw graphs showing variation of photoelectric current with applied voltage for three incident radiations of equal frequency and different intensities. Mark the graph for the radiation of higher intensity.
View SolutionThe curve between current (i) and potential difference (V) for a photo cell will be
View Solution
