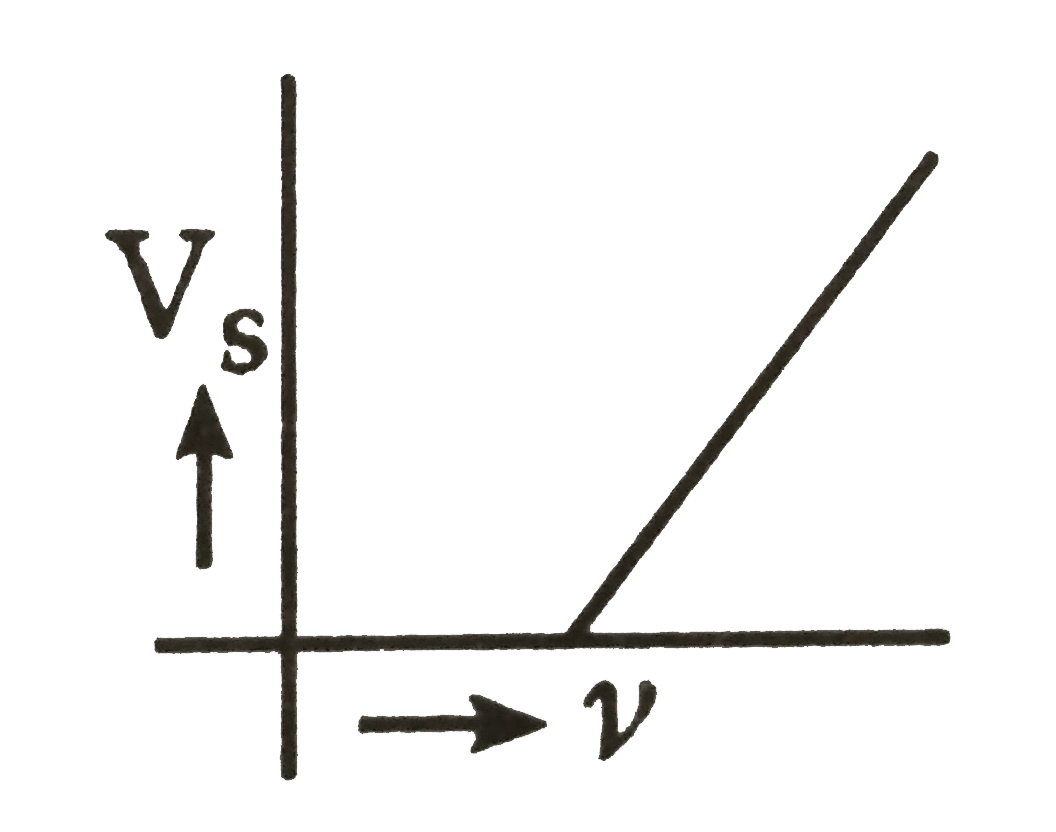
In a photoelectric experiment, the reciprocal of the slope of the straight line graph giving the relation between the stopping potential and the frequency of incident radiation gives
h
e
he
eh
The correct Answer is:D
slope =he∴ Reciprocal of slope =eh
Topper's Solved these Questions
- ELECTRONS AND PHOTONS Book:MARVEL PUBLICATIONChapter:ELECTRONS AND PHOTONS Exercise:TEST YOUR GRASP - 17
Explore 15 Videos
- ELECTROMAGNETIC INDUCTION AND ALTERNATING CURRENTS Book:MARVEL PUBLICATIONChapter:ELECTROMAGNETIC INDUCTION AND ALTERNATING CURRENTS Exercise:TEST YOUR GRASP - 16
Explore 30 Videos
- ELECTROSTATICSBook:MARVEL PUBLICATIONChapter:ELECTROSTATICSExercise:TEST YOUR GRASP
Explore 20 Videos
Similar Questions
In photoelectric effect the slope of straight line graph between stopping potential (Vs) and frequency of incident light (v) gives

View SolutionDraw and explain the graph showing the variation of stopping potential with frequency of incident radiation in relation to photoelectric effect.
View Solution
Knowledge Check
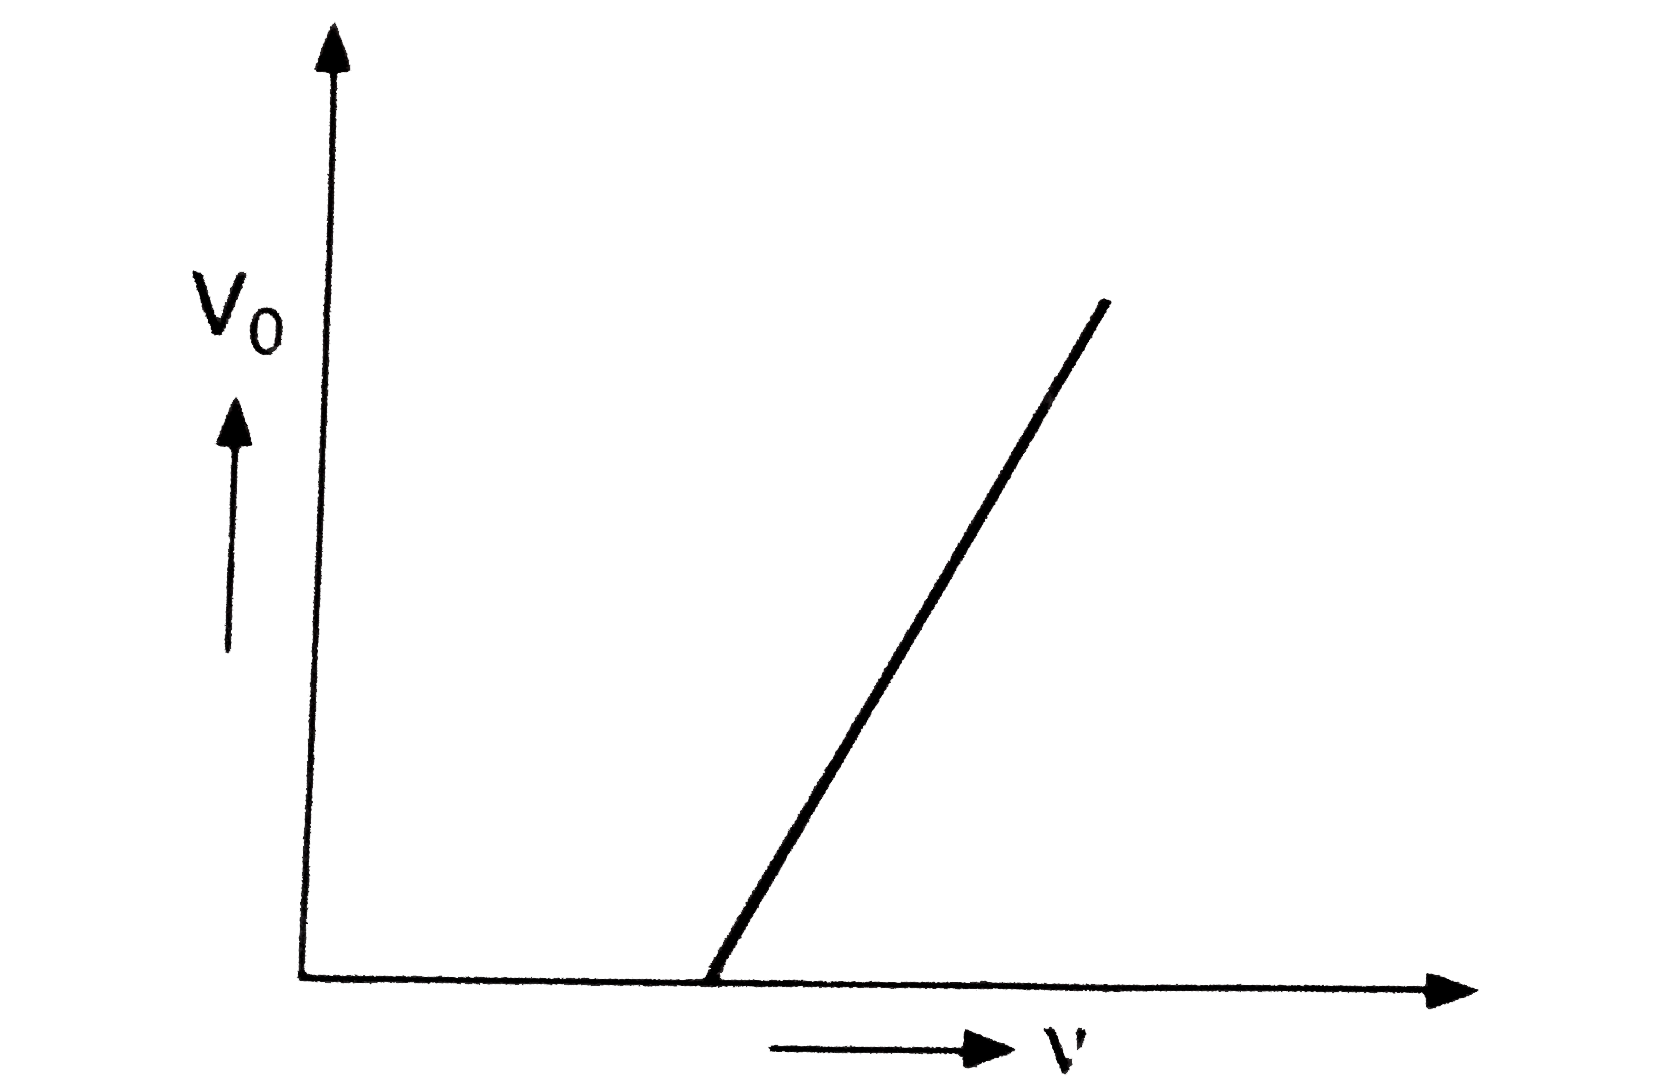
In photoelectric effect the slope of straight line graph between stopping potential (V0) and freqency of incident light (v) gives:
 Acharge on electronBwork function of emitterCPlanck's constantDratio of Planck's constant to charge on electron
In photo electric effect, the slope of the straight line graph between stopping potential and frequency of the incident light gives the ratio of Planck's constant to
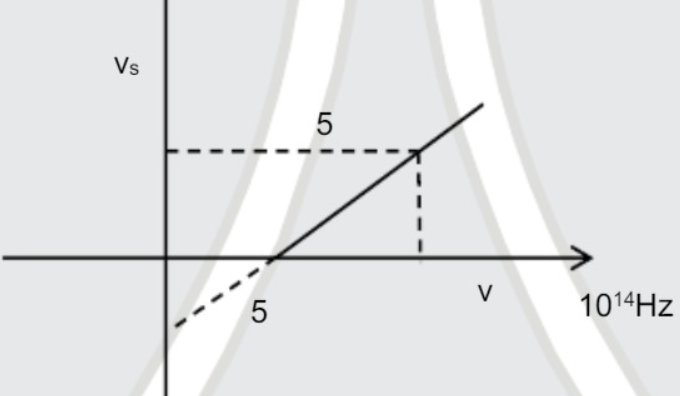
Acharge of electronBwork functionCphoto electric currentDK.E. of electronGraph between stopping potential and frequency of light as shown find the work function
 A4.01 evB2.07 evC5.01 evD2.09 ev
Define photoelectric effect. Draw a graph to show the variation of stopping potential with frequency of incident radiation on a metal plate.
View SolutionIn photoelectric effect the slope of straight line graph between stopping potential (Vs) and frequency of incident light (v) gives

View SolutionIn photoelectric effect on metals, an increase in the frequency of incident radiation increases:
View SolutionIn a photoelectric effect experiment, the slope of the graph between the stopping potential and the incident frequency will be :
View SolutionIn a photoelectric effect experiment, the slope of the graph between the stopping potential and the incident frequency will be :
View Solution
