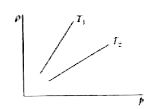
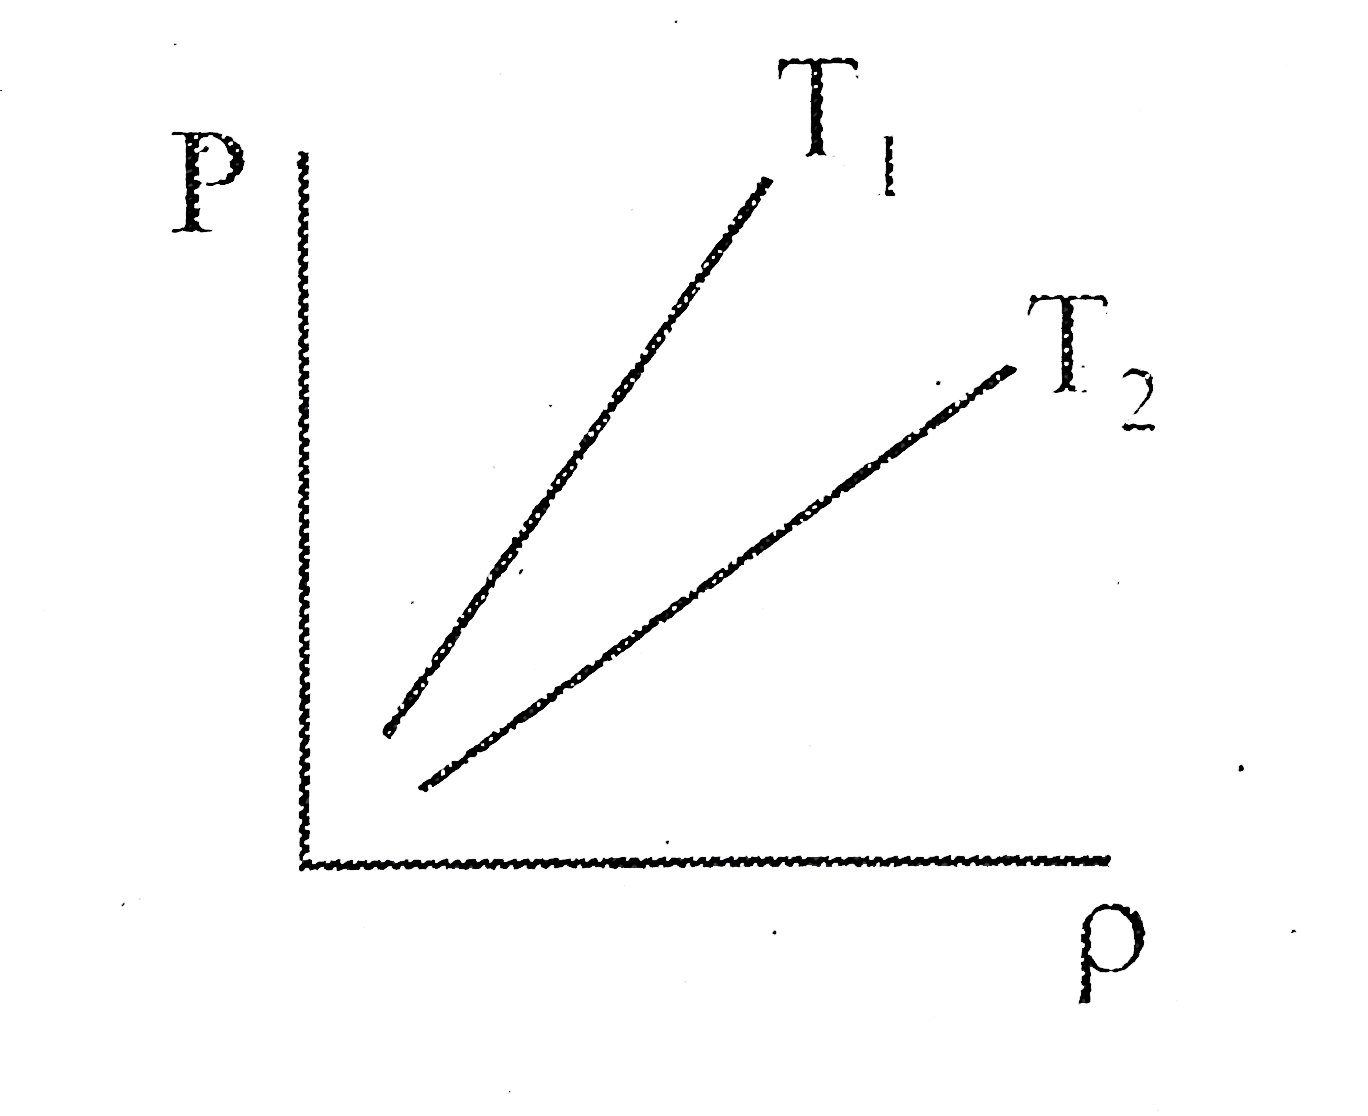
The following graph represents the pressure versus number density for ideal gas at two different temperatures T1 and T2. The graph implies 
A
T1=T2
B
T1>T2
C
T1<T2
D
Cannot be determined
Text Solution
The correct Answer is:B
T1>T2
|
Updated on:21/07/2023
Topper's Solved these Questions
- BOOK - SURA PUBLICATIONCHAPTER - KINETIC THEORY OF GASES EXERCISE - SHORT ANSWER QUESTION :22videos
KINETIC THEORY OF GASES
- BOOK - SURA PUBLICATIONCHAPTER - KINETIC THEORY OF GASES EXERCISE - LONG ANSWER QUESTION :11videos
KINETIC THEORY OF GASES
- BOOK - SURA PUBLICATIONCHAPTER - KINEMATICSEXERCISE - Creative Question (HOTS)12videos
KINEMATICS
- BOOK - SURA PUBLICATIONCHAPTER - MOTION OF SYSTEM OF PARTICLES AND RIGID BODIESEXERCISE - VALUE BASED QUESTIONS2videos
MOTION OF SYSTEM OF PARTICLES AND RIGID BODIES
Similar Questions
Knowledge Check
- Question 1 - Select One
Figure shows graphs of pressure vs density for an ideal gas at two temperatures Tt and T2
AT1>T2BT1=T2CT1<T2Dany of the three is possible - Question 2 - Select One
Shows graphs of pressure vs density for an ideal gas at two temperaturesT1andT2
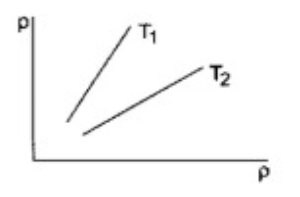 A(a)T1>T2B(b)T1=T2C(c)T1<T2D(d)Any of the three is possibe.
 - Question 3 - Select One
Figure shows graphs of pressure versus density for an ideal gas at two temperatures T1 and T2 Which is correct ?
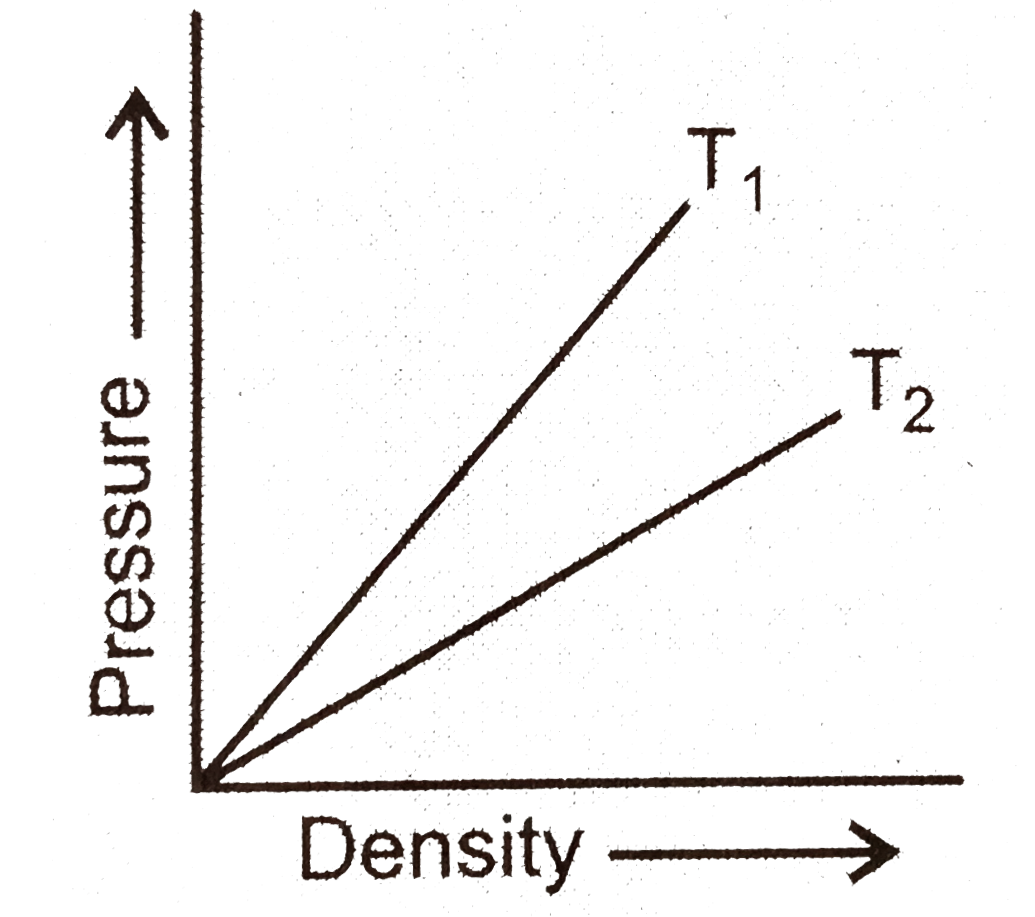 .AT1>T2BT2>T1CBothDNone of these
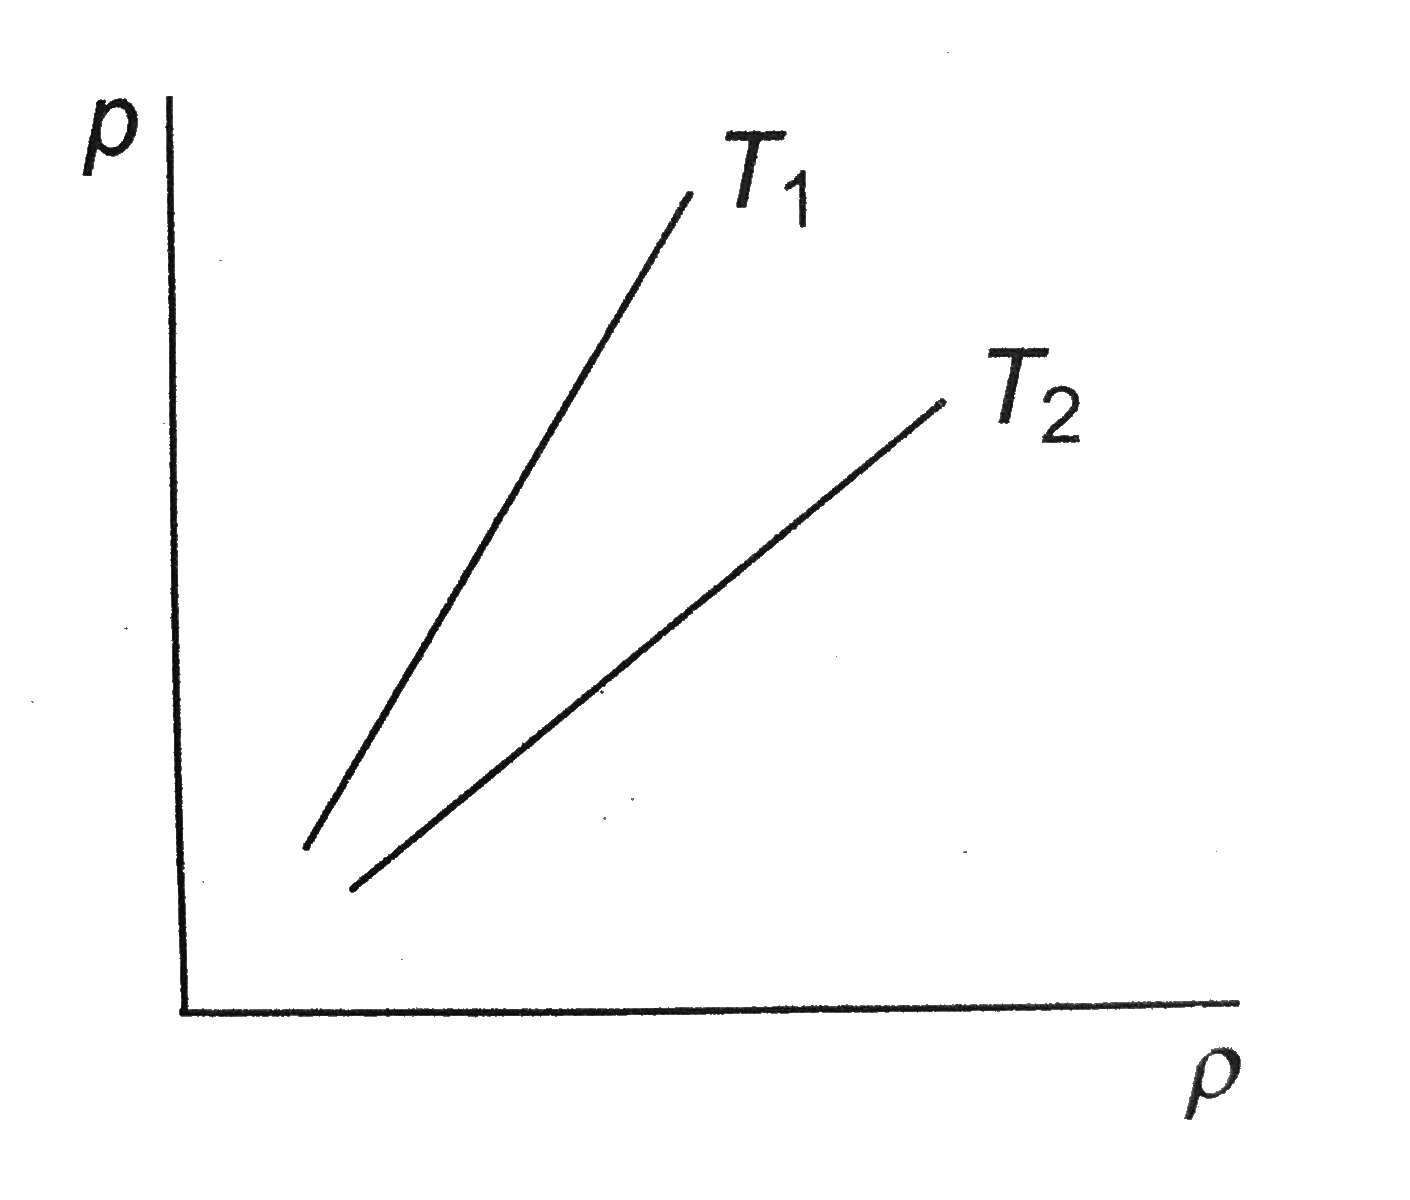
Figure shows graphs of pressure vs density for an ideal gas at two temperature T1andT2. Which of the following is correct?
 View Solution
Figure shows graphs of pressure vs density for an ideal gas at two temperature T1 and T2 . Which of the following is correct ?
 View Solution
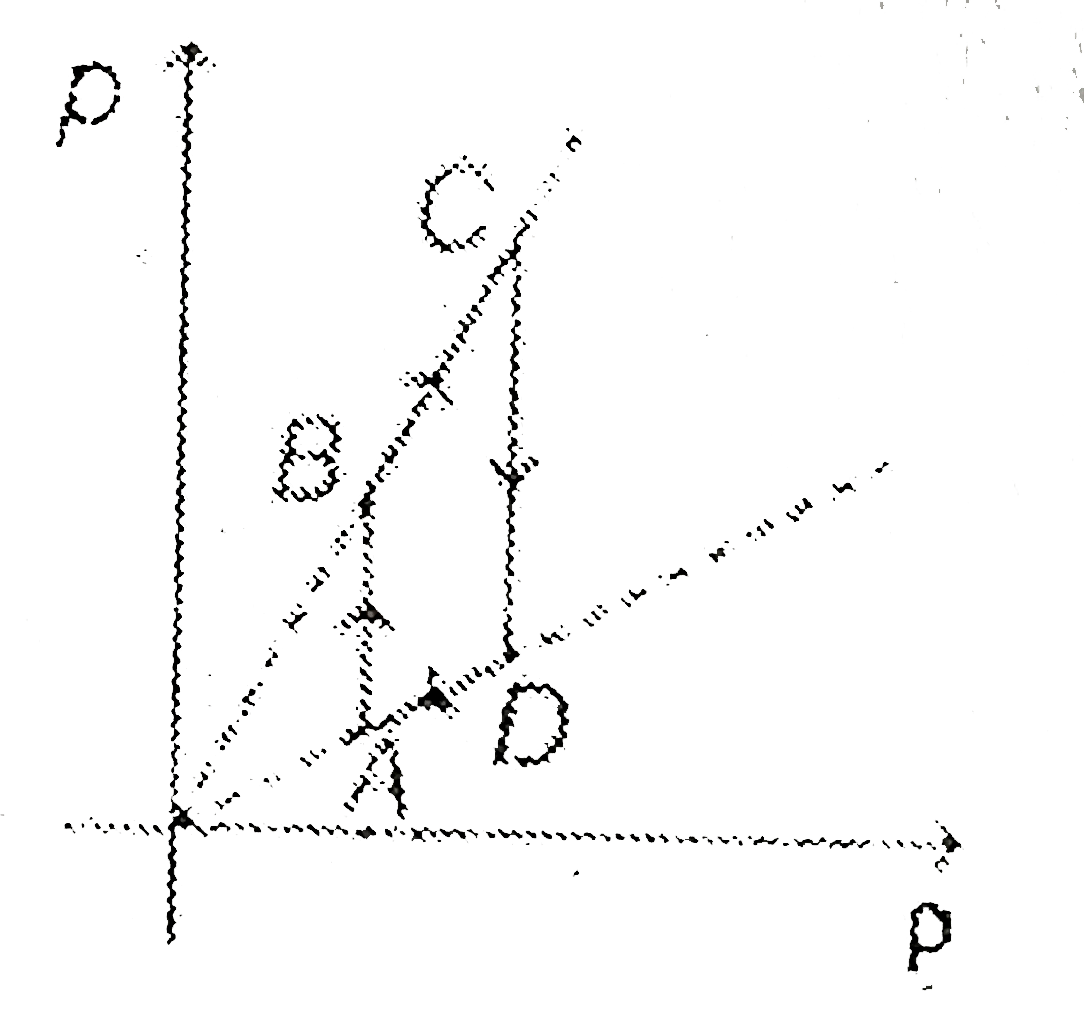
Pressure versus density graph of an ideal gas is shown in figure
 View Solution
Figure shows graphs of pressure vs density for an ideal gas at two temperature T1andT2. Which of the following is correct?
 View Solution
Pressure versus density graph of an ideal gas is shown in figure
 View Solution


