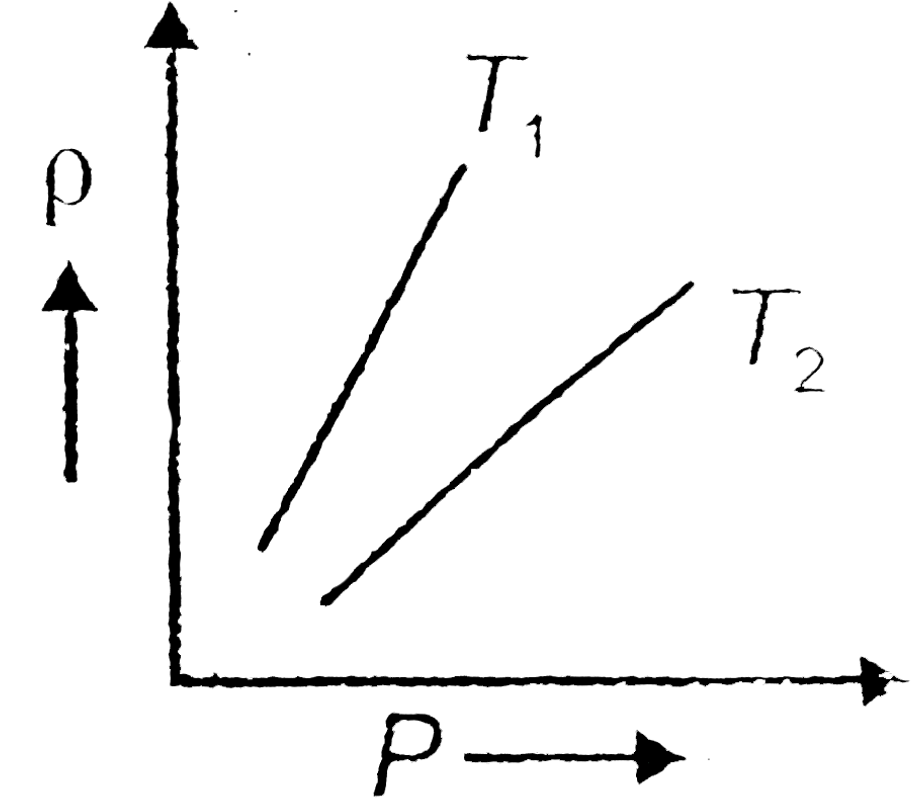
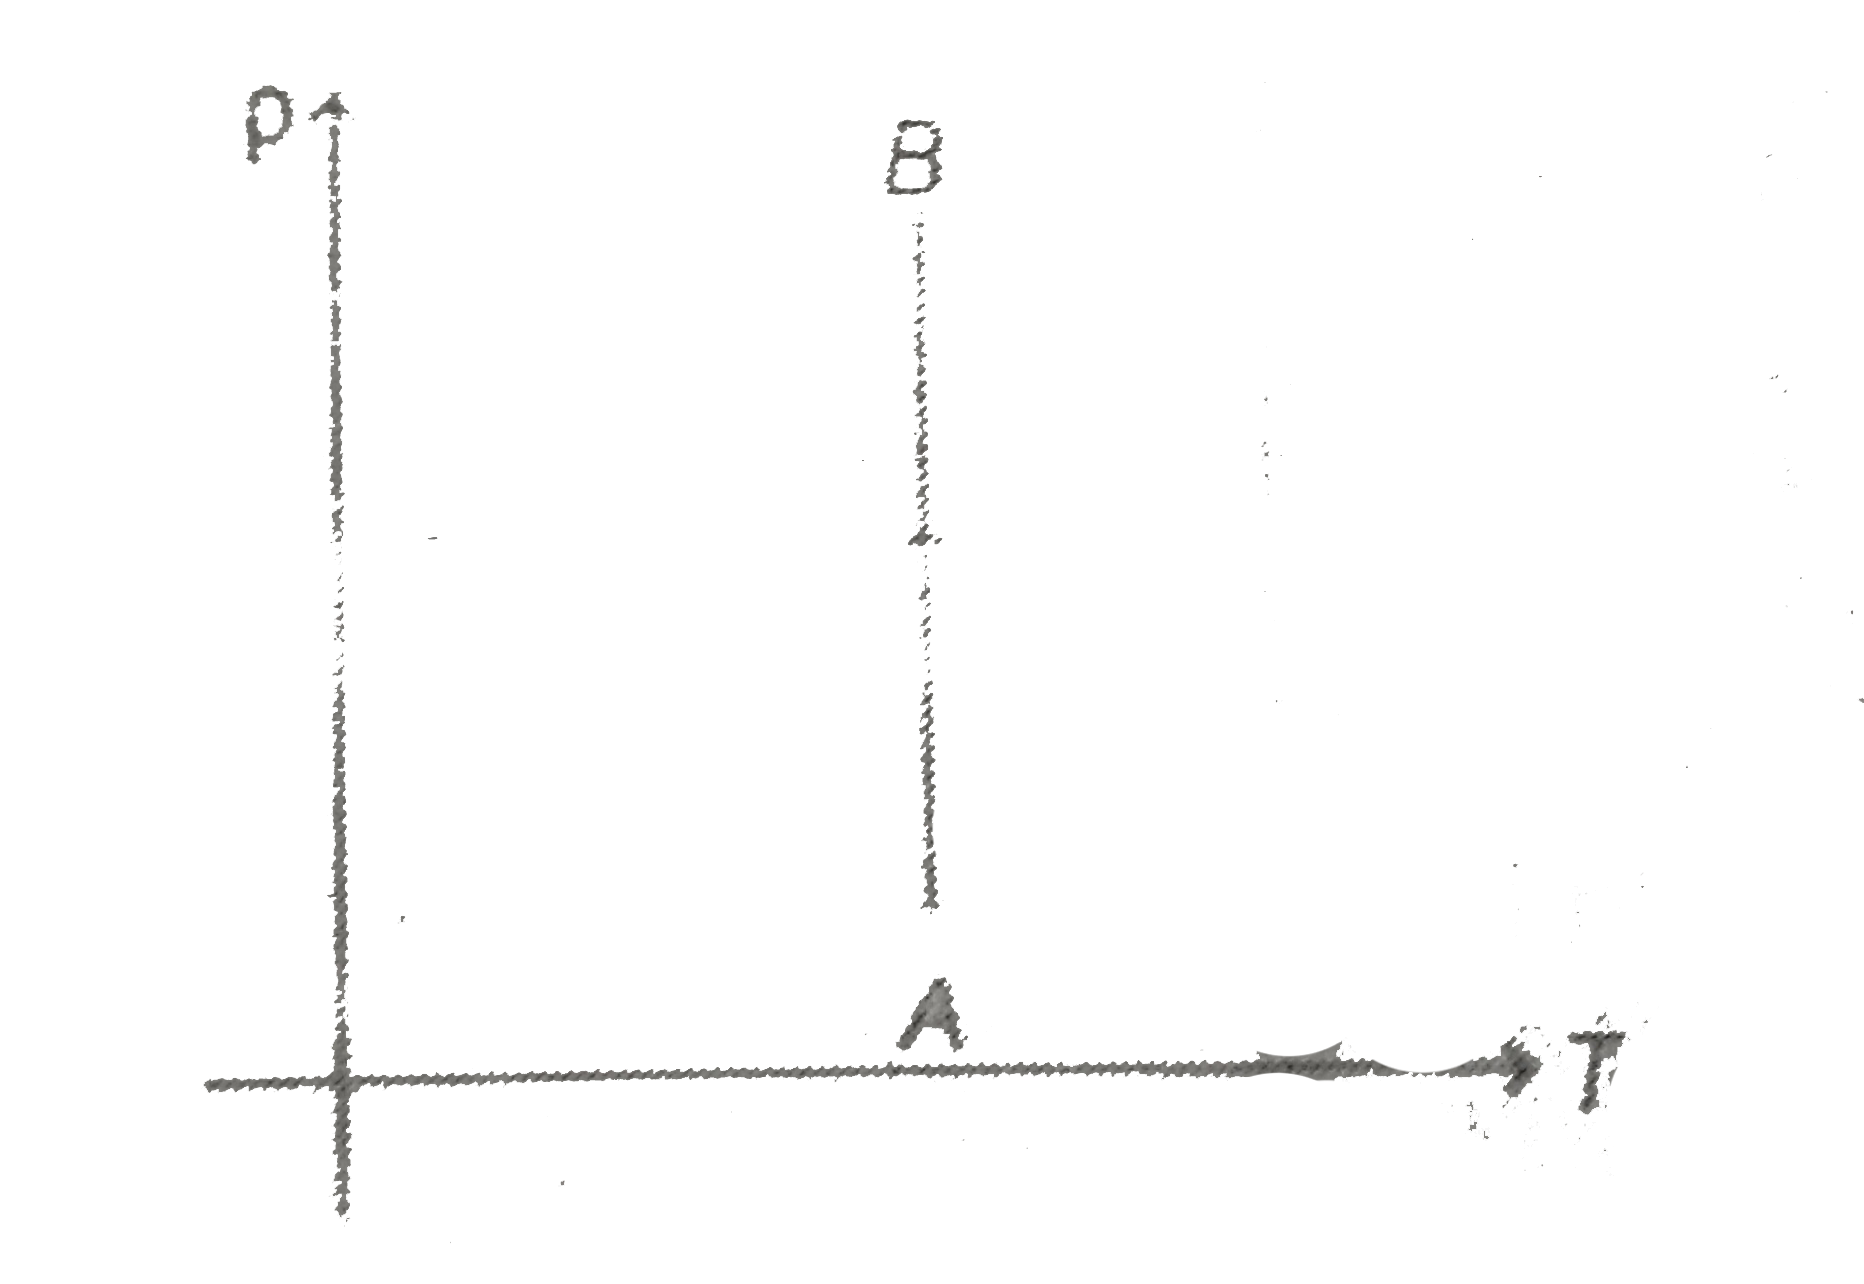
Figure shows graphs of pressure vs density for an ideal gas at two temperature T1andT2. Which of the following is correct?
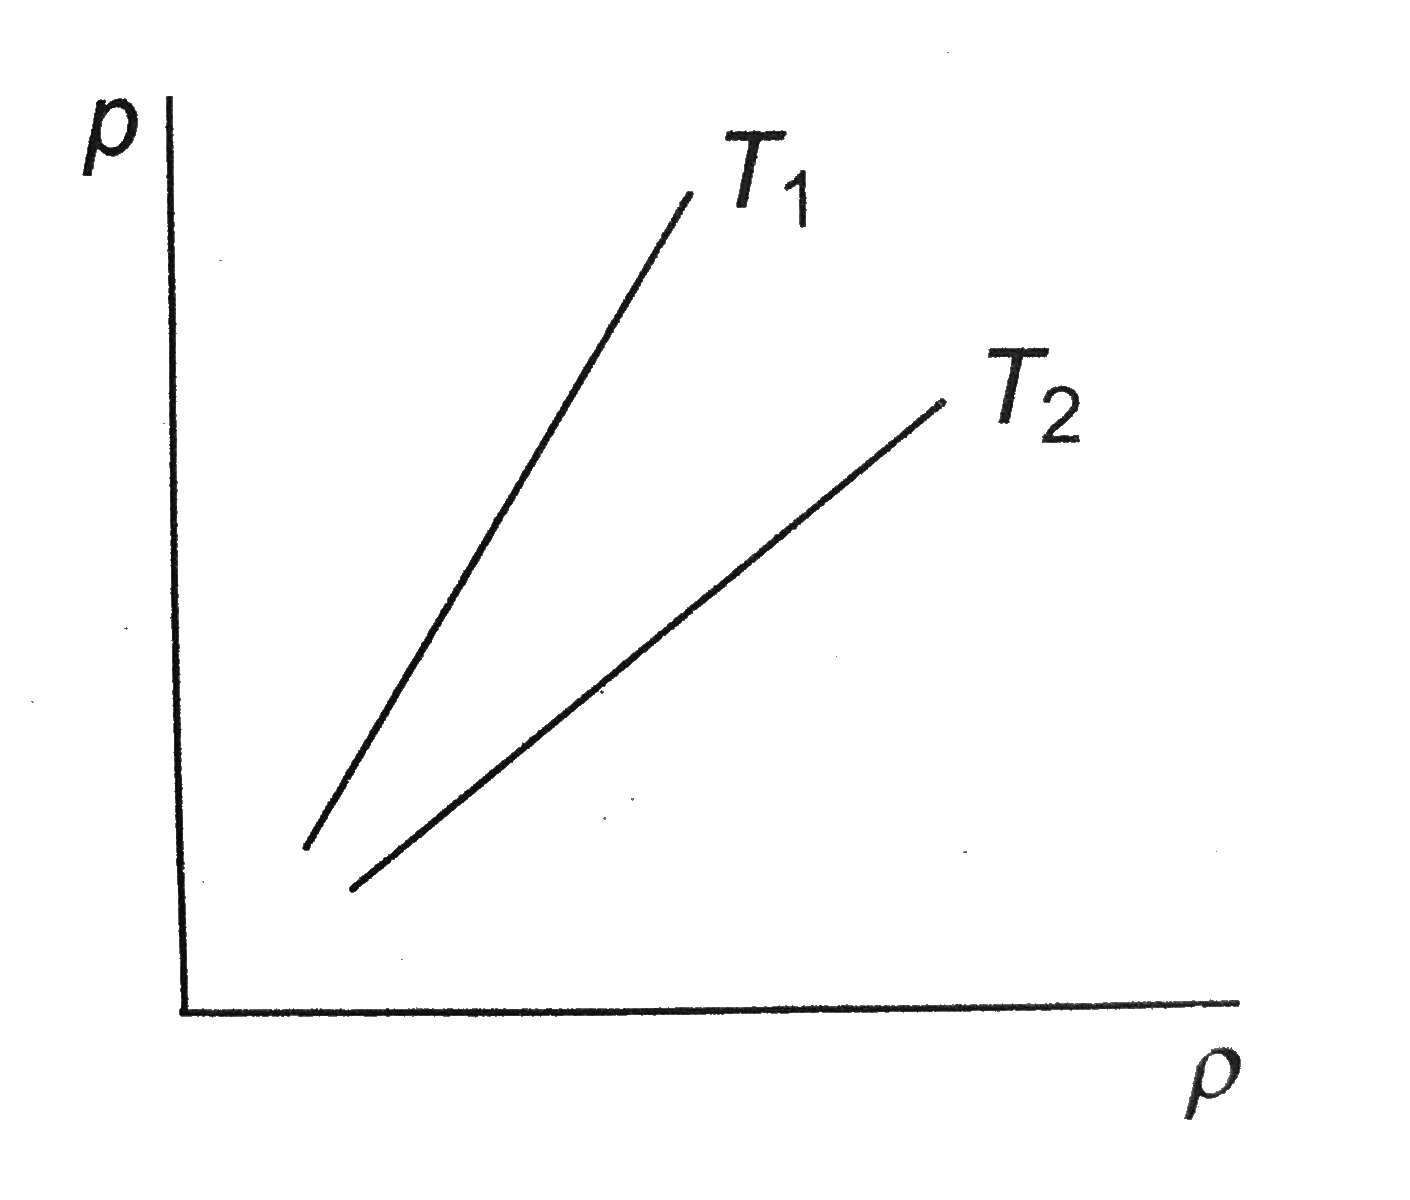
T1>T2
T1=T2
T1<T2
any of the three is possible
The correct Answer is:A
Step by step video & image solution for Figure shows graphs of pressure vs density for an ideal gas at two temperature T_(1) and T_(2). Which of the following is correct? by Physics experts to help you in doubts & scoring excellent marks in Class 11 exams.
Updated on:21/07/2023Topper's Solved these Questions
- KTG & THERMODYNAMICSBOOK - RESONANCE ENGLISHCHAPTER - KTG & THERMODYNAMICSEXERCISE - Exercise-2
1 Videos
- KTG & THERMODYNAMICSBOOK - RESONANCE ENGLISHCHAPTER - KTG & THERMODYNAMICSEXERCISE - PART -I
15 Videos
- KTG & THERMODYNAMICSBOOK - RESONANCE ENGLISHCHAPTER - KTG & THERMODYNAMICSEXERCISE - PART -II
17 Videos
- KINETIC THEORY OF GASES AND THERMODYNAMICSBOOK - RESONANCE ENGLISHCHAPTER - KINETIC THEORY OF GASES AND THERMODYNAMICSEXERCISE - Exercise
64 Videos
- MAGNETIC FIELD AND FORCESBOOK - RESONANCE ENGLISHCHAPTER - MAGNETIC FIELD AND FORCESEXERCISE - Exercise
64 Videos
Similar Questions
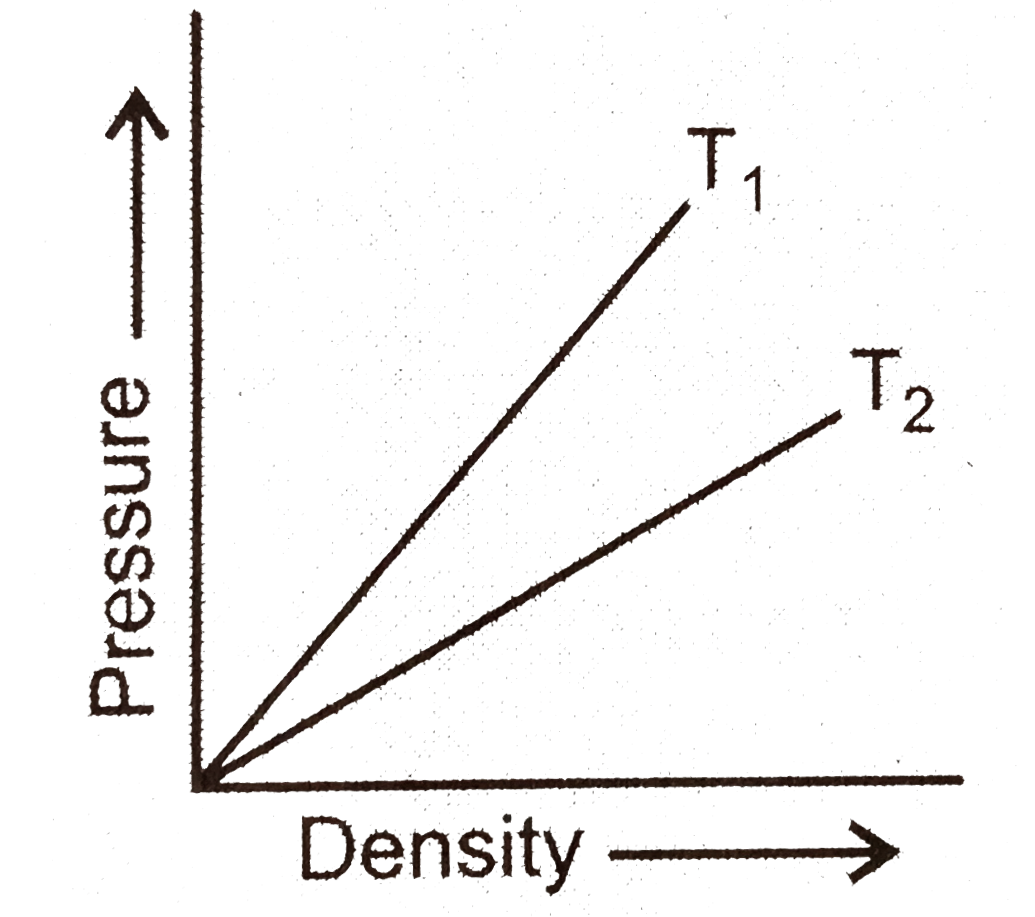
Figure shows graphs of pressure versus density for an ideal gas at two temperatures T1 and T2 Which is correct ?
 .
.
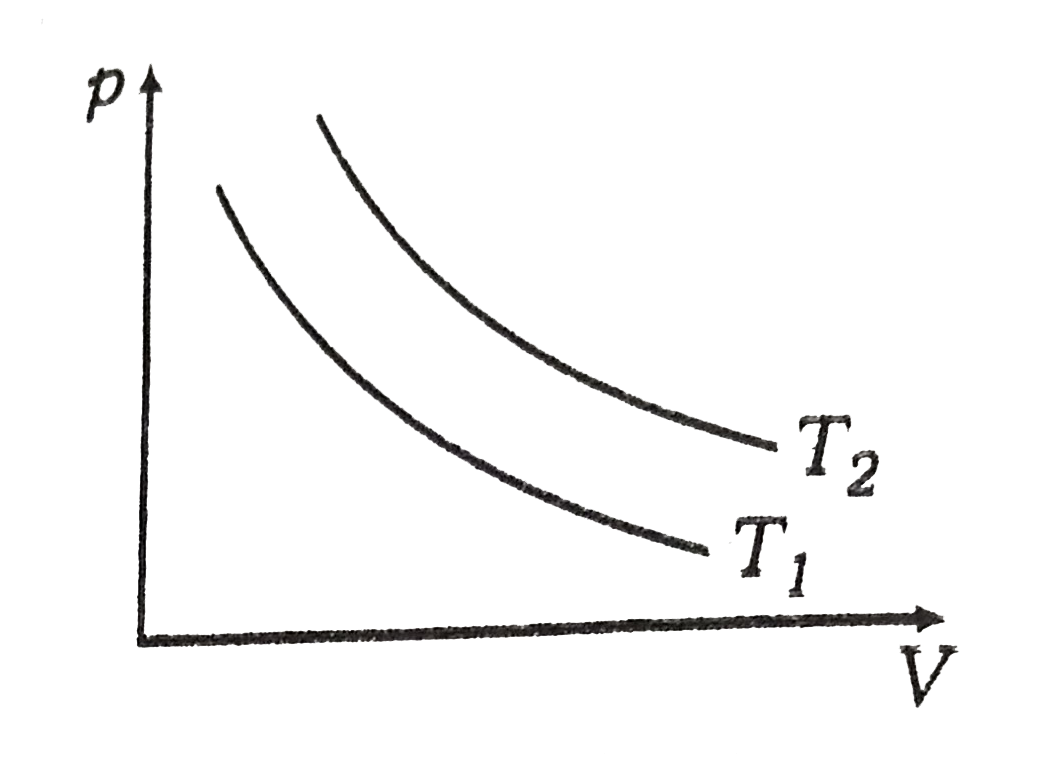
View SolutionThe adjoining fgure shows graph of pressure and volume of a gas at two temperatures T1 and T2 Which one the following is correct
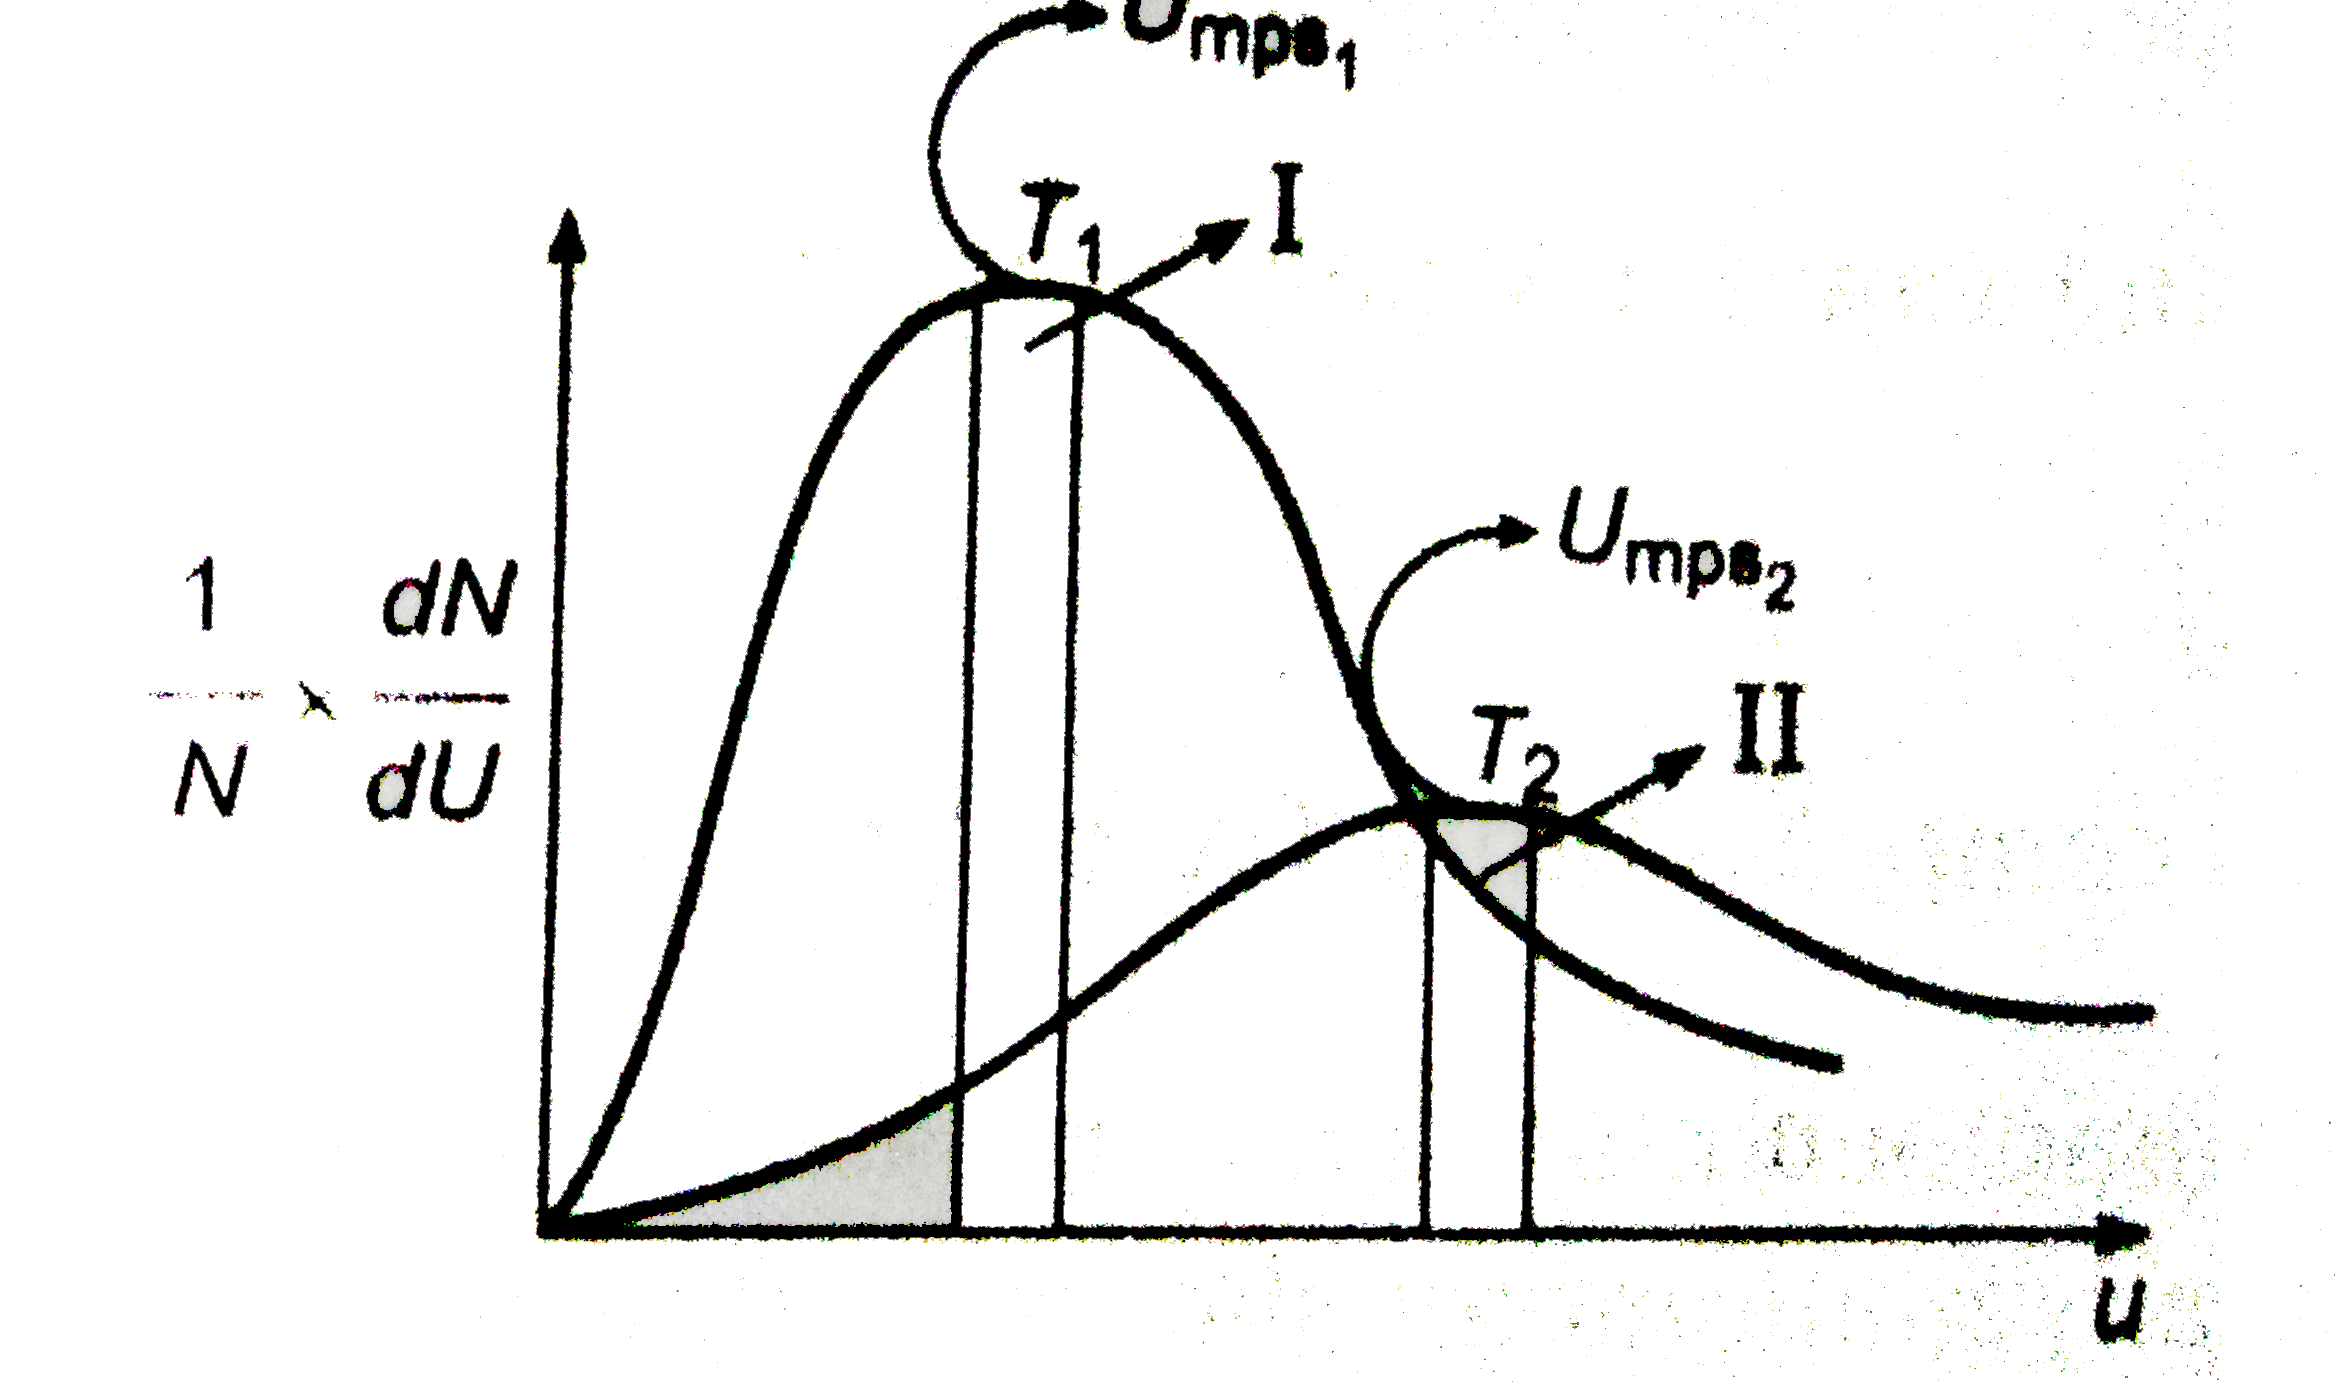
View SolutionFollowing represents the Maxwell distribution curve for an ideal gas at two temperature T1 and T2 . Which of the following option(s) is/are true?
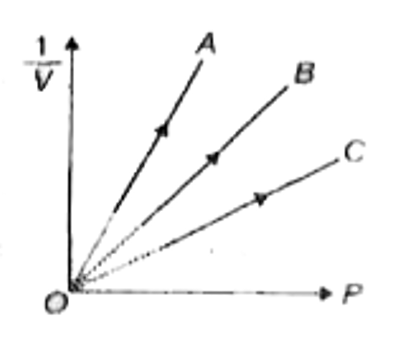
View SolutionFigure shows the isotherms of a fixed mass of an ideal gas at three temperatures TA,TB and TC , then
View SolutionV vs T curves at constant pressure P1 and P2 for an ideal gas are shown in the figure. Which of the following is correct?

View SolutionShown below are the black body radiation curves at temperature T1 and T2(T2>T1). Which of the following plots is correct?
View SolutionThe density (ρ) versus pressure (P) graphs of a given mass of an ideal gas is shown at two temperatures T1andT2. Then relation between T1andT2 may be
View SolutionV vs T curves at different pressures P1 and P2 for an ideal gas are shown below:
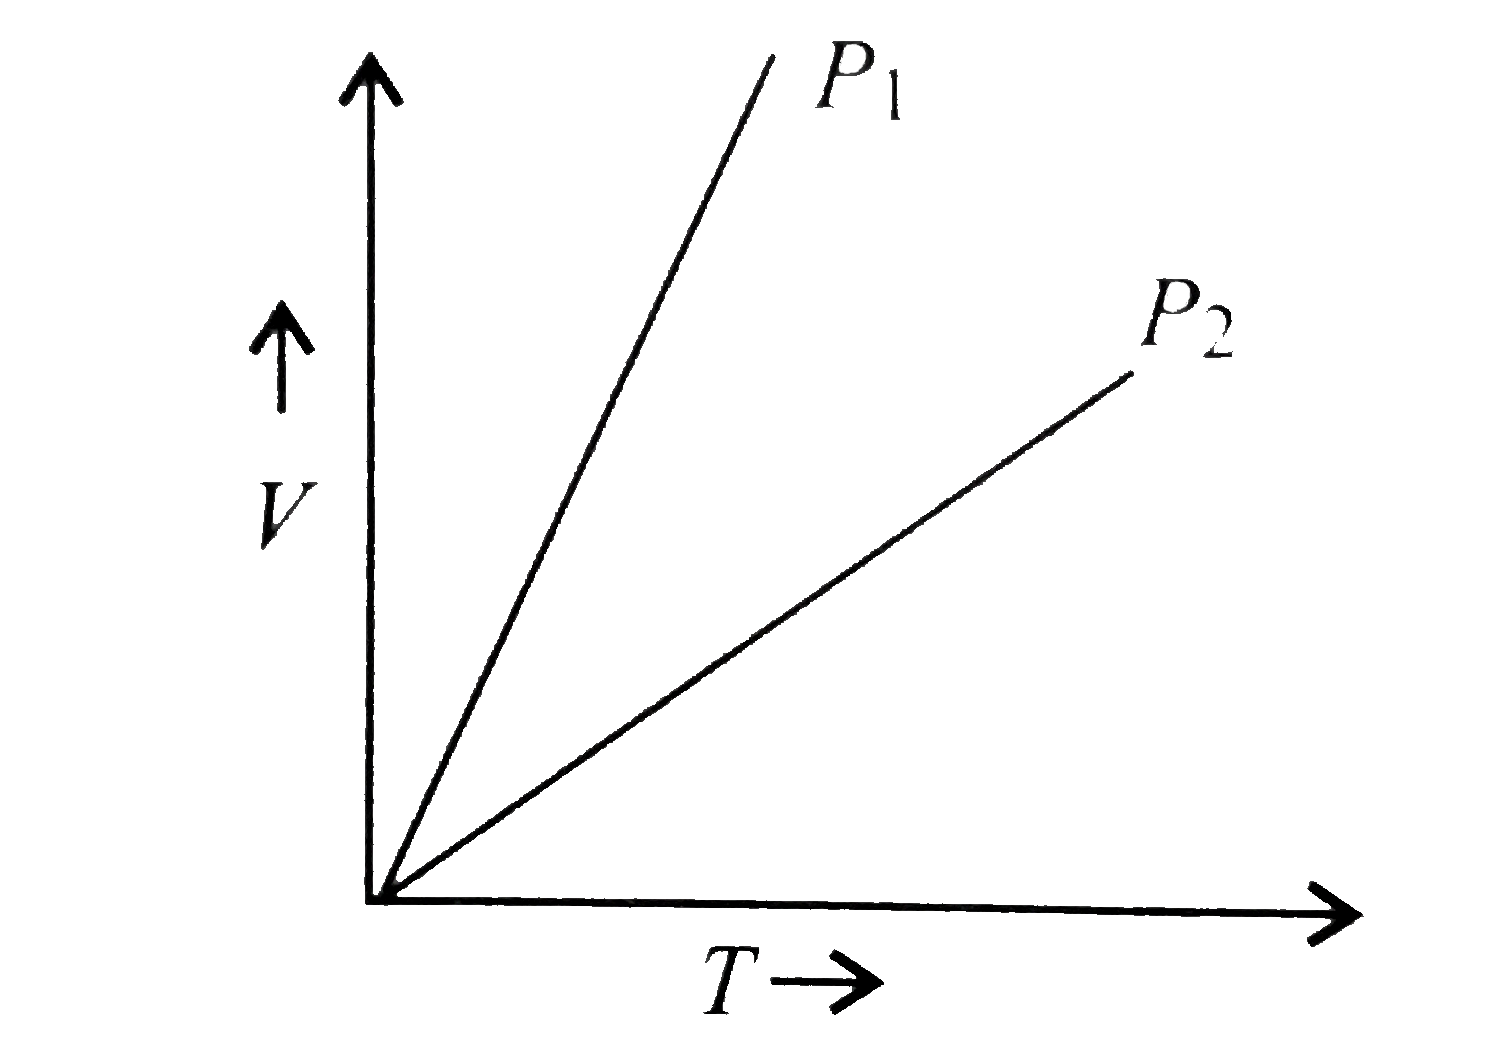
Which one of the following is correct?
View SolutionPressure versus density graph of an ideal gas is shown in figure
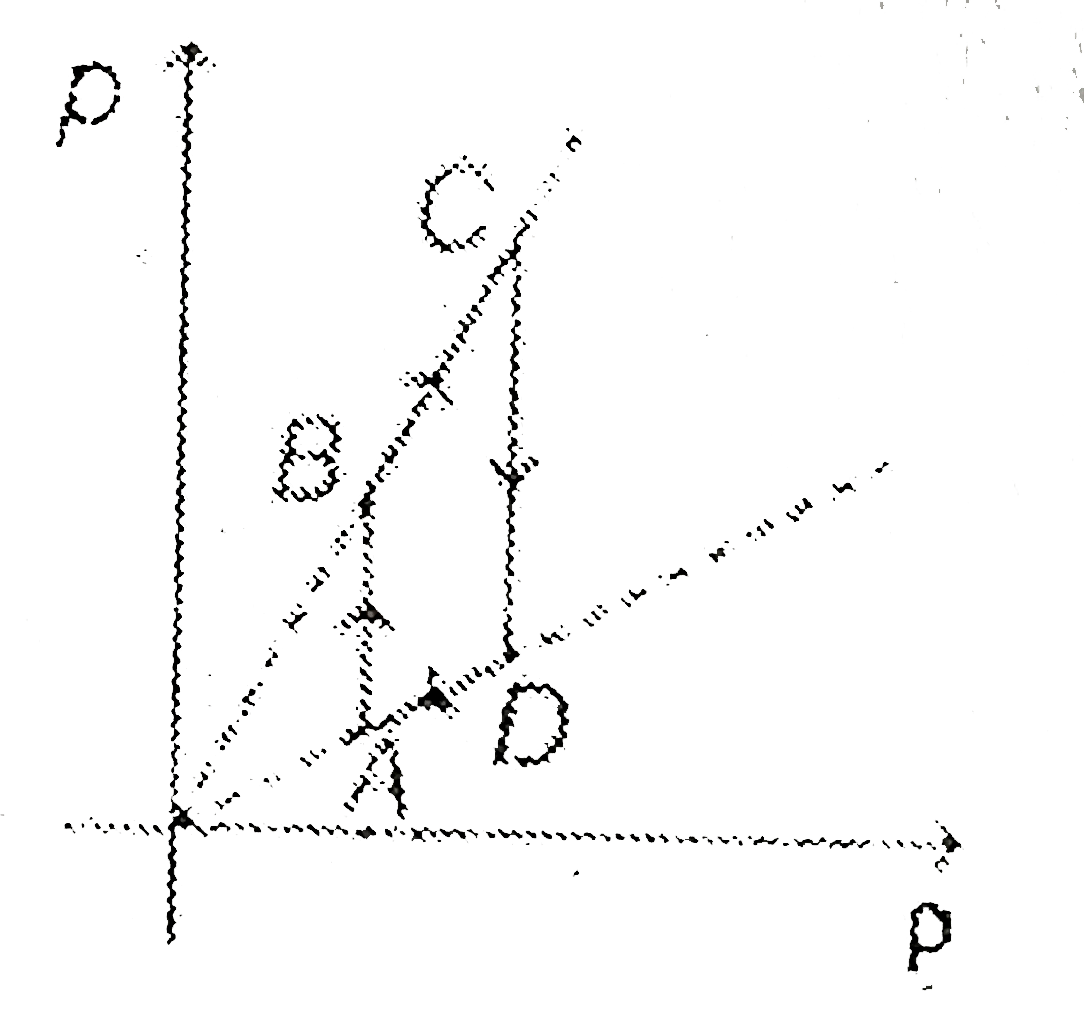
View SolutionThe ednsity (ρ) of an ideal gas varies with temperature T as shown in figure. Then
View Solution
