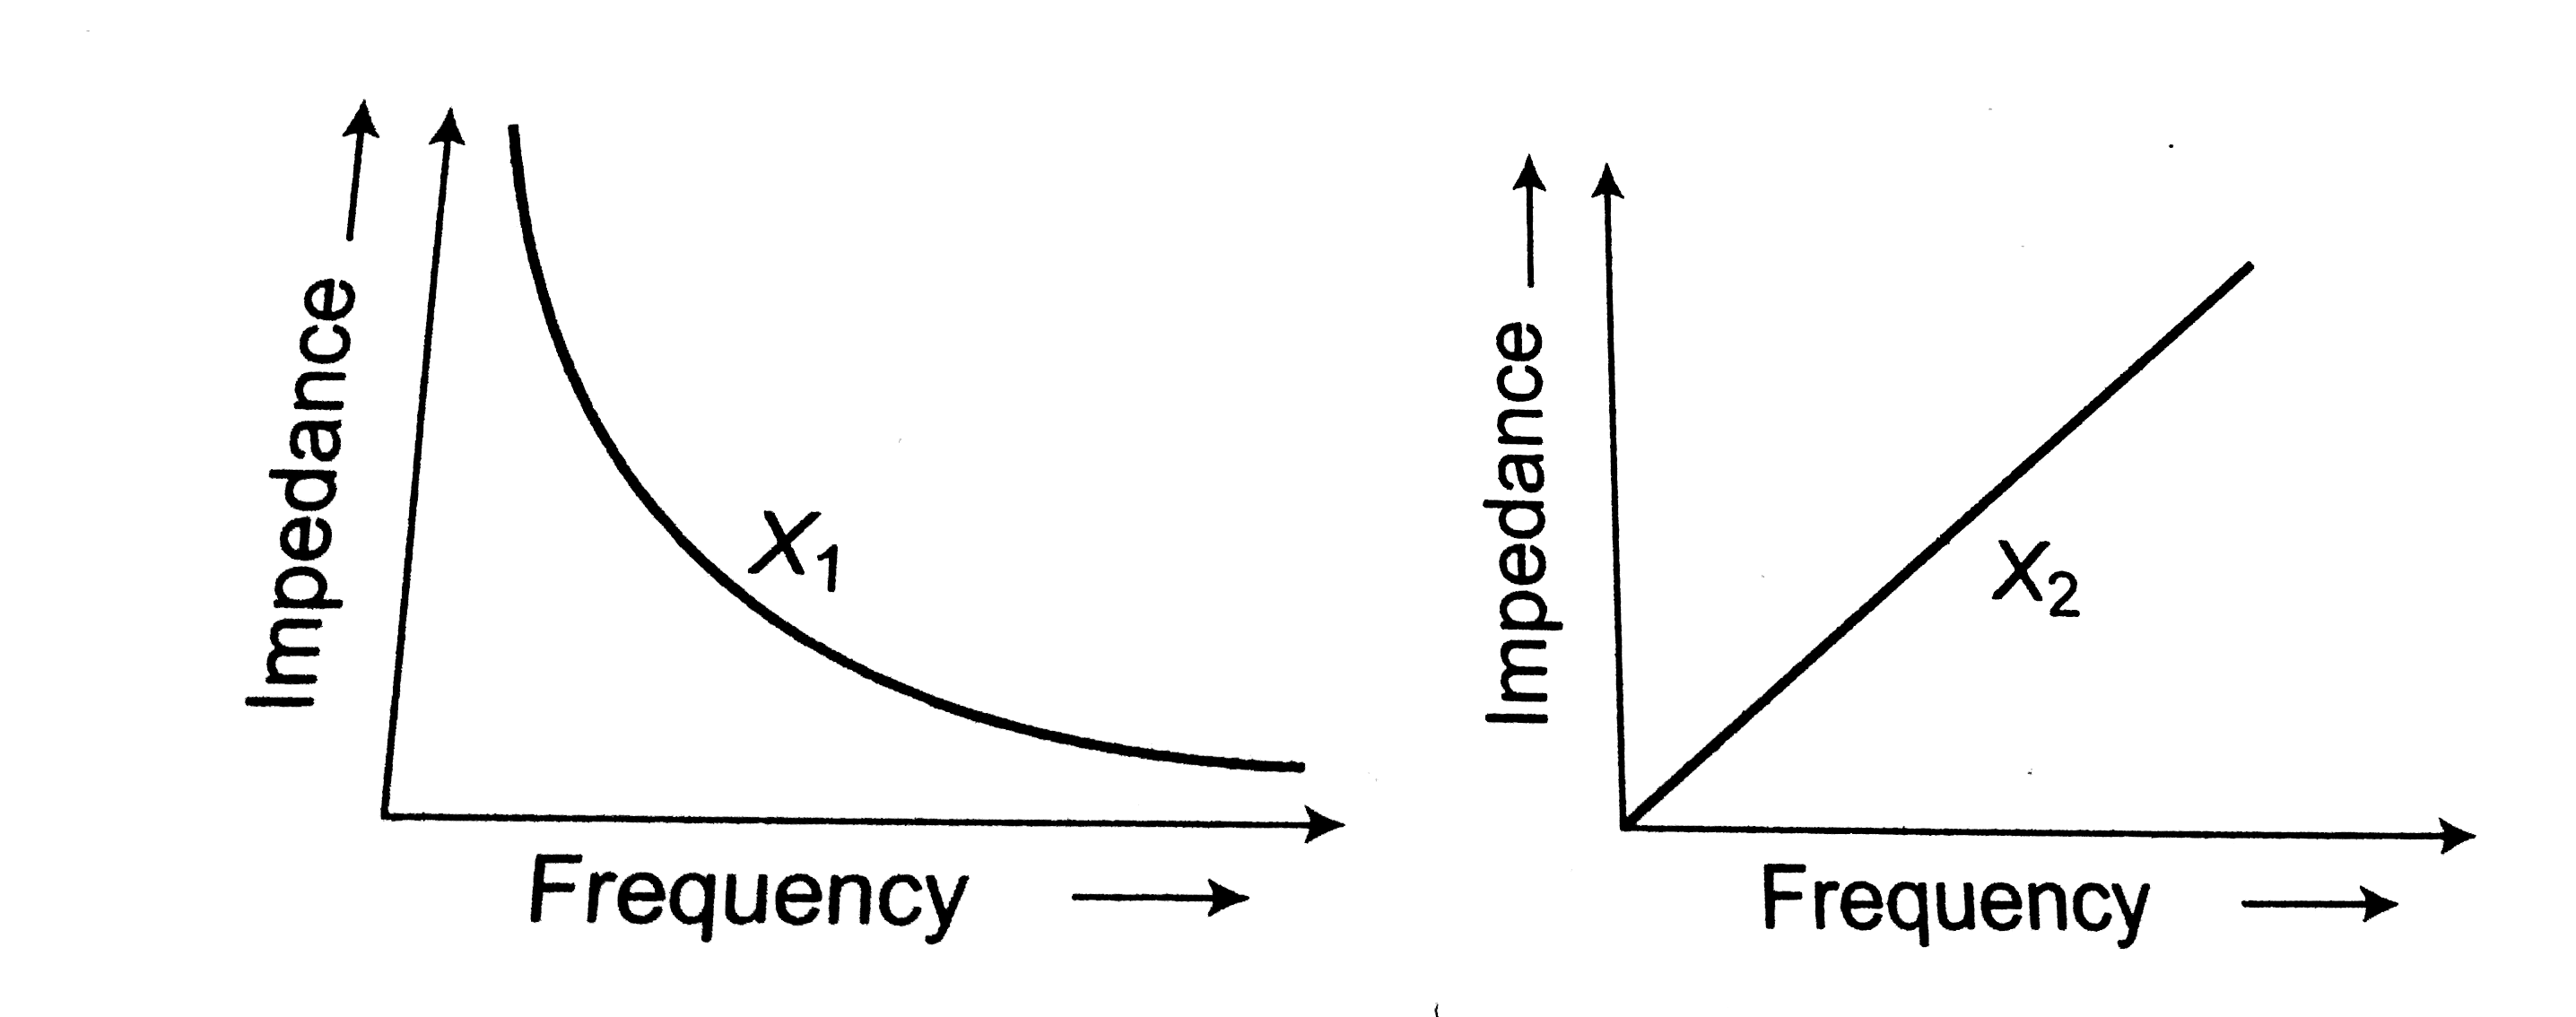
The following graphs gives the dependence of two reactive impedances X1 and X2 on the frequency of the alternating e.m.f. applied individually to them. From these graphs we infer that

A
X1 is a capacitor and X2 is an inductor
B
X1 is an inductor and X2 is a capacitor
C
X1 is an inductor and X2 is a resistor
D
X1 is a resistor and X2 is a capacitor
Text Solution
The correct Answer is:A
Inductive reactance 'X_(L) = omega L = 2 pifC<br>i.e.itisdirectly∝ortional→theequency(f).<br>:.Thegraphofimedanceaga∈stfisastraightl∈e.<br>:. X_(2)isan∈duc→r.<br>CapacitivereactanceX_(C) = 1/(2pi f C)i.e.X_(C) prop 1/f<br>:.thegraphofimpedanceaga∈stfishyperbola.<br>:. X_(1) is a capacitor.
|
Topper's Solved these Questions
- ELECTROMAGNETIC INDUCTION AND ALTERNATING CURRENTS BOOK - MARVEL PUBLICATIONCHAPTER - ELECTROMAGNETIC INDUCTION AND ALTERNATING CURRENTS EXERCISE - TEST YOUR GRASP - 16
30 Videos
- ELASTICITYBOOK - MARVEL PUBLICATIONCHAPTER - ELASTICITYEXERCISE - Test Your Grasp - 5
15 Videos
- ELECTRONS AND PHOTONS BOOK - MARVEL PUBLICATIONCHAPTER - ELECTRONS AND PHOTONS EXERCISE - TEST YOUR GRASP - 17
15 Videos
Similar Questions
Knowledge Check
The graphs given below depict the dependence of two reactive impedances X1 and X2 on the frequency of the alternating e.m.f. applied individually to them. We can then say that
 AX1 is an inductor and X2 is a capacitorBX1 is an resistor and X2 is a capacitorCX1 is an capacitor and X2 is ainductorDX1 is an inductor and X2 is a resistor
If the frequency of alternating e.m.f. is in L−C−R circuit, then the value of impedance Z will change with log (frequency) as
AincreaseBincreases and then becomes equal to resistance, then it will start decreasingCdecreases and when it becomes minimum equal to the resistance then it will start increasingDgo on decreasingAn alternating e.m.f. is applied to a series L-C-R circuit. If the frequency of the applied e.m.f. is more than the resonant frequency of the circuit then the circuit will act as
Aa resistive circuitBan indcutive circuitCa capacitive circuitDan oscillatory circuit
Draw the graph of f(x)=esinx.
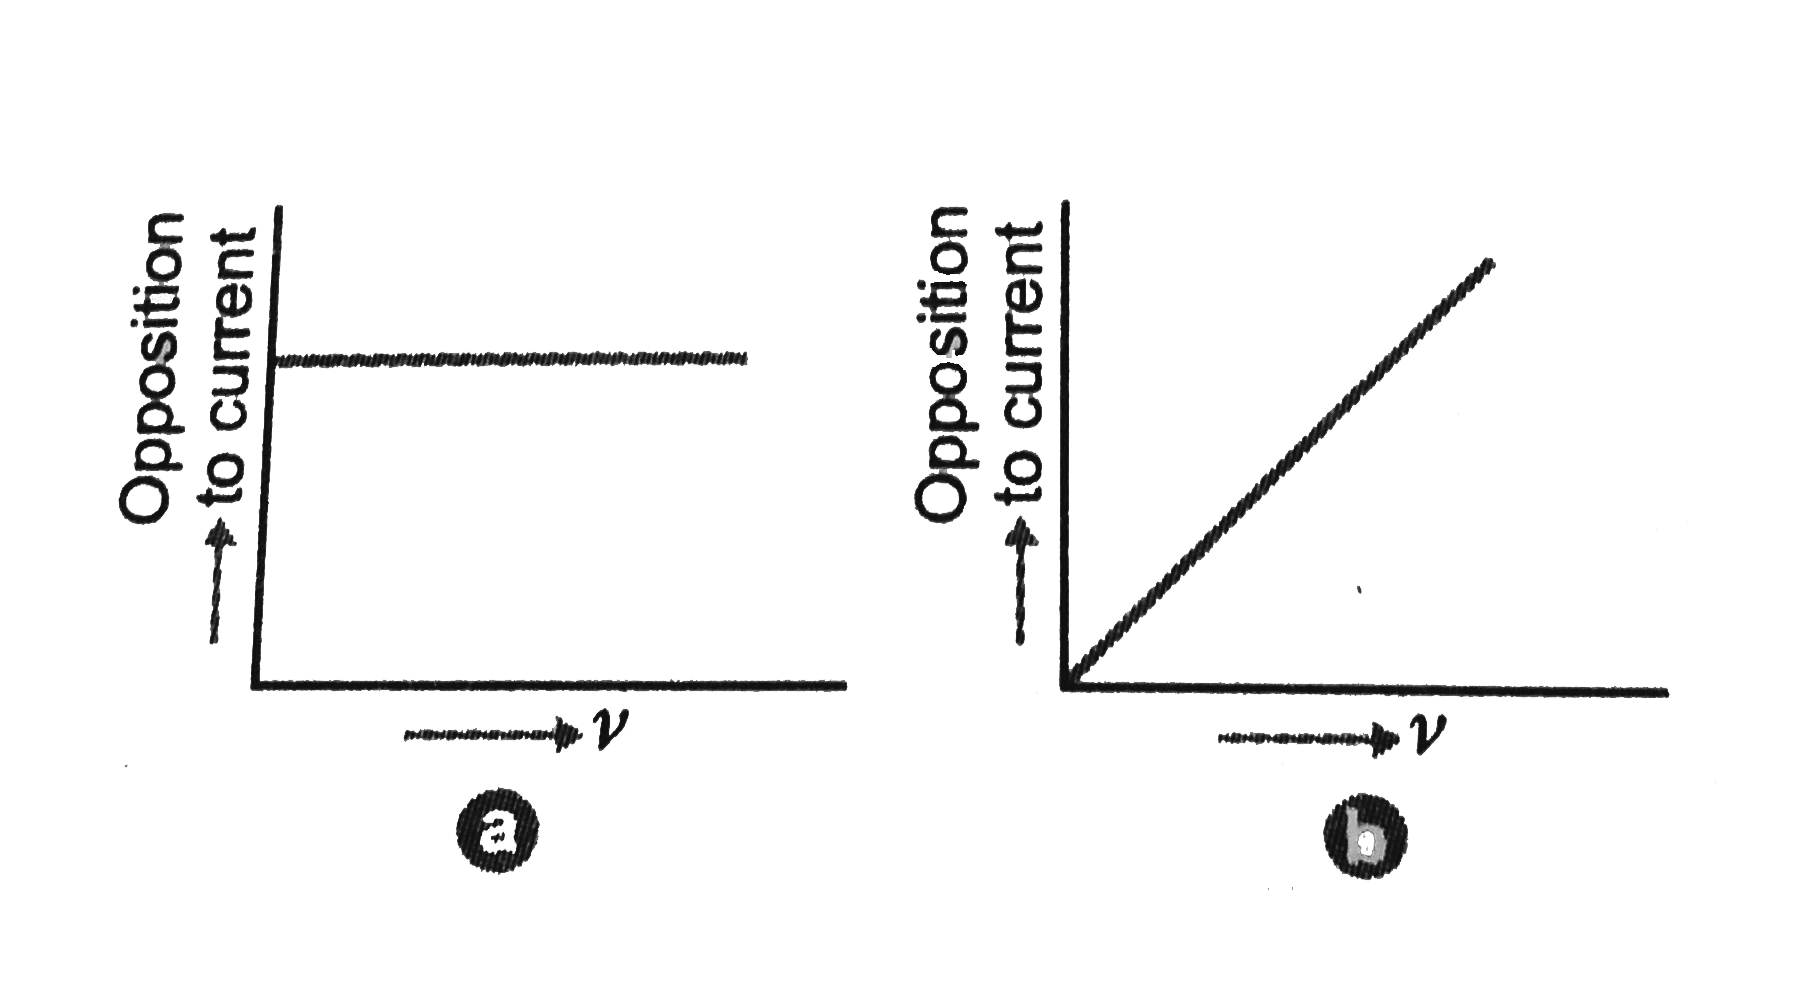
View SolutionThe graphs shown in Fig. represent the variation of opposition offered by the circuit element of the flow of a.c. with frequency of applied e.m.f. Iddntify the circuit element .

View SolutionDraw the graph of the following function.
f(x+1)
View SolutionDraw and discuss the graph of the function f(x)=e1/x
View SolutionDraw and discuss the graph of the function f(x)=e1/x
View Solution
