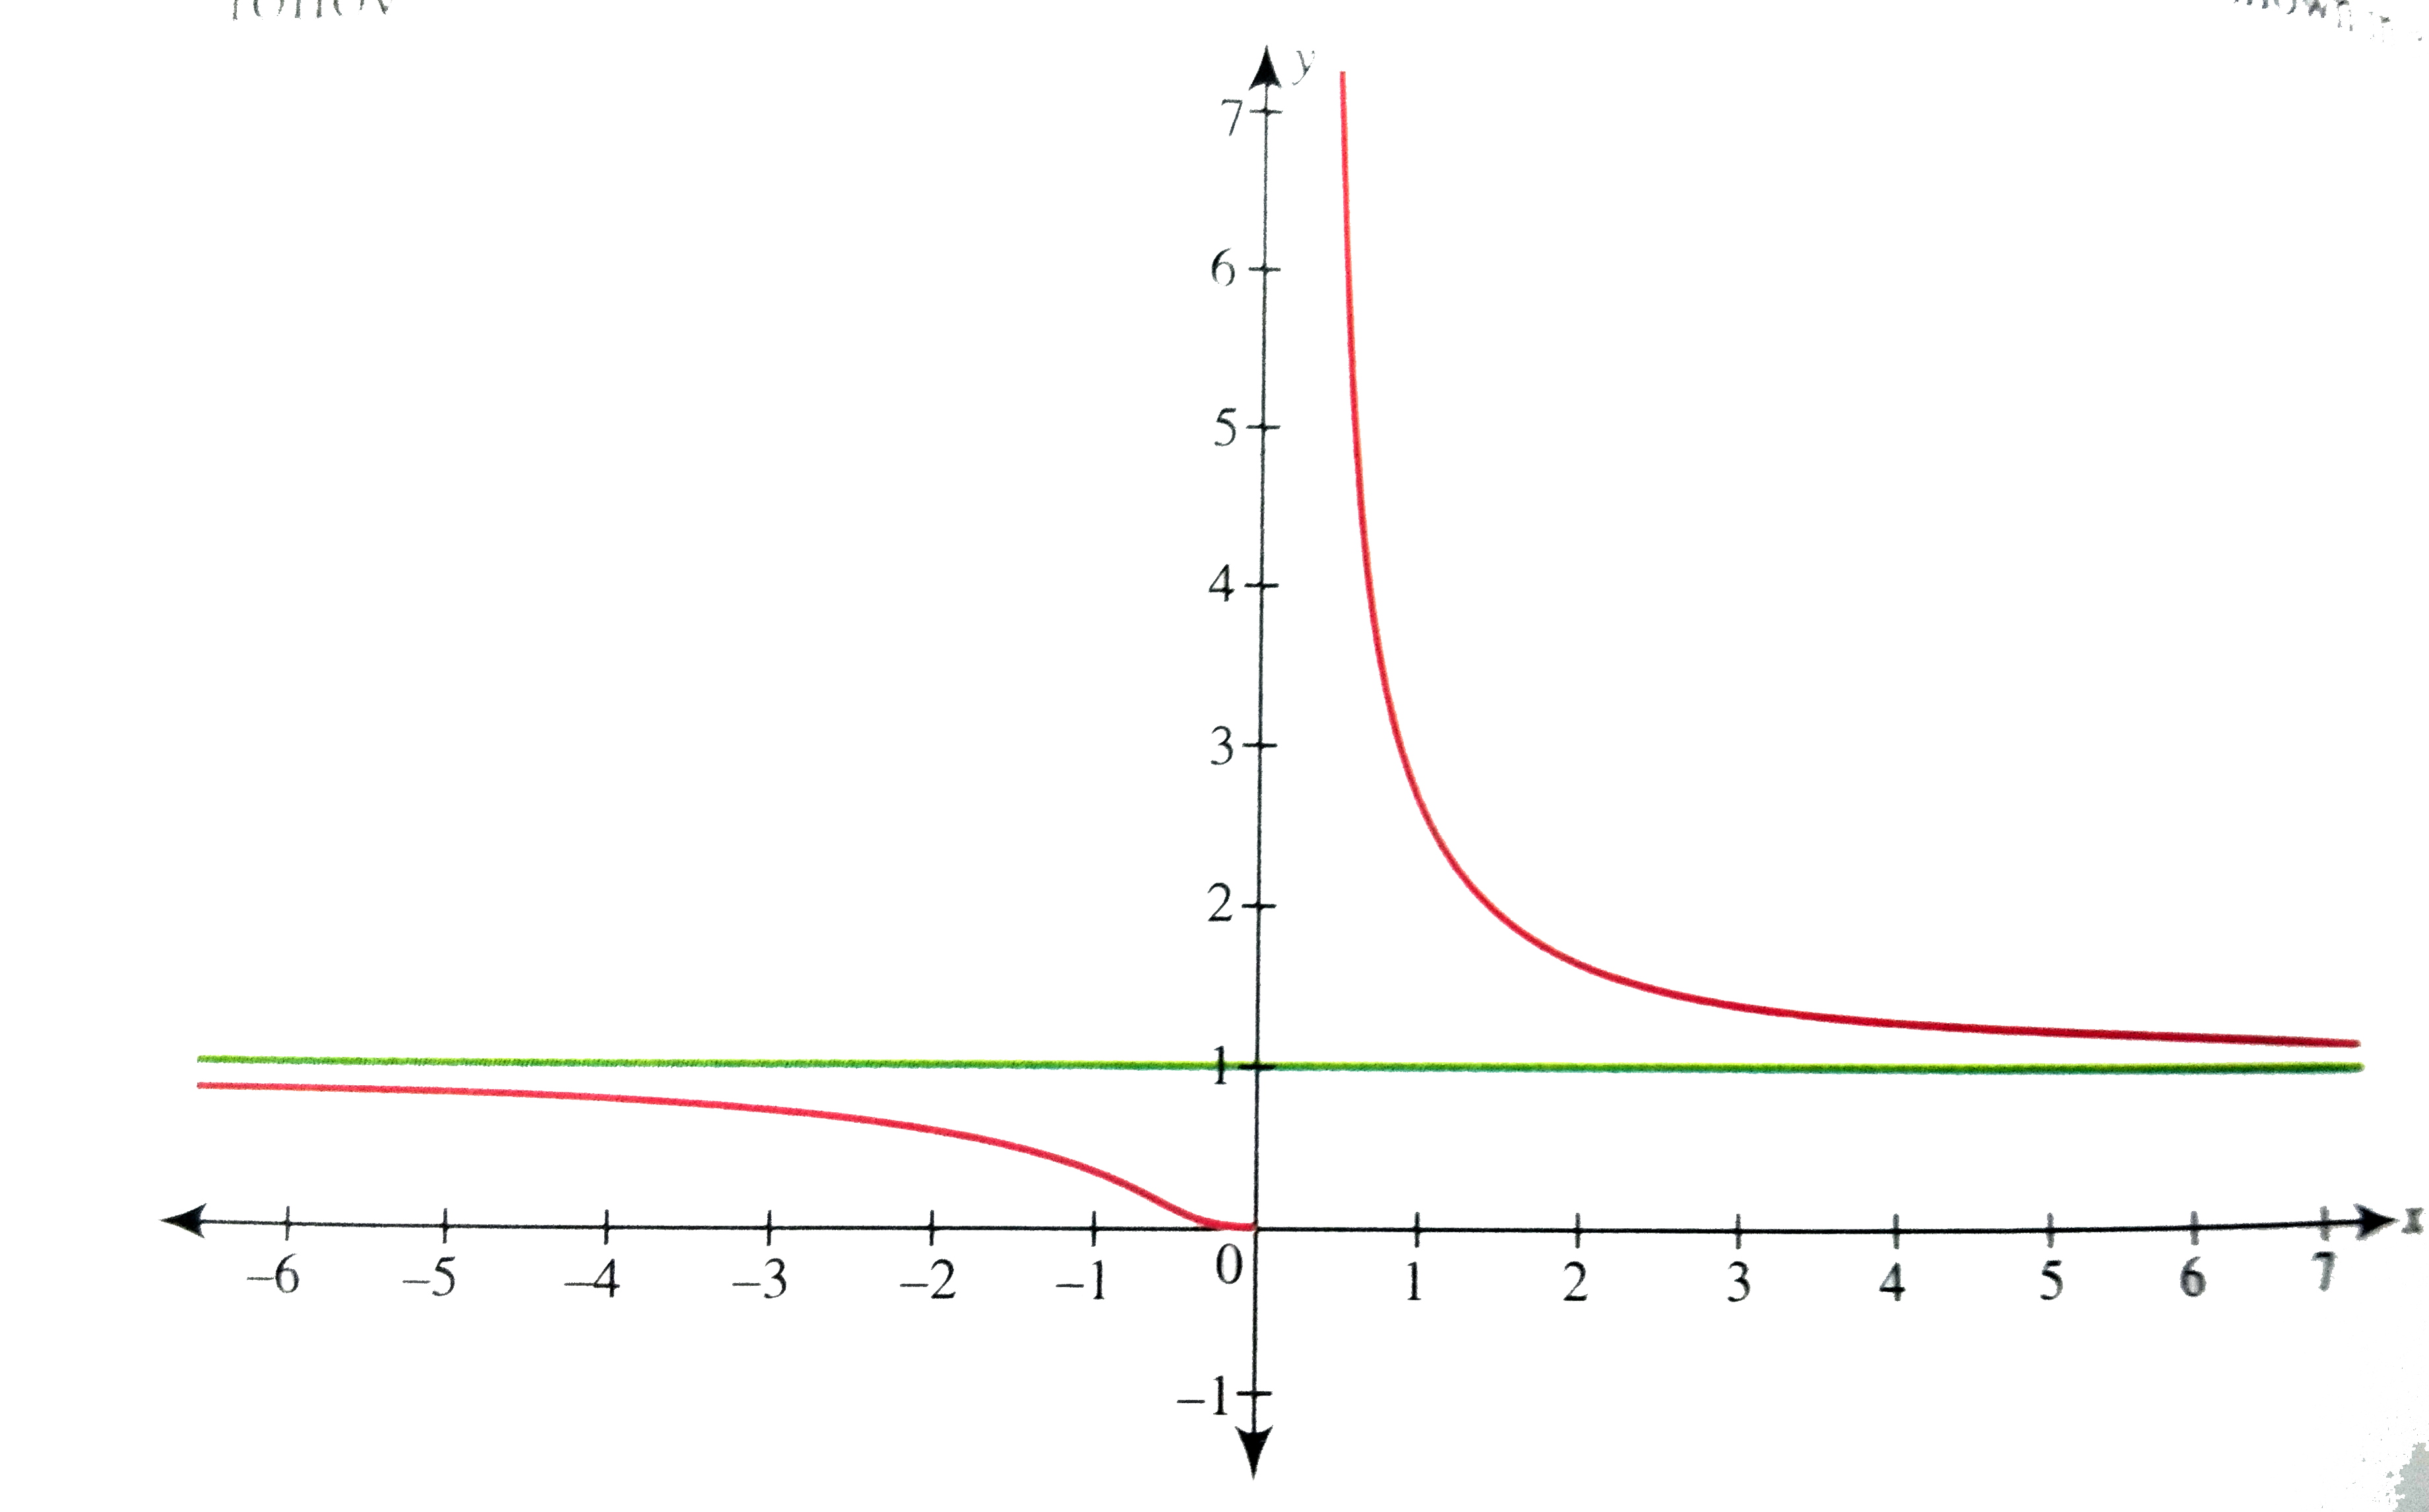
Draw and discuss the graph of the function f(x)=e1/x
Video Solution
Text Solution
We have f(x)=e1/x
Clearly, the domain of function is R−{0}
Also e1/x>0, hence the graph of the function lies above the x-axis.
limx→0+e1x=e∞=∞ and limx→0−e1x=e−∞=0
limx→±∞e1x=e0=1
f′(x)=e1x(−1x2)<0. Hence, f(x) is a decreasing function in the domain.
From the above discussion, the graph of y=f(x) can be drawn as shown in the following figure.

As shown in the figure, y=1 is an asymptote.
|
Updated on:21/07/2023
Topper's Solved these Questions
Similar Questions
Draw the graph of the function f(x)=(1x)x
View SolutionDraw the graph of the function f(x)=xx
View SolutionDraw the graph of the function f(x)=(1+1x)2
View SolutionDraw the graph of the function f(x)=|x−1|
View SolutionDraw the graph of the function f(x)=−x|x|.
View SolutionDraw the graph of the function: f(x)=log|x|
View SolutionDraw the graph of the function: |f(x)|=tanx
View SolutionDraw the graph of the function: |f(x)|=tanx
View SolutionDraw the graph of the function: f(x)=−|x−1|12
View SolutionDraw the graph of the function f(x)=x−√x.
View Solution

