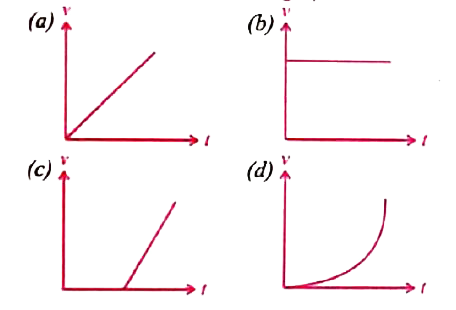
The following graphs represent velocity- time graph. Identify what kind of motion a particle undergoes in each graph
 Solution in Tamil
At all the points, slope of the graph is constant.
∴→a =constant
(b) No change in magnitude of velocity with respect to time
∴→v= constant
© Slope of this graph is greater then graph (a) but constant
∴→a= constant but greater than the graph (a)
(d) At eact point slope of the curve increases.
∴→a is a variable and object is in accelerated motion.
Topper's Solved these Questions
- BOOK - FULL MARKSCHAPTER - KINEMATICSEXERCISE - ADDITIONAL QUESTIONS SOLVED (SHORT ANSWER QUESTIONS (1 MARK))102videos
KINEMATICS
- BOOK - FULL MARKSCHAPTER - KINEMATICSEXERCISE - ADDITIONAL QUESTIONS SOLVED (SHORT ANSWER QUESTIONS - 1 (3 MARKS))14videos
KINEMATICS
- BOOK - FULL MARKSCHAPTER - KINEMATICSEXERCISE - ADDITIONAL QUESTIONS SOLVED (NUMERICAL QUESTIONS)42videos
KINEMATICS
- BOOK - FULL MARKSCHAPTER - HEAT AND THERMODYNAMICSEXERCISE - ADDITIONAL QUESTIONS SOLVED (Numerical Problems)16videos
HEAT AND THERMODYNAMICS
- BOOK - FULL MARKSCHAPTER - KINETIC THEORY OF GASESEXERCISE - Addtional Numerical Problems10videos
KINETIC THEORY OF GASES
Similar Questions
What is meant by Frame of reference?
02:11View SolutionIs the acceleration of a particle in circular motion not always towards the centre? Explain.
01:19View SolutionThe V-t graphs of two objects make angle 30∘ and 60∘ with the time axis. Find the ratio of their accelerations.
04:58View SolutionThe length of a metal wire is l1 when the tension in it is T1 and is l2 when the tension is T2. The natural length of the wire is:
02:36View SolutionIf the rms speed of hydrogen molecules at 300K is1930ms−1. Then what is the rms speed of oxygen molecules at 1200K.
03:59View SolutionFigure shows the position the graph for a particle in one dimensional motion. Which of the graphs in fugure represent the variation in the velocity of the particle with time ?
06:14View SolutionWhich of the following velocity-time graphs represent uniform motion
05:37View Solutionनिम्न ग्राफों का ढलान क्या प्रदर्शित करता है?
(i)स्थिति-समय ग्राफ, (ii) वेग –समय ग्राफ01:44View SolutionWhich of the following graphs represents the motion of a particle moving with constant velocity?
05:17View SolutionFigure shows the acceleration-time graphs of a particle. Which of the following represents the corresponding velocity -time graph?
 View Solution
The following graphs represent velocity- time graph. Identify what kind of motion a particle undergoes in each graph
 01:44View Solution
The following graphs represent velocity- time graph. Identify what kind of motion a particle undergoes in each graph
 View Solution
Which of the following velocity-time graphs represent uniform motion
View SolutionFigure shows the acceleration time graph of a particle. Which of the following represents the corresponding velocity-time graph ?
 01:31View Solution
Which of the following velocity-time graphs represent uniform motion
02:08View SolutionWhich of the following velocity-time graphs represent uniform motion
View Solution

