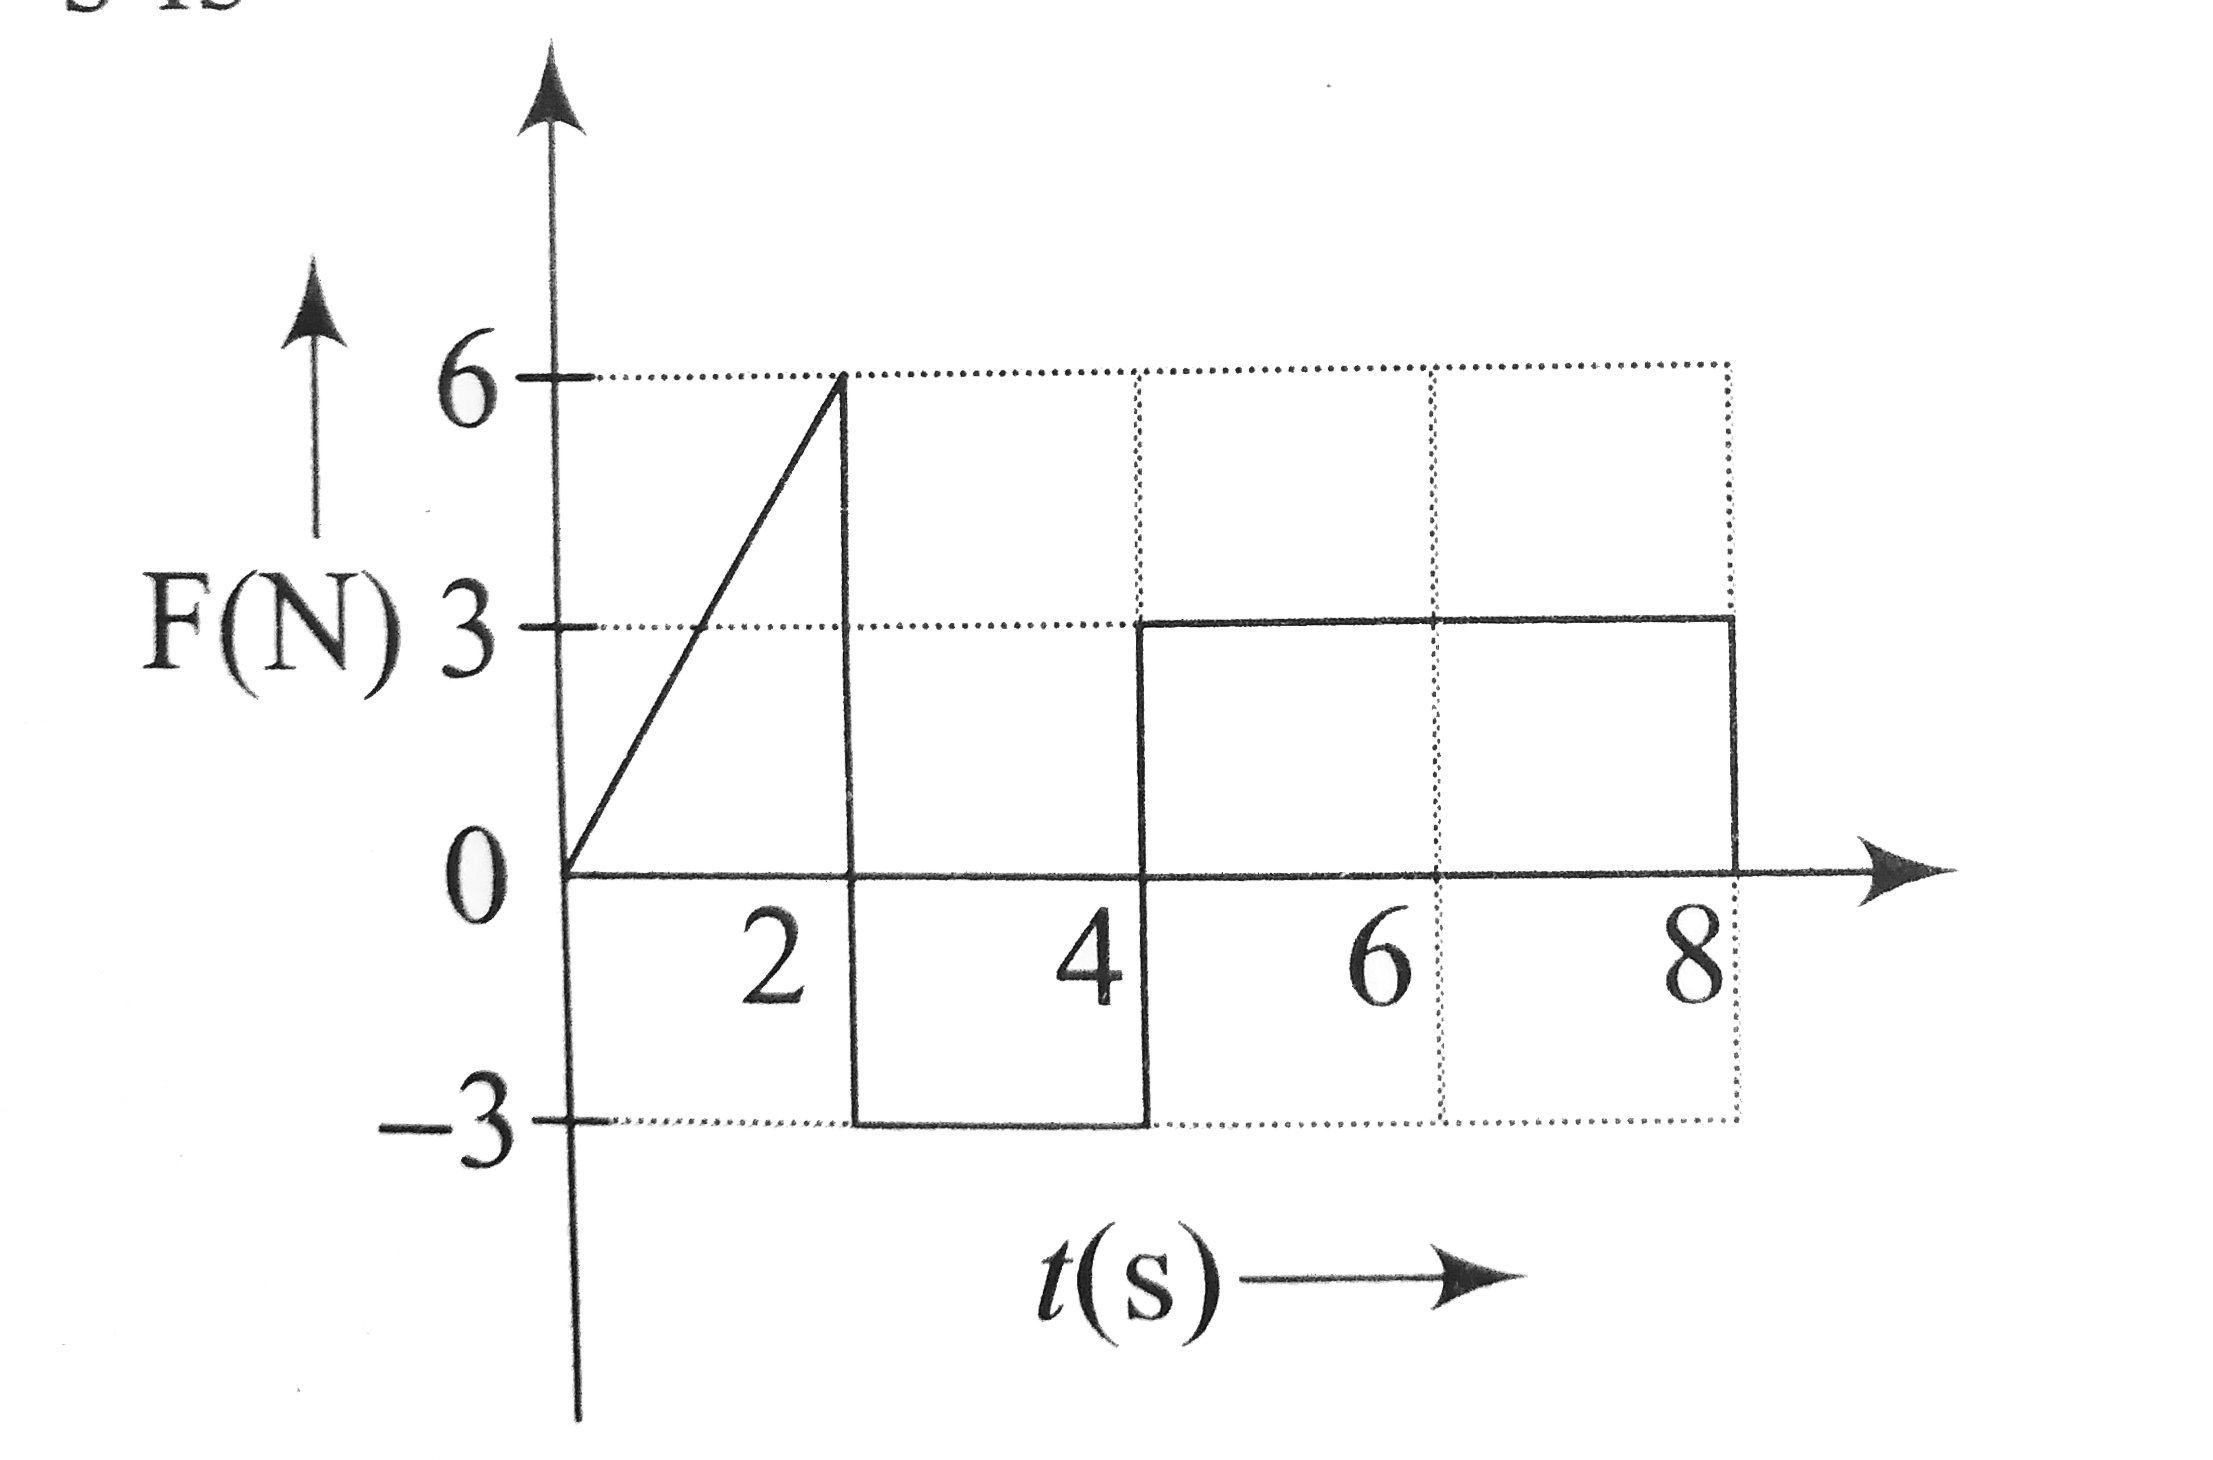
The force F acting on a partical of mass m is indicated by the force-time graph shown below. The change in momentum of the particle over time interval from zero to 8 s is.
24Ns
20Ns
12Ns
6Ns
The correct Answer is:c
Change in linear momentum in the given interval of time = Area below the F−t graph in that interval
(12×2×6)−(2×3)+(4×3)
=12Ns .
Topper's Solved these Questions
- LAWS OF MOTIONBOOK - PRADEEPCHAPTER - LAWS OF MOTIONEXERCISE - Integer Type Questions
7 Videos
- LAWS OF MOTIONBOOK - PRADEEPCHAPTER - LAWS OF MOTIONEXERCISE - Assertion- Reason Type Questions
17 Videos
- LAWS OF MOTIONBOOK - PRADEEPCHAPTER - LAWS OF MOTIONEXERCISE - Problems for practice
112 Videos
- KINEMATICSBOOK - PRADEEPCHAPTER - KINEMATICSEXERCISE - 1 NCERT Comprehension
4 Videos
- MATHEMATICAL TOOLSBOOK - PRADEEPCHAPTER - MATHEMATICAL TOOLSEXERCISE - Fill in the blanks
5 Videos
Similar Questions
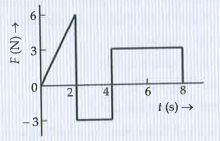
The force F acting on a particle of mass mis indicated by the force-time graph shown below. The change in momentum of the particle over the time interval from zero to 8 s is
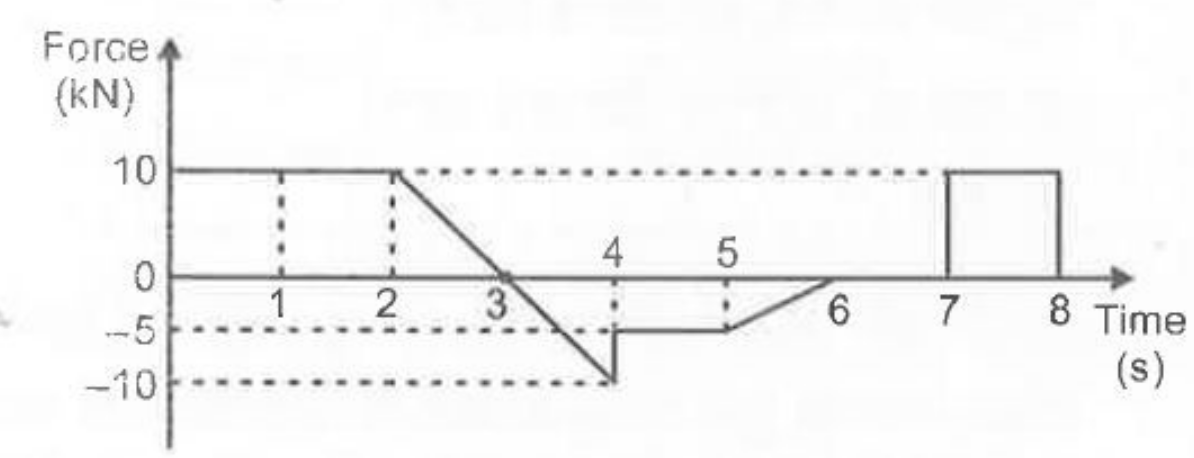
View SolutionThe force acting on a particle of mass 20 kg is indicated by force - time graph as shown in figure. The magnitude of change in linear momentum of particle during time interval 0 to 6 second is
View Solution
Knowledge Check
The force F acting on a particle of mass mis indicated by the force-time graph shown below. The change in momentum of the particle over the time interval from zero to 8 s is
 A24 NsB20 NsC12 NsD6 Ns
The force-time(F–t) curve of a particle executing linear motion is as shown in the figure. The momentum acquired by the particle in time interval from zero to 8 second will be
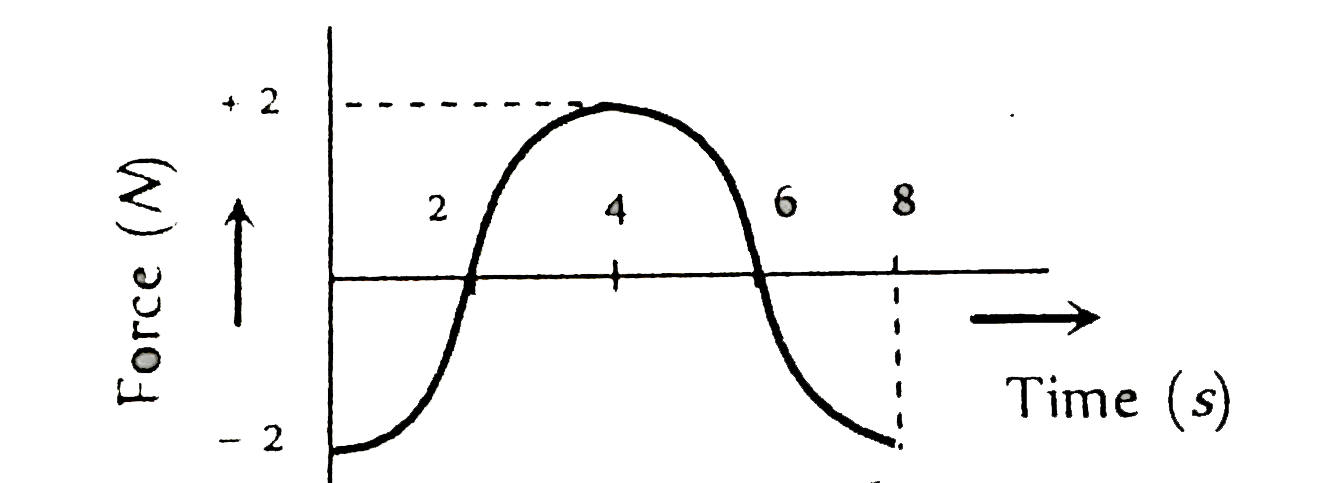 A−2 N-sB+4 N-sC6 N-sDZero
A force acting on an object of mass 500 g changes its speed from 200 cm/s to 0.2 m/s. The change in momentum is
Aincrease by 0.90 N sBdecrease by 0.90 N sCincrease by 90 g cm/sDdecrease by 90 g cm/s
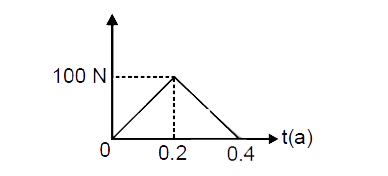
The figure showns the force versus time graph for a particle.
Find the change in momentum Δp of the particle
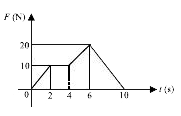
View SolutionA particle of mass 2 kg is initially at rest. A force , acts on it whose magnitude changes with time. The force-time graph is of shown here.
The velocity of the particle after 10 s is
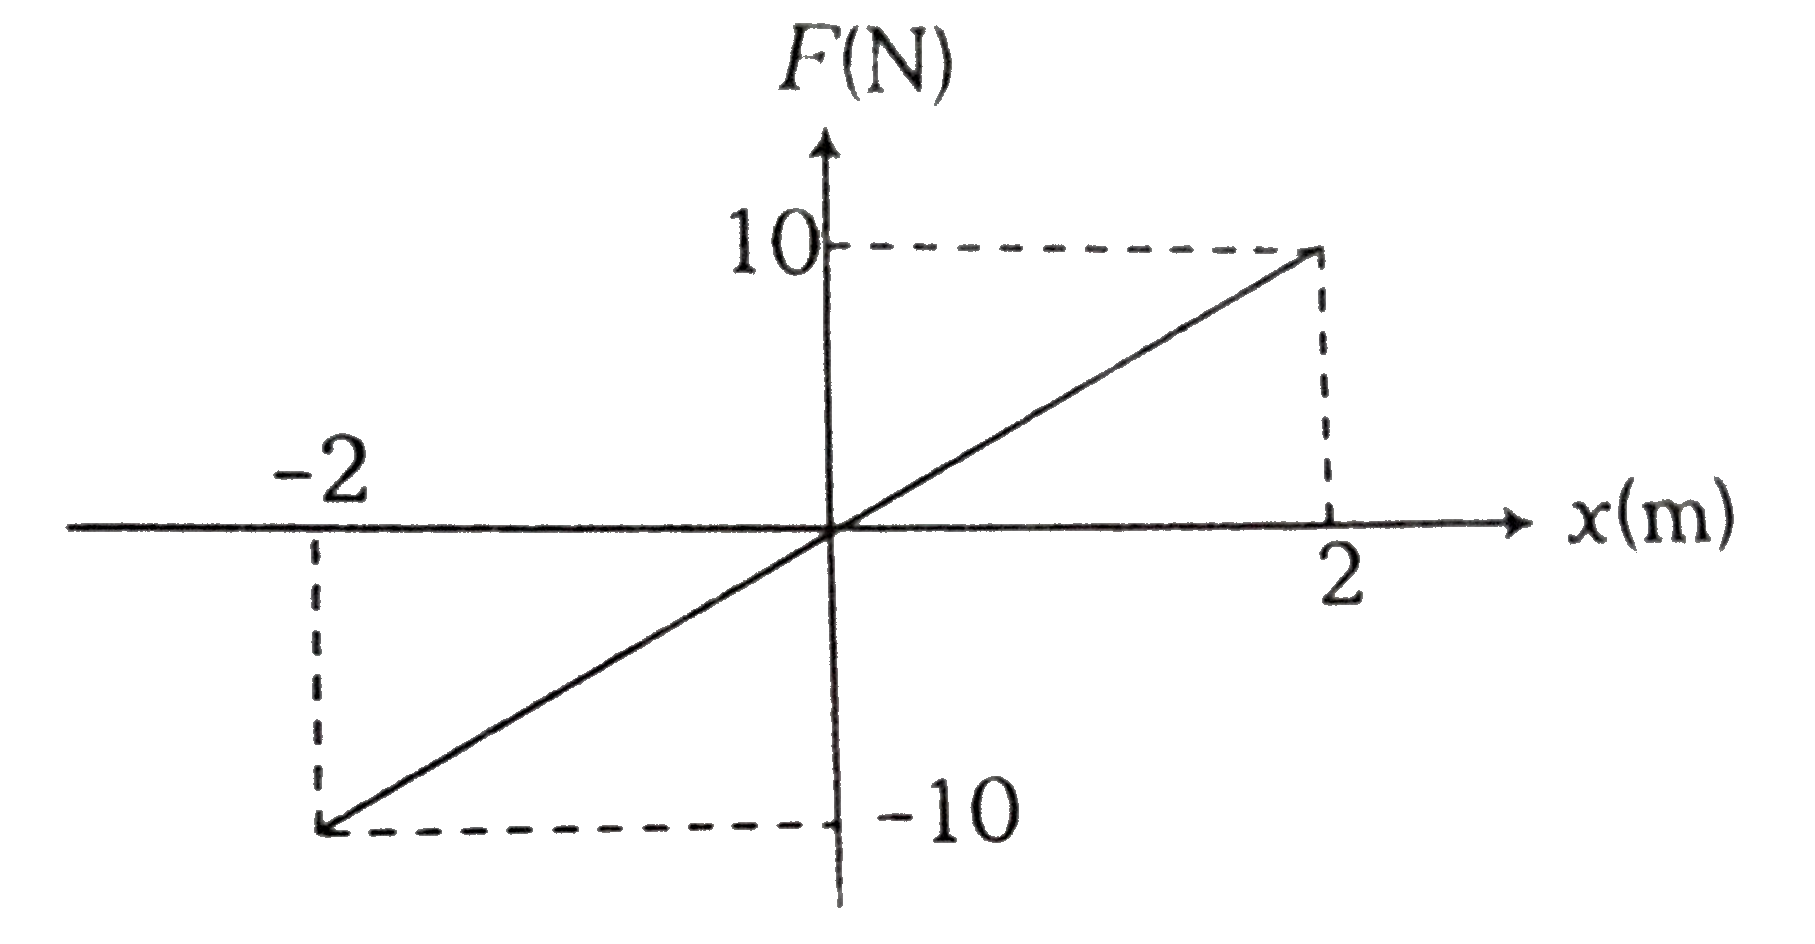
View SolutionA force F acting on a particle varies with the position x as shown in figure. Find the work done by this force in displacing the particle from
View SolutionA force acting on an object of mass 500 g changes its speed from 200 cm/s to 0.2 m/s. The change in momentum is
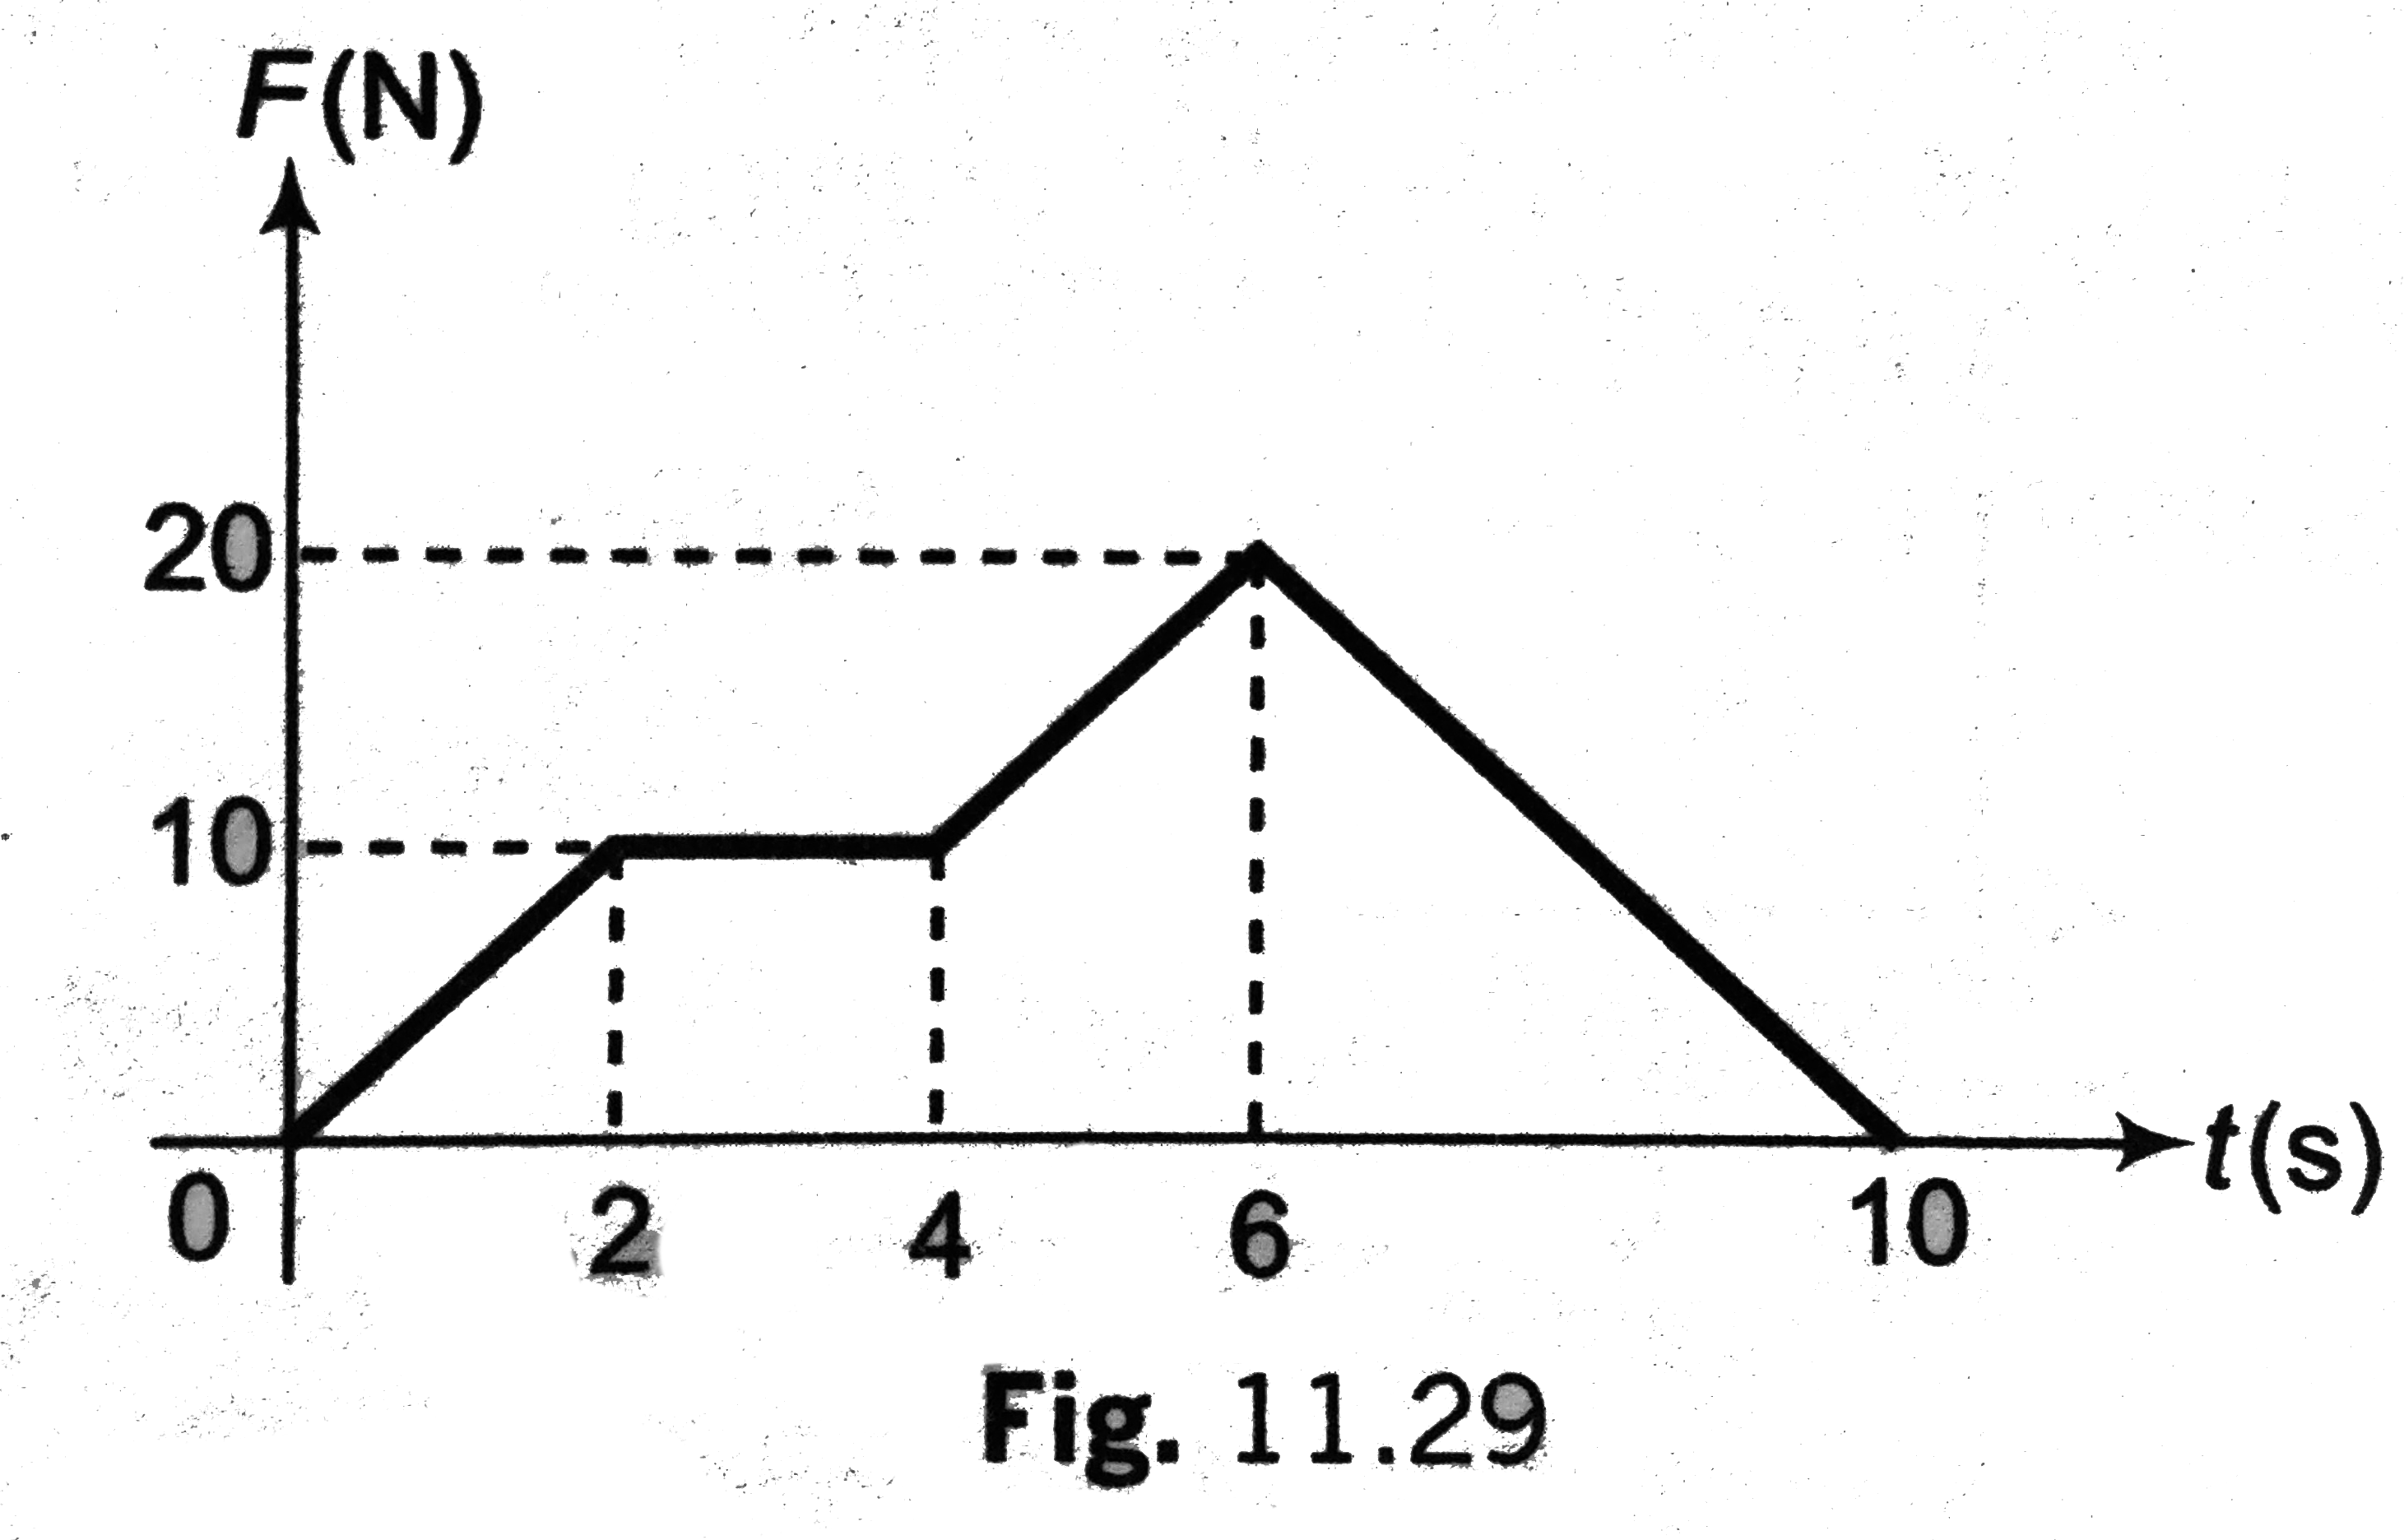
View SolutionA particle of mass 2kg is initially at rest. A force starts acting on it in one direction whose magnitude changes with time. The force time graph is shown in figure. Find the velocity of the particle at the end of 10s.
View Solution
