The force- time graph for a ball struck with a bat is as shown in Fig. 4.3.5. From the graph calculate.
The peak force exerted on the ball.
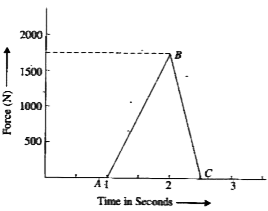
The peak force exerted on the ball =1875N from the graph.
Topper's Solved these Questions
- DYNAMICSBOOK - ICSECHAPTER - DYNAMICSEXERCISE - ADDITIONAL SOLVED PROBLEMS
138 Videos
- DYNAMICSBOOK - ICSECHAPTER - DYNAMICSEXERCISE - CONCEPTUAL SHORT ANSWER QUESTIONS WITH ANSWERS
20 Videos
- DIMENSIONSBOOK - ICSECHAPTER - DIMENSIONSEXERCISE - SELECTED PROBLEMS (FROM CONVERSIONS OF ONE SYSTEMS OF UNITS INTO ANOTHER)
9 Videos
- FRICTIONBOOK - ICSECHAPTER - FRICTIONEXERCISE - Selected problems
30 Videos
Similar Questions
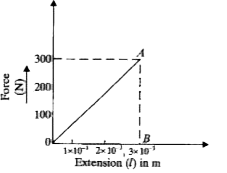
The force-extension graph of an elastic wire subjected to a certain force is as shown in Figure. From the graph calculate the work done in stretching the wire.
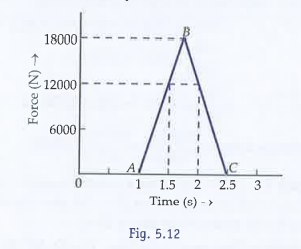
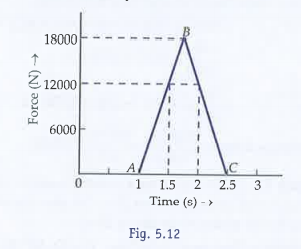
View SolutionFig. shows an estimated force-time graph for a base ball struck by a bat. From this curve, determine
(i) impulse delivered to the ball
(ii) force exerted on the ball
(iii) the maximum force on the ball.
View Solution
Knowledge Check
The following problems illustrate the effect of a time-dependent force of a large average magnitude which acts on a moving object only for a short duration. Such forces are called 'impulsive' forces. According to the impulse-momentum theorem, impulse delivered to a body is equal to the change of linear momentum of the body.
A ball of mass 250g is thrown with a speed of 30m/s. The ball strikes a bat and it is hit straight back along the same line at a speed of 50m/s. Variation of the interaction force, as long as the ball remains in contact with the bat, is as shown in Fig.
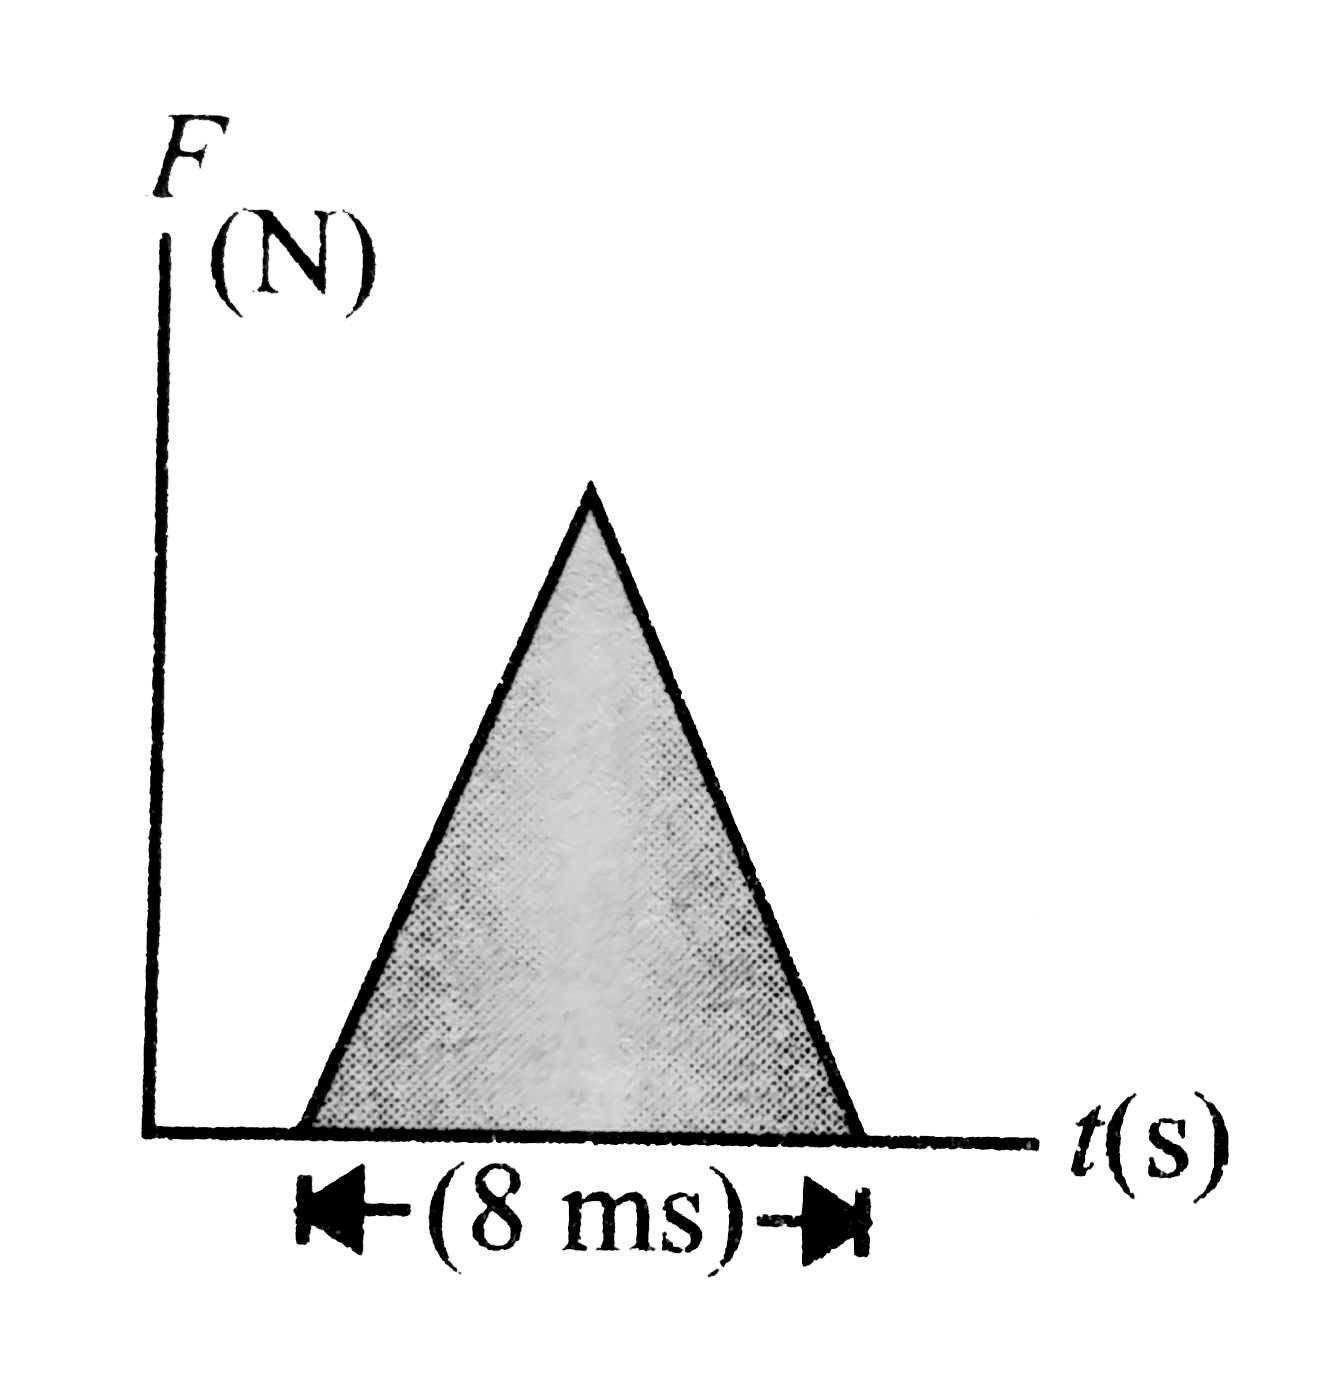
Average force exerted by the bat on the ball is
Let us consider another example. The given ball of mass 250g is dropped from a height 5m on a hard floor. Force exerted by the floor on the ball, as long as these are in contact, varies with time as shown in Fig.
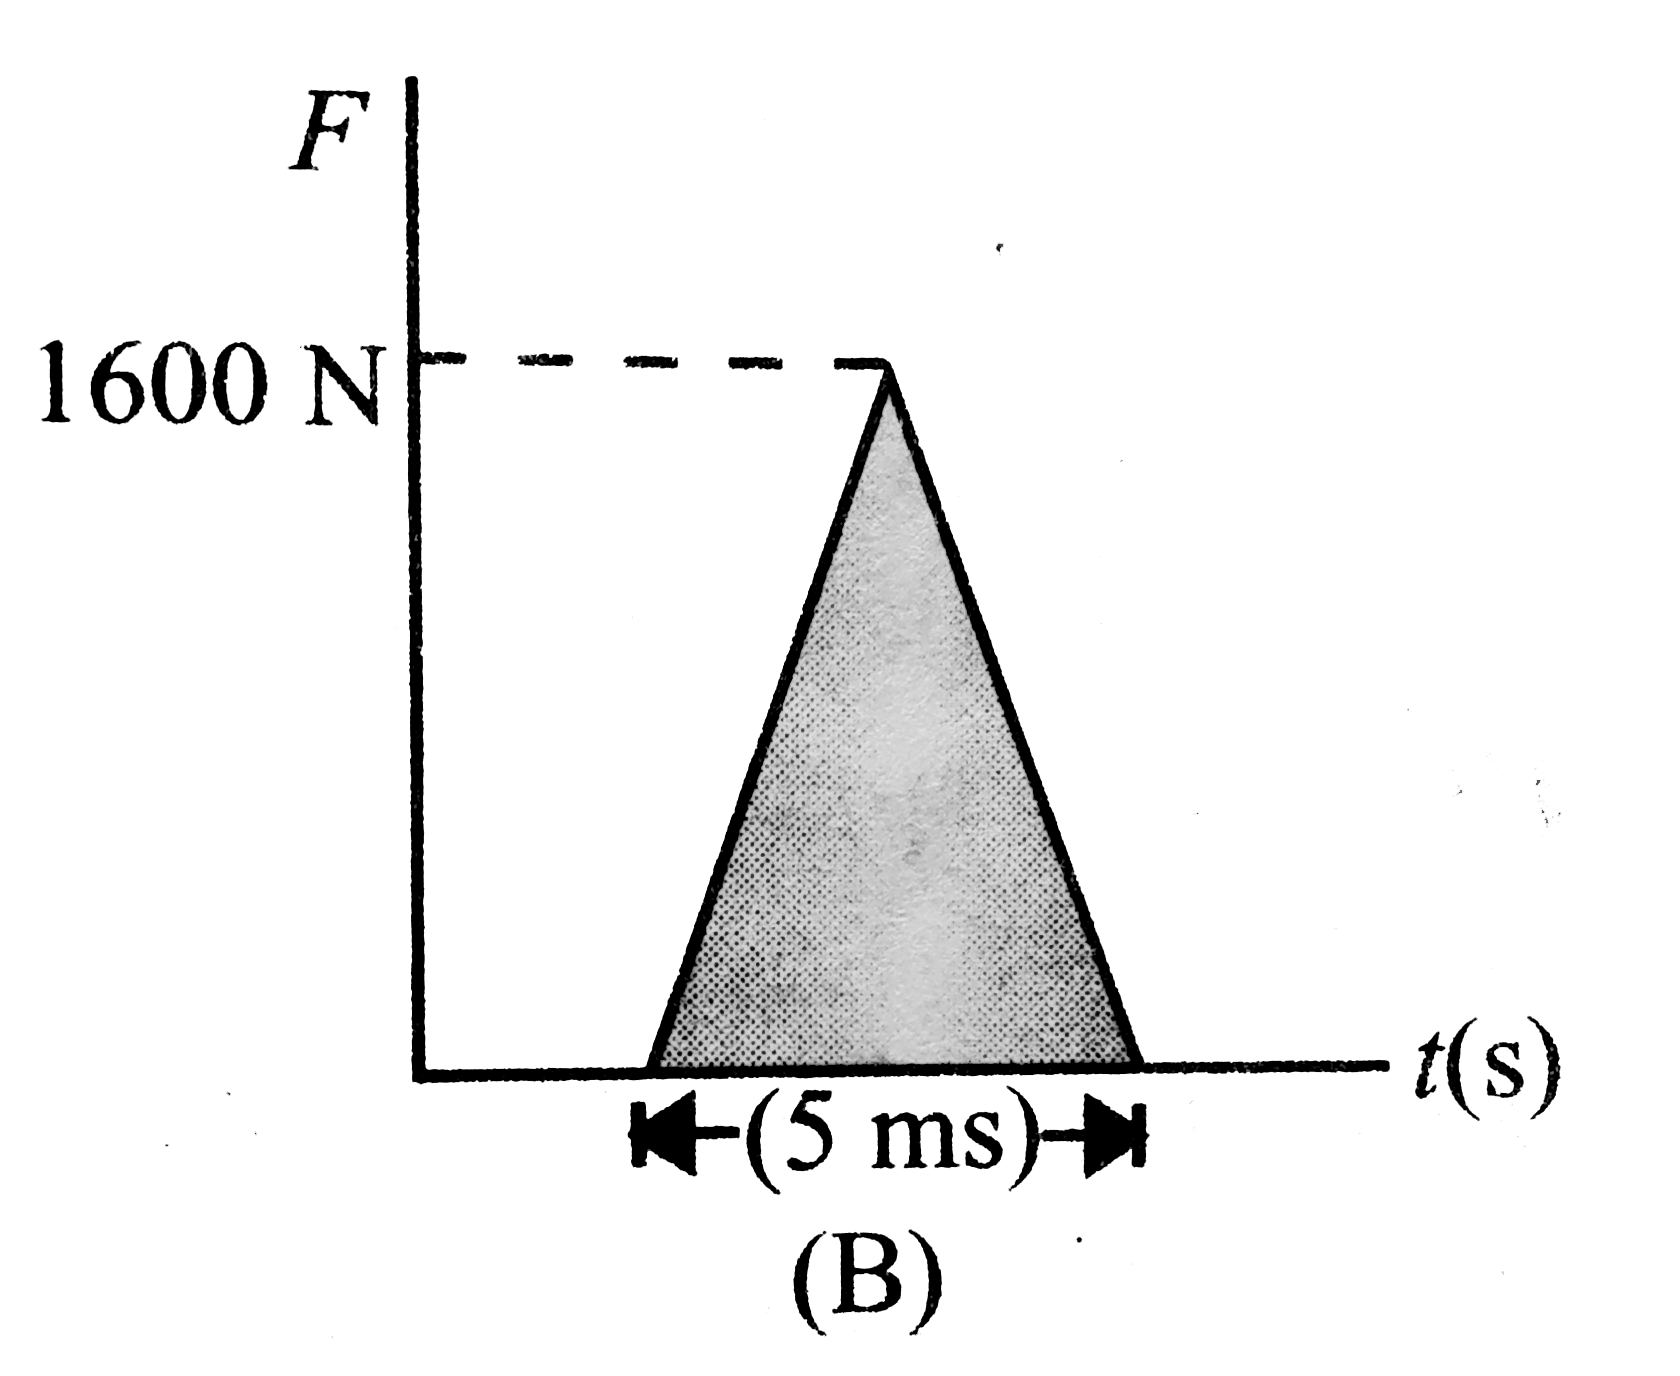 A5000NB1250NC2500ND7500N
The speed -time graph of the ball in the above situation is.
A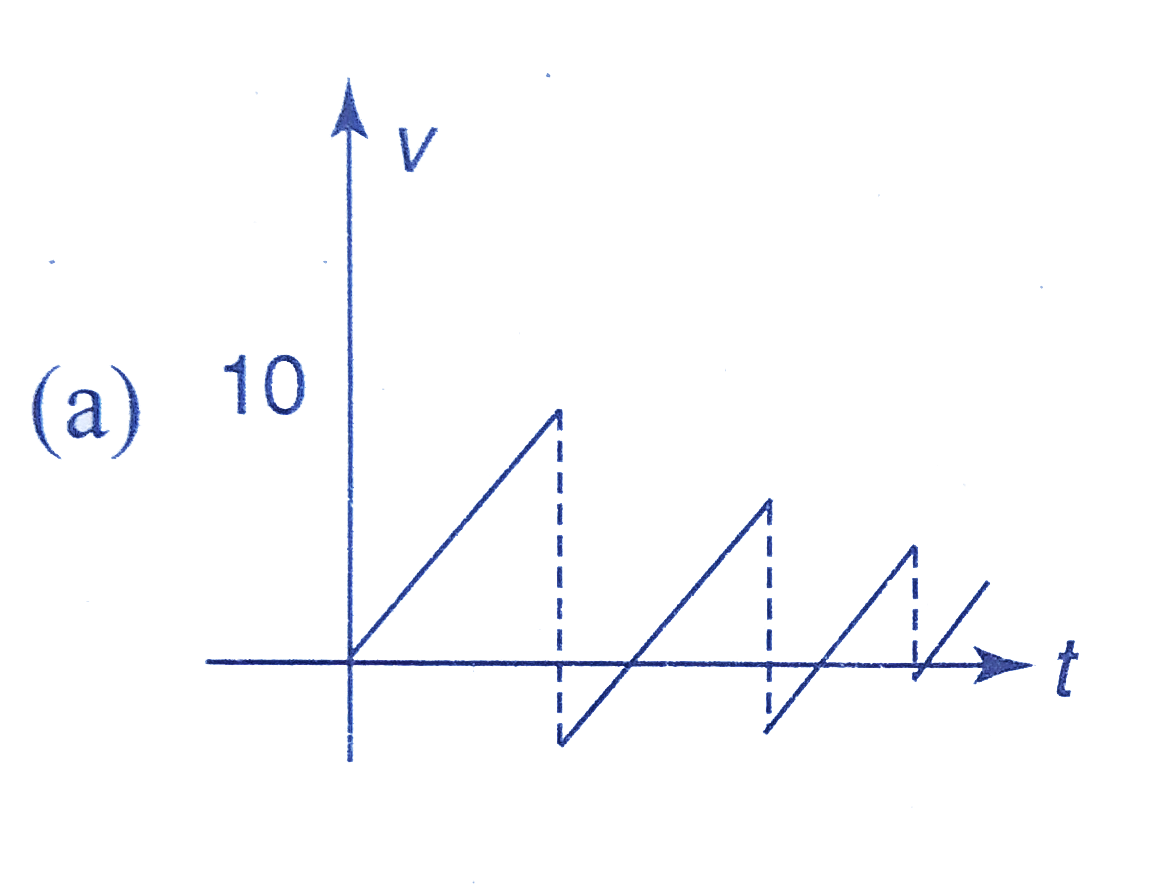 .B
.B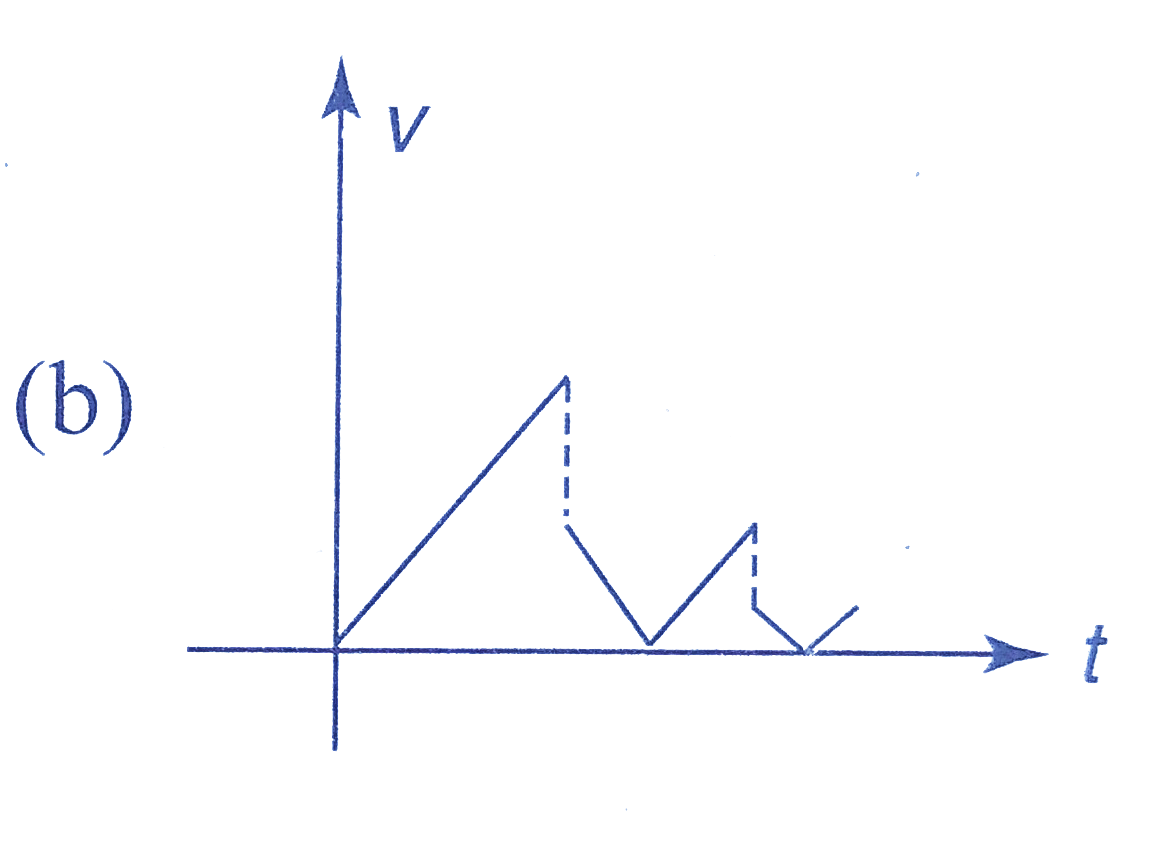 .C
.C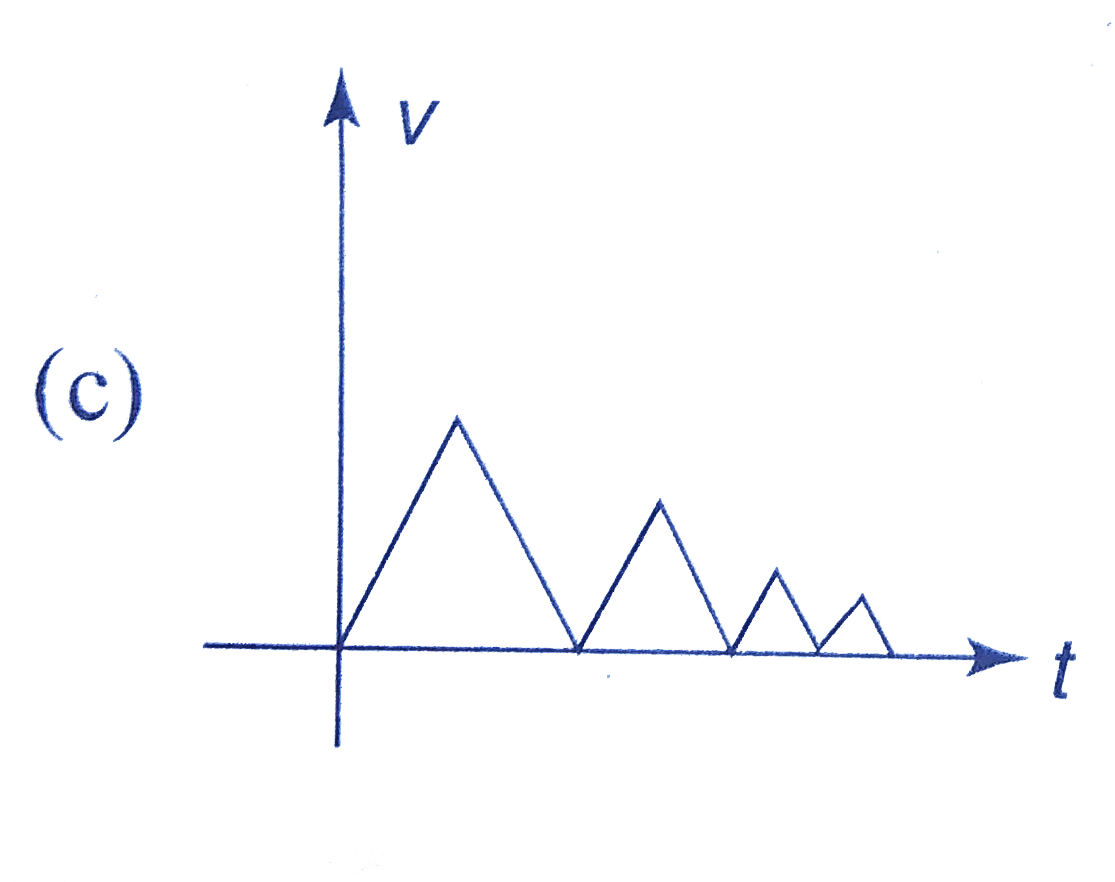 .D
.D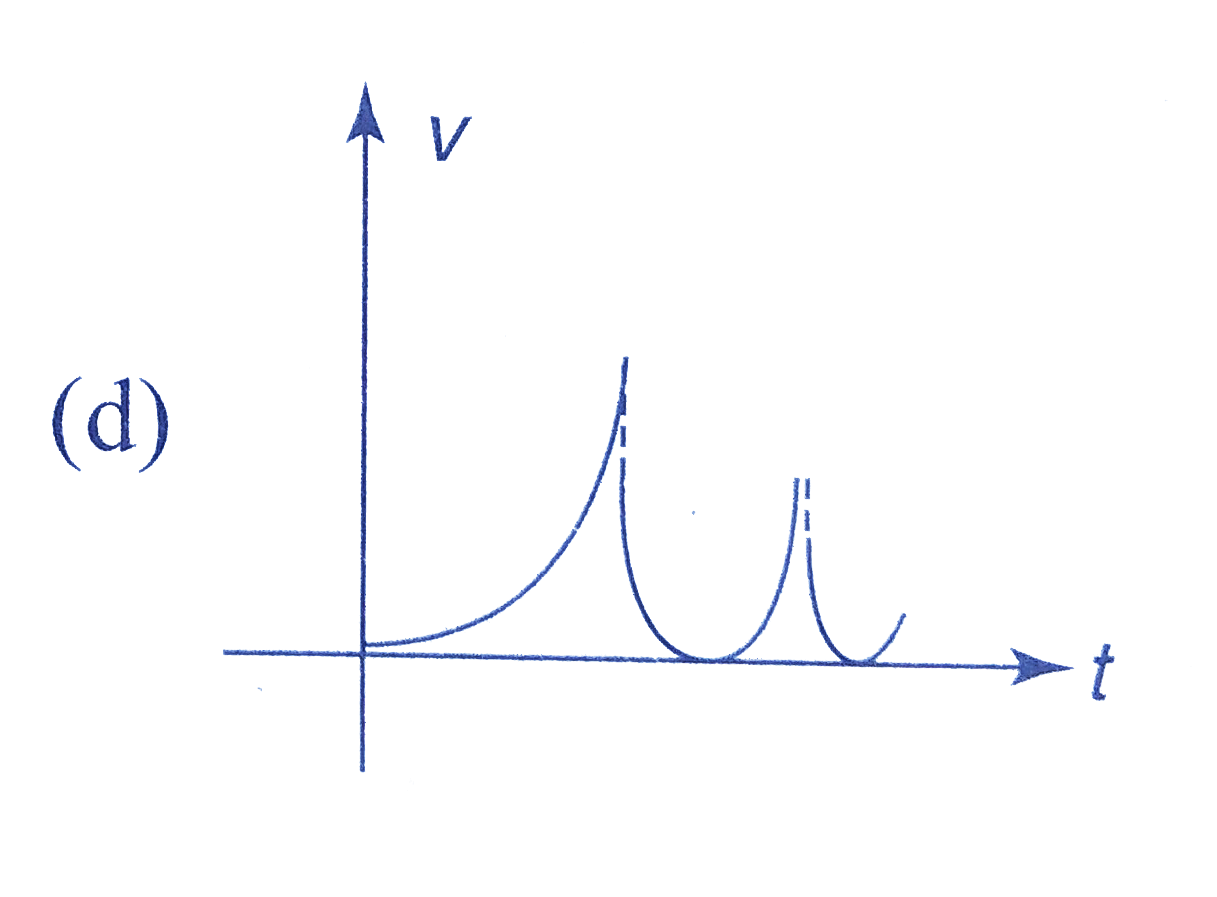 .
.The velocity-time graph of a ball moving on the surface of a floor as shown in figure. Calculate the force acting on the force acting on the ball, if mass of the ball is 200g.
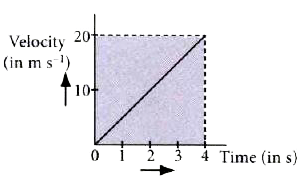 A2 NB5 NC1 ND3 N
The distance versus time graph of a ball moving with a constant speed is shown in the given graph.
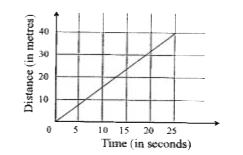
View SolutionFig.5.12 shows an estimated force-time graph for a base ball struck by a bat. From the curve, determine: Force exerted on the ball.
View SolutionThe speed -time graph of the ball in the above situation is.
View SolutionFig.5.12 shows an estimated force-time graph for a base ball struck by a bat. From the curve, determine: The maximum force on the ball.
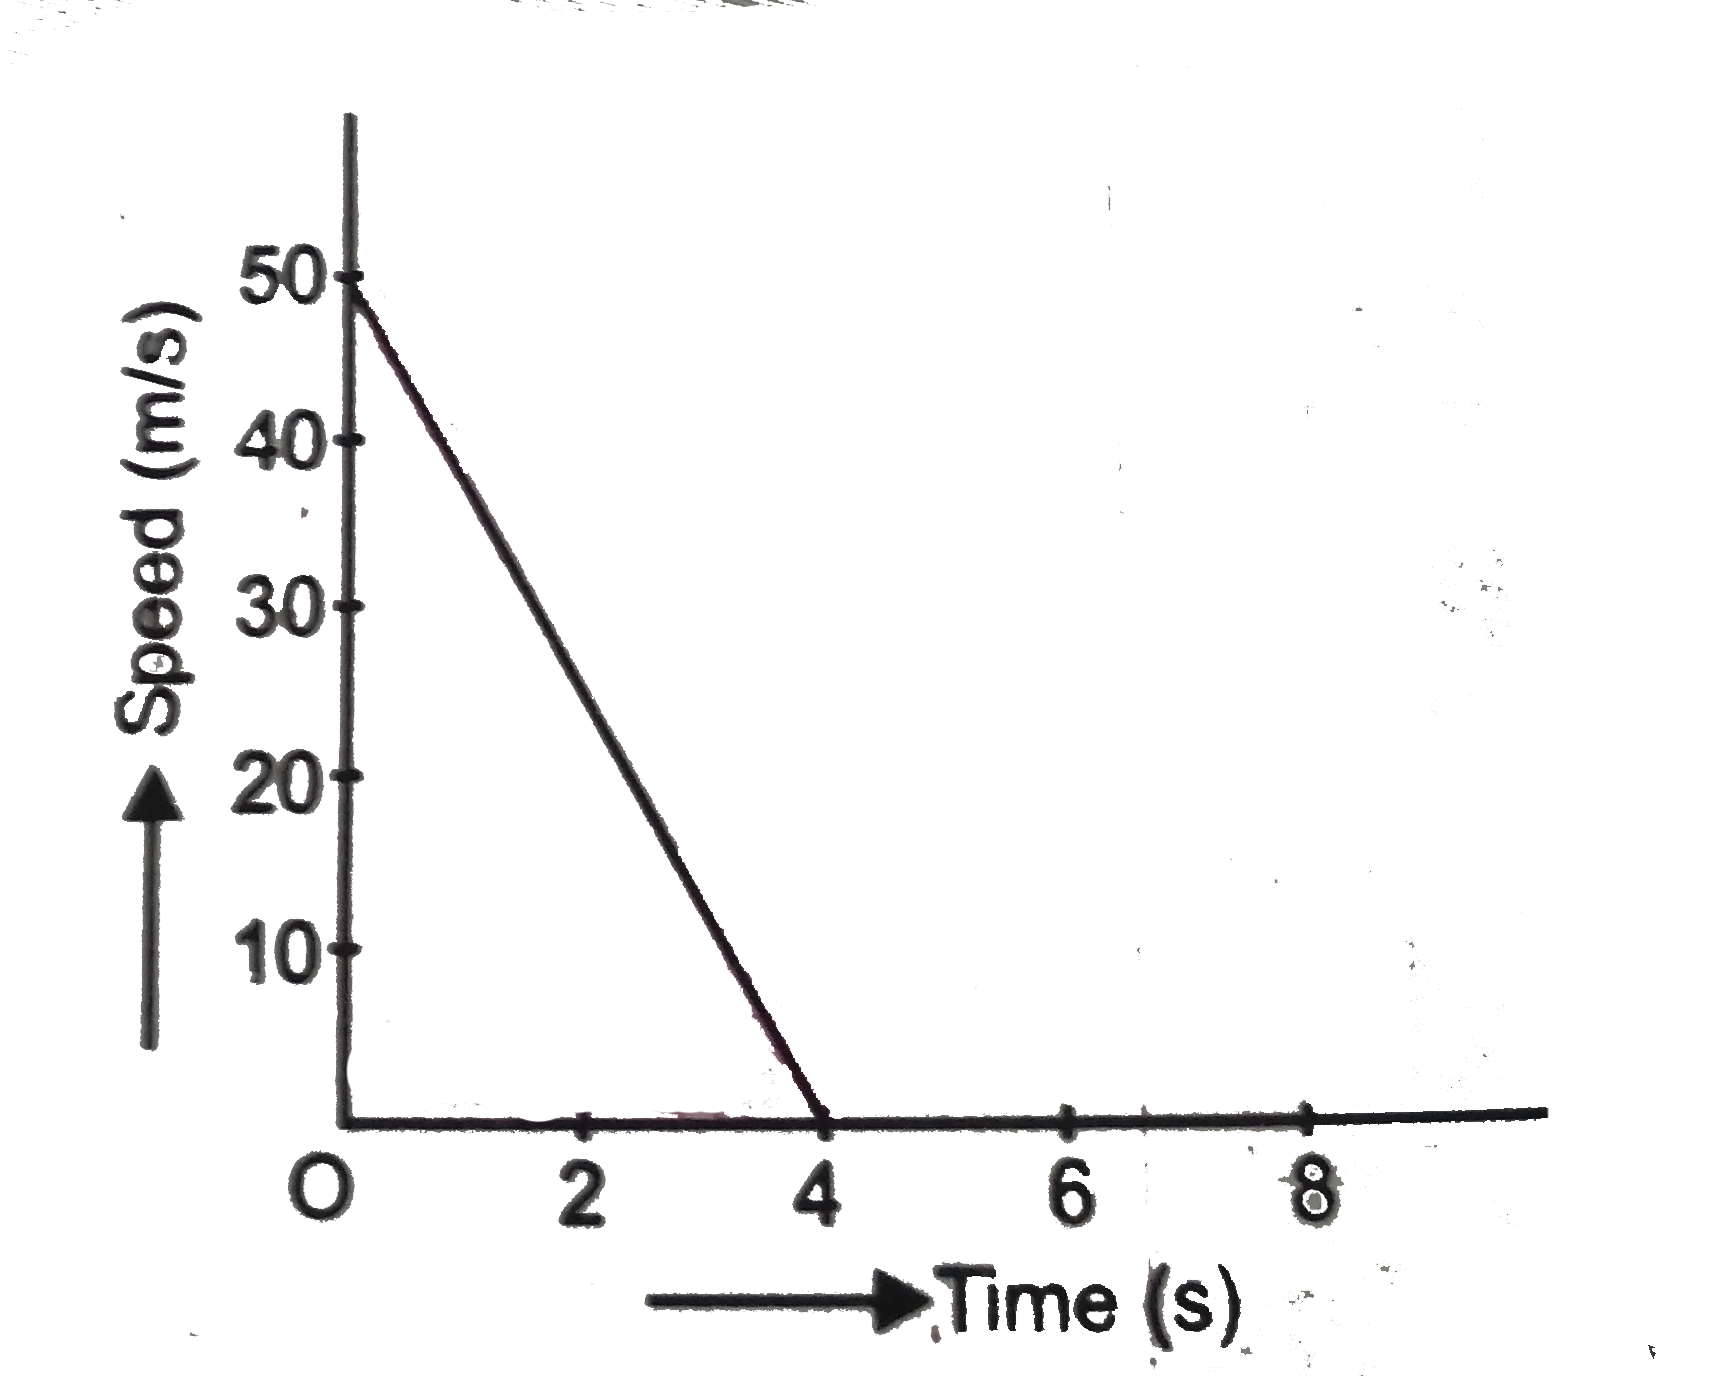
View SolutionThe speed time graph of a ball of mass 30g moving along a straight line is shown in (figure). Calculate the opposing force that brings the ball to rest.
View Solution
