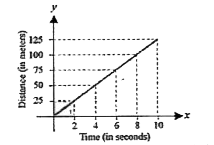
The distance versus time graph of a ball moving with a constant speed is shown in the given graph.
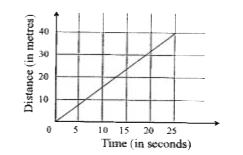
1.2m/s
1.6m/s
12.0m/s
16.0m/s
Step by step video & image solution for The distance versus time graph of a ball moving with a constant speed is shown in the given graph. by Physics experts to help you in doubts & scoring excellent marks in Class 7 exams.
Updated on:21/07/2023Topper's Solved these Questions
- MOTIONBOOK - BEIITIANSCHAPTER - MOTIONEXERCISE - CONCEPTIVE WORKSHEET
20 Videos
- MOTIONBOOK - BEIITIANSCHAPTER - MOTIONEXERCISE - SUMMATIVE WORKSHEET
2 Videos
- MEASUREMENTBOOK - BEIITIANSCHAPTER - MEASUREMENTEXERCISE - IIT JEE WORKSHEET (IV INTEGER TYPE)
1 Videos
- SOUNDBOOK - BEIITIANSCHAPTER - SOUNDEXERCISE - IIT JEE Worksheet (V. Matrix Matching)
5 Videos
Similar Questions
Knowledge Check
The displacement versus time graph for a body moving in a straight line is shown in figure. Which of the following regions represents the motion when no force is acting on the body
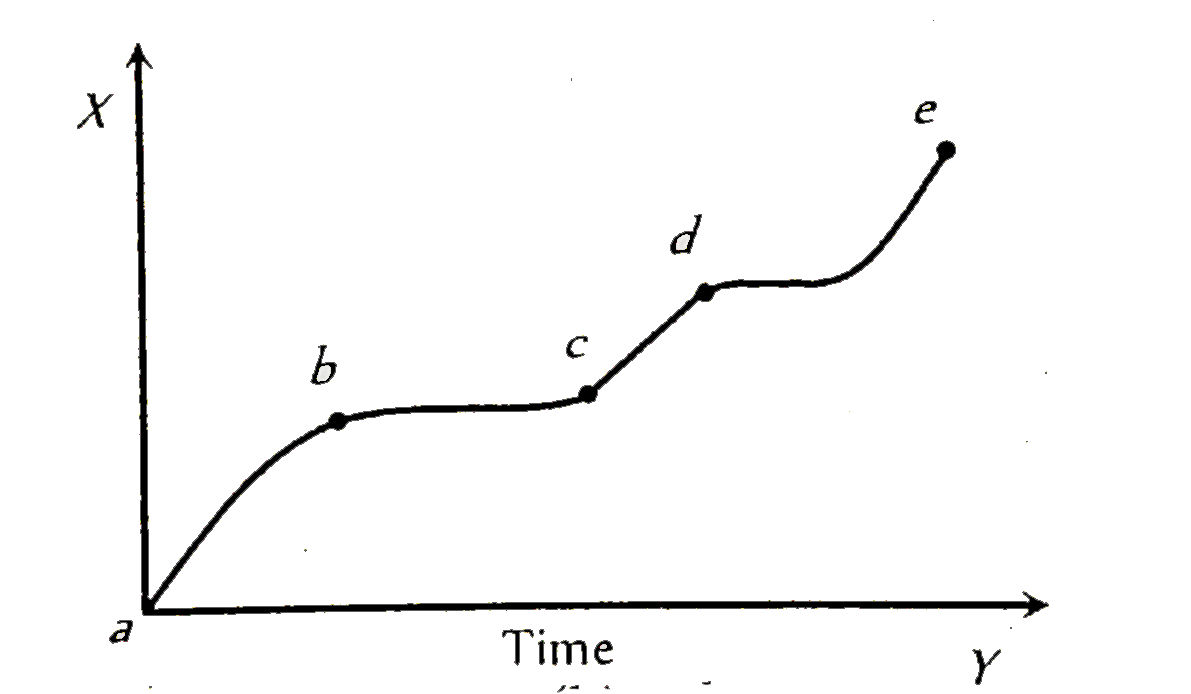 AabBbcCcdDde
The acceleration versus time graph of a particle moving in a straight line is show in figure. The velocity-time graph of the particle would be
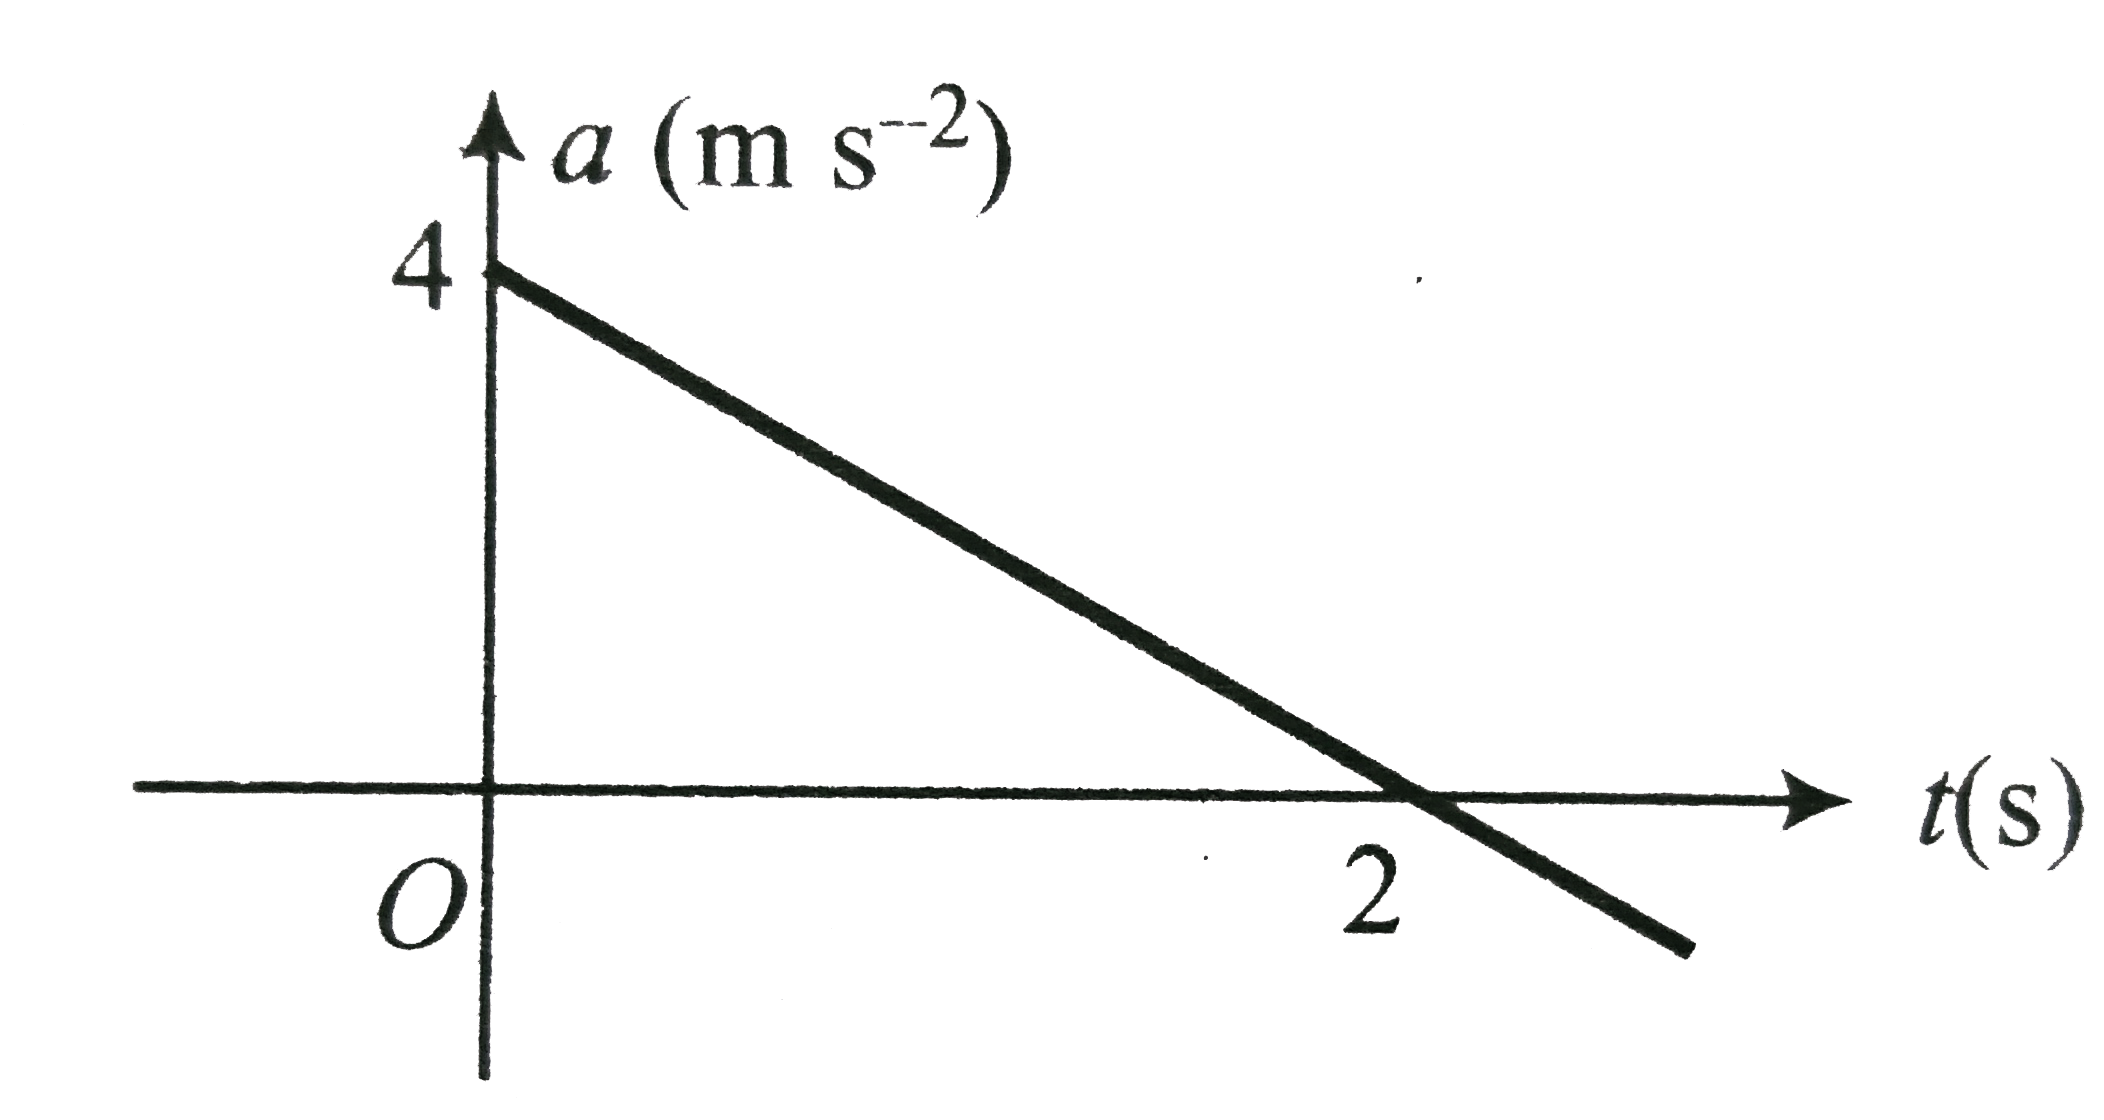 .AA straight lineBA parabolaCA circleDAn ellipse
The velocity versus time graph of a body moving in a straight line is as shown in the figure below
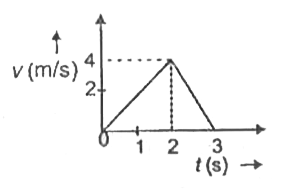 AThe distance covered by the body in 0 to 2s is 8mBThe acceleration of the body in 0 to 2s is 4ms−2CThe accelerationof the body in 2 to 3s is 4ms−2DThe distance moved by the body during 0 to 3 is 6 m
The distance-time graph of the motion of an object moving with a contant speed is a straight line.
View SolutionThe acceleration versus time graph of a particle moving along a straight line is shown in the figure. Draw the respective velocity-time graph Given v=0 at t=0.
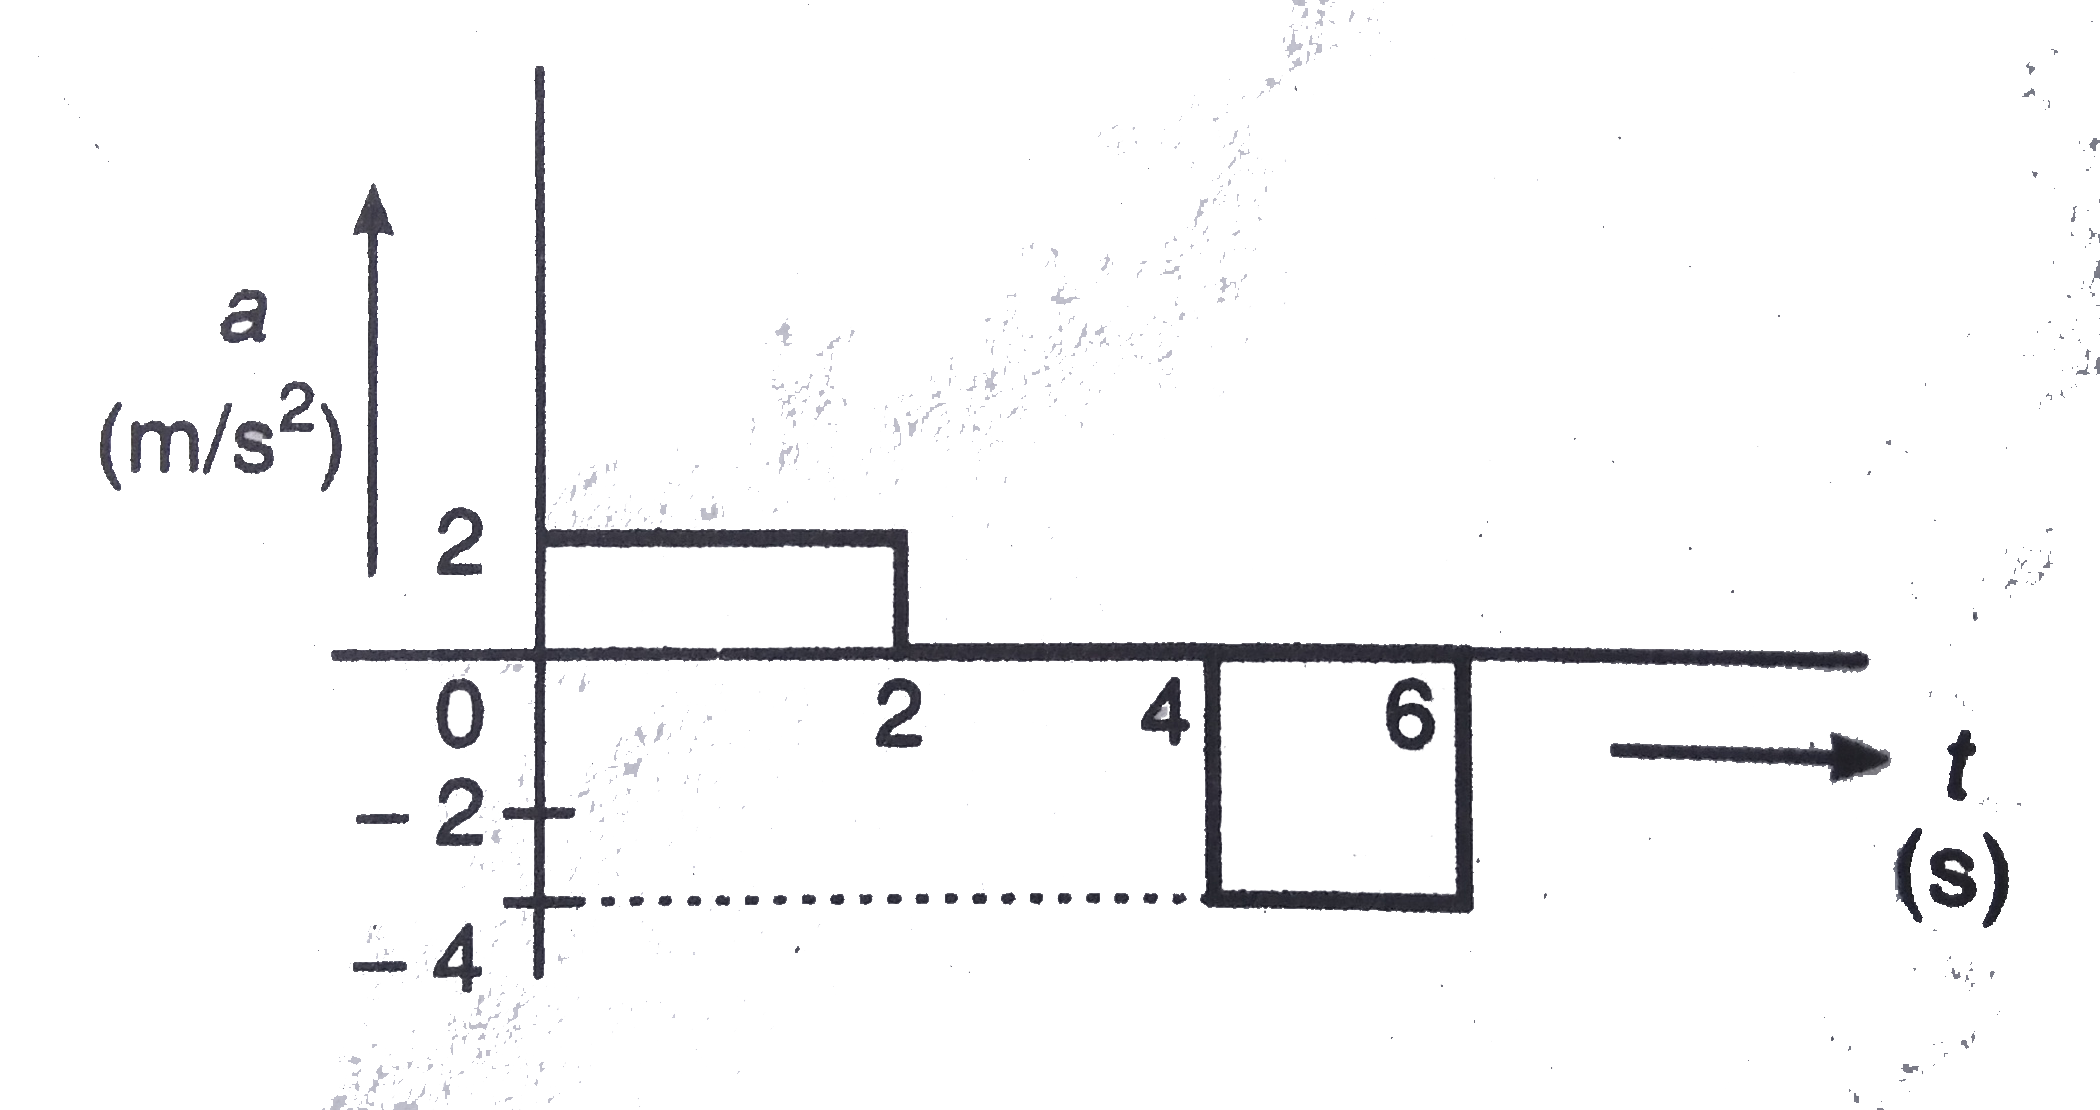
View SolutionThe distance -time graph of a body moving in a straight line is shown below. Draw the speed time graph of the motion of the body.
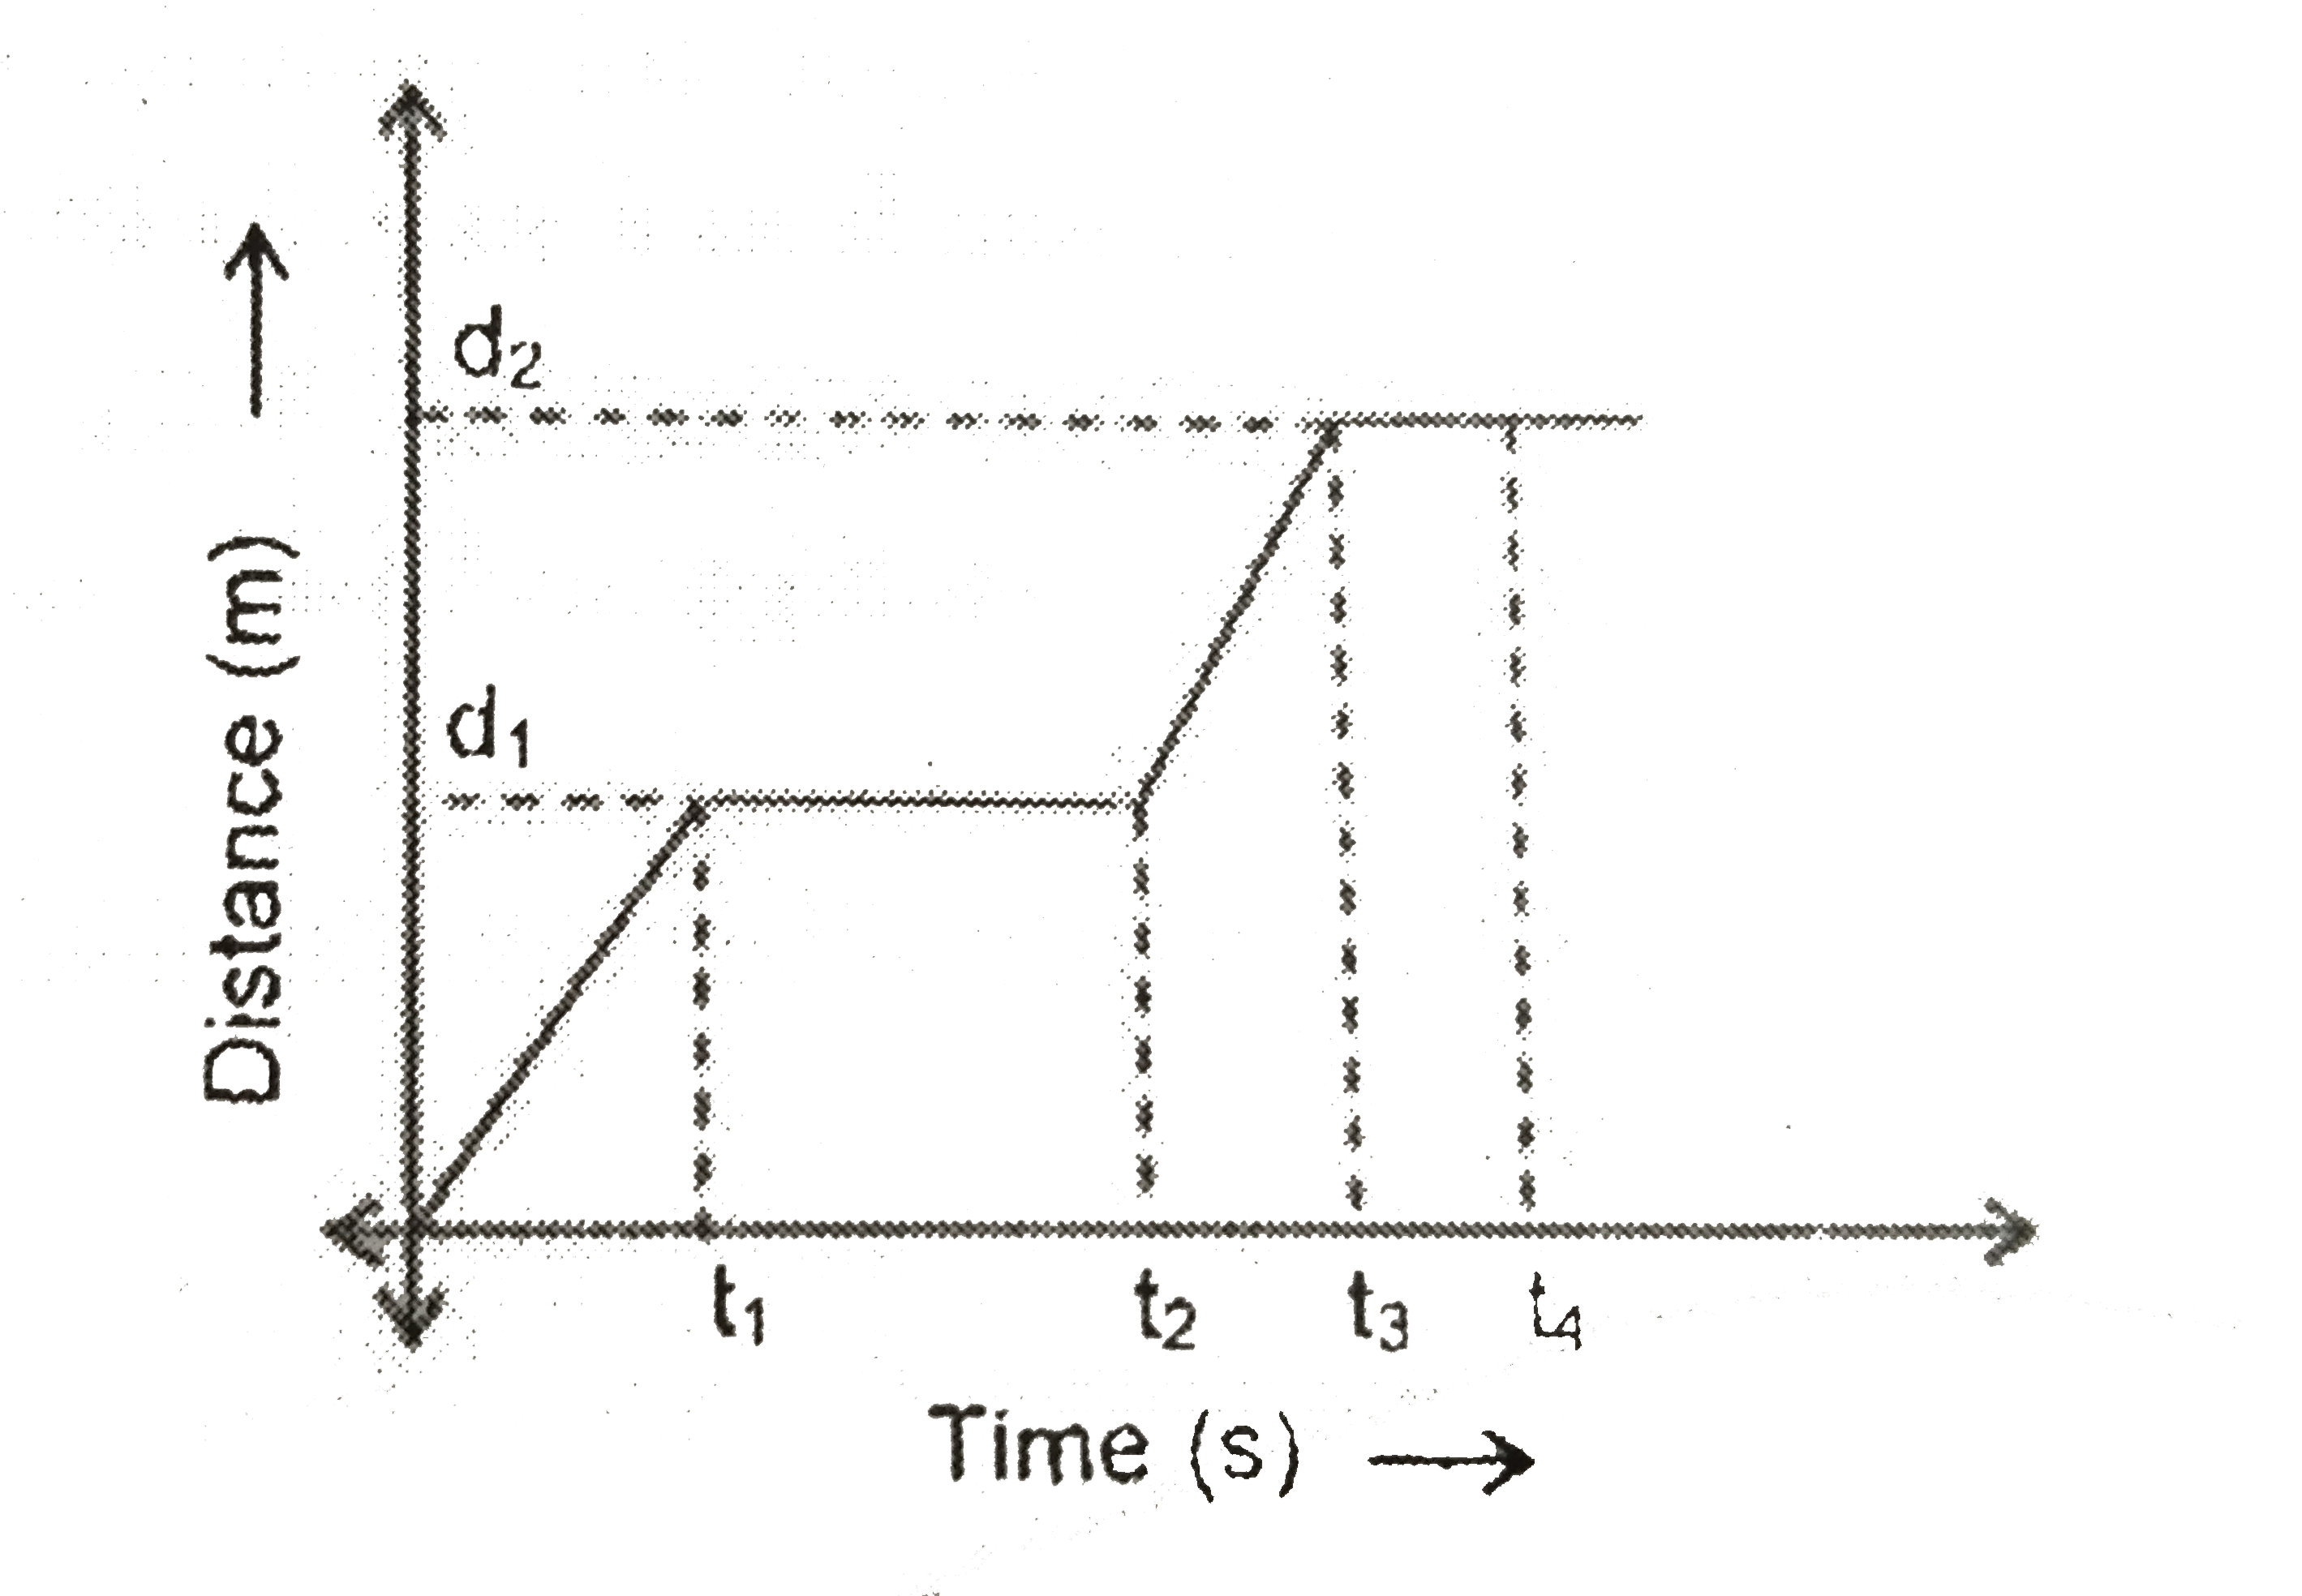
View SolutionThe distance -time graph of a body moving in a straight line is shown below. Draw the speed time graph of the motion of the body.

View SolutionThe distance-time graph of the motion of an object moving with a contant speed is a straight line.
View Solution

