The given figure shows the heating curve of a substance.
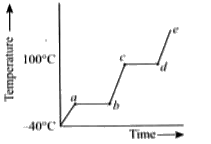
Straight parts ab and cd of the curve show that
No heating is done during this period
Heat energy is used to overcome the forces of attraction between the particles
Thermometer showed some error during this period
Energy of particles of the substance is zero during this period.
The correct Answer is:B
Straight parts ab and cd show that temperature remains constant during this time period. It happens during phase change (from solid to liquid in ab and from liquid to vapour in cd.) as heat energy is used to overcome the forces of attraction between the particles and hence temperature does not change.
Topper's Solved these Questions
- BOOK - SCIENCE OLYMPIAD FOUNDATION CHAPTER - NSO QUESTION PAPER 2020-21 SET AEXERCISE - ACHIEVERS SECTION1videos
NSO QUESTION PAPER 2020-21 SET A
- BOOK - SCIENCE OLYMPIAD FOUNDATION CHAPTER - NSO QUESTION PAPER 2019-20 SET AEXERCISE - SCIENCE13videos
NSO QUESTION PAPER 2019-20 SET A
- BOOK - SCIENCE OLYMPIAD FOUNDATION CHAPTER - SOF NATIONAL SCIENCE OLYMPIAD 2020 PAPER EXERCISE - ACHIEVERS SECTION1videos
SOF NATIONAL SCIENCE OLYMPIAD 2020 PAPER
Similar Questions
Knowledge Check
- Question 1 - Select One
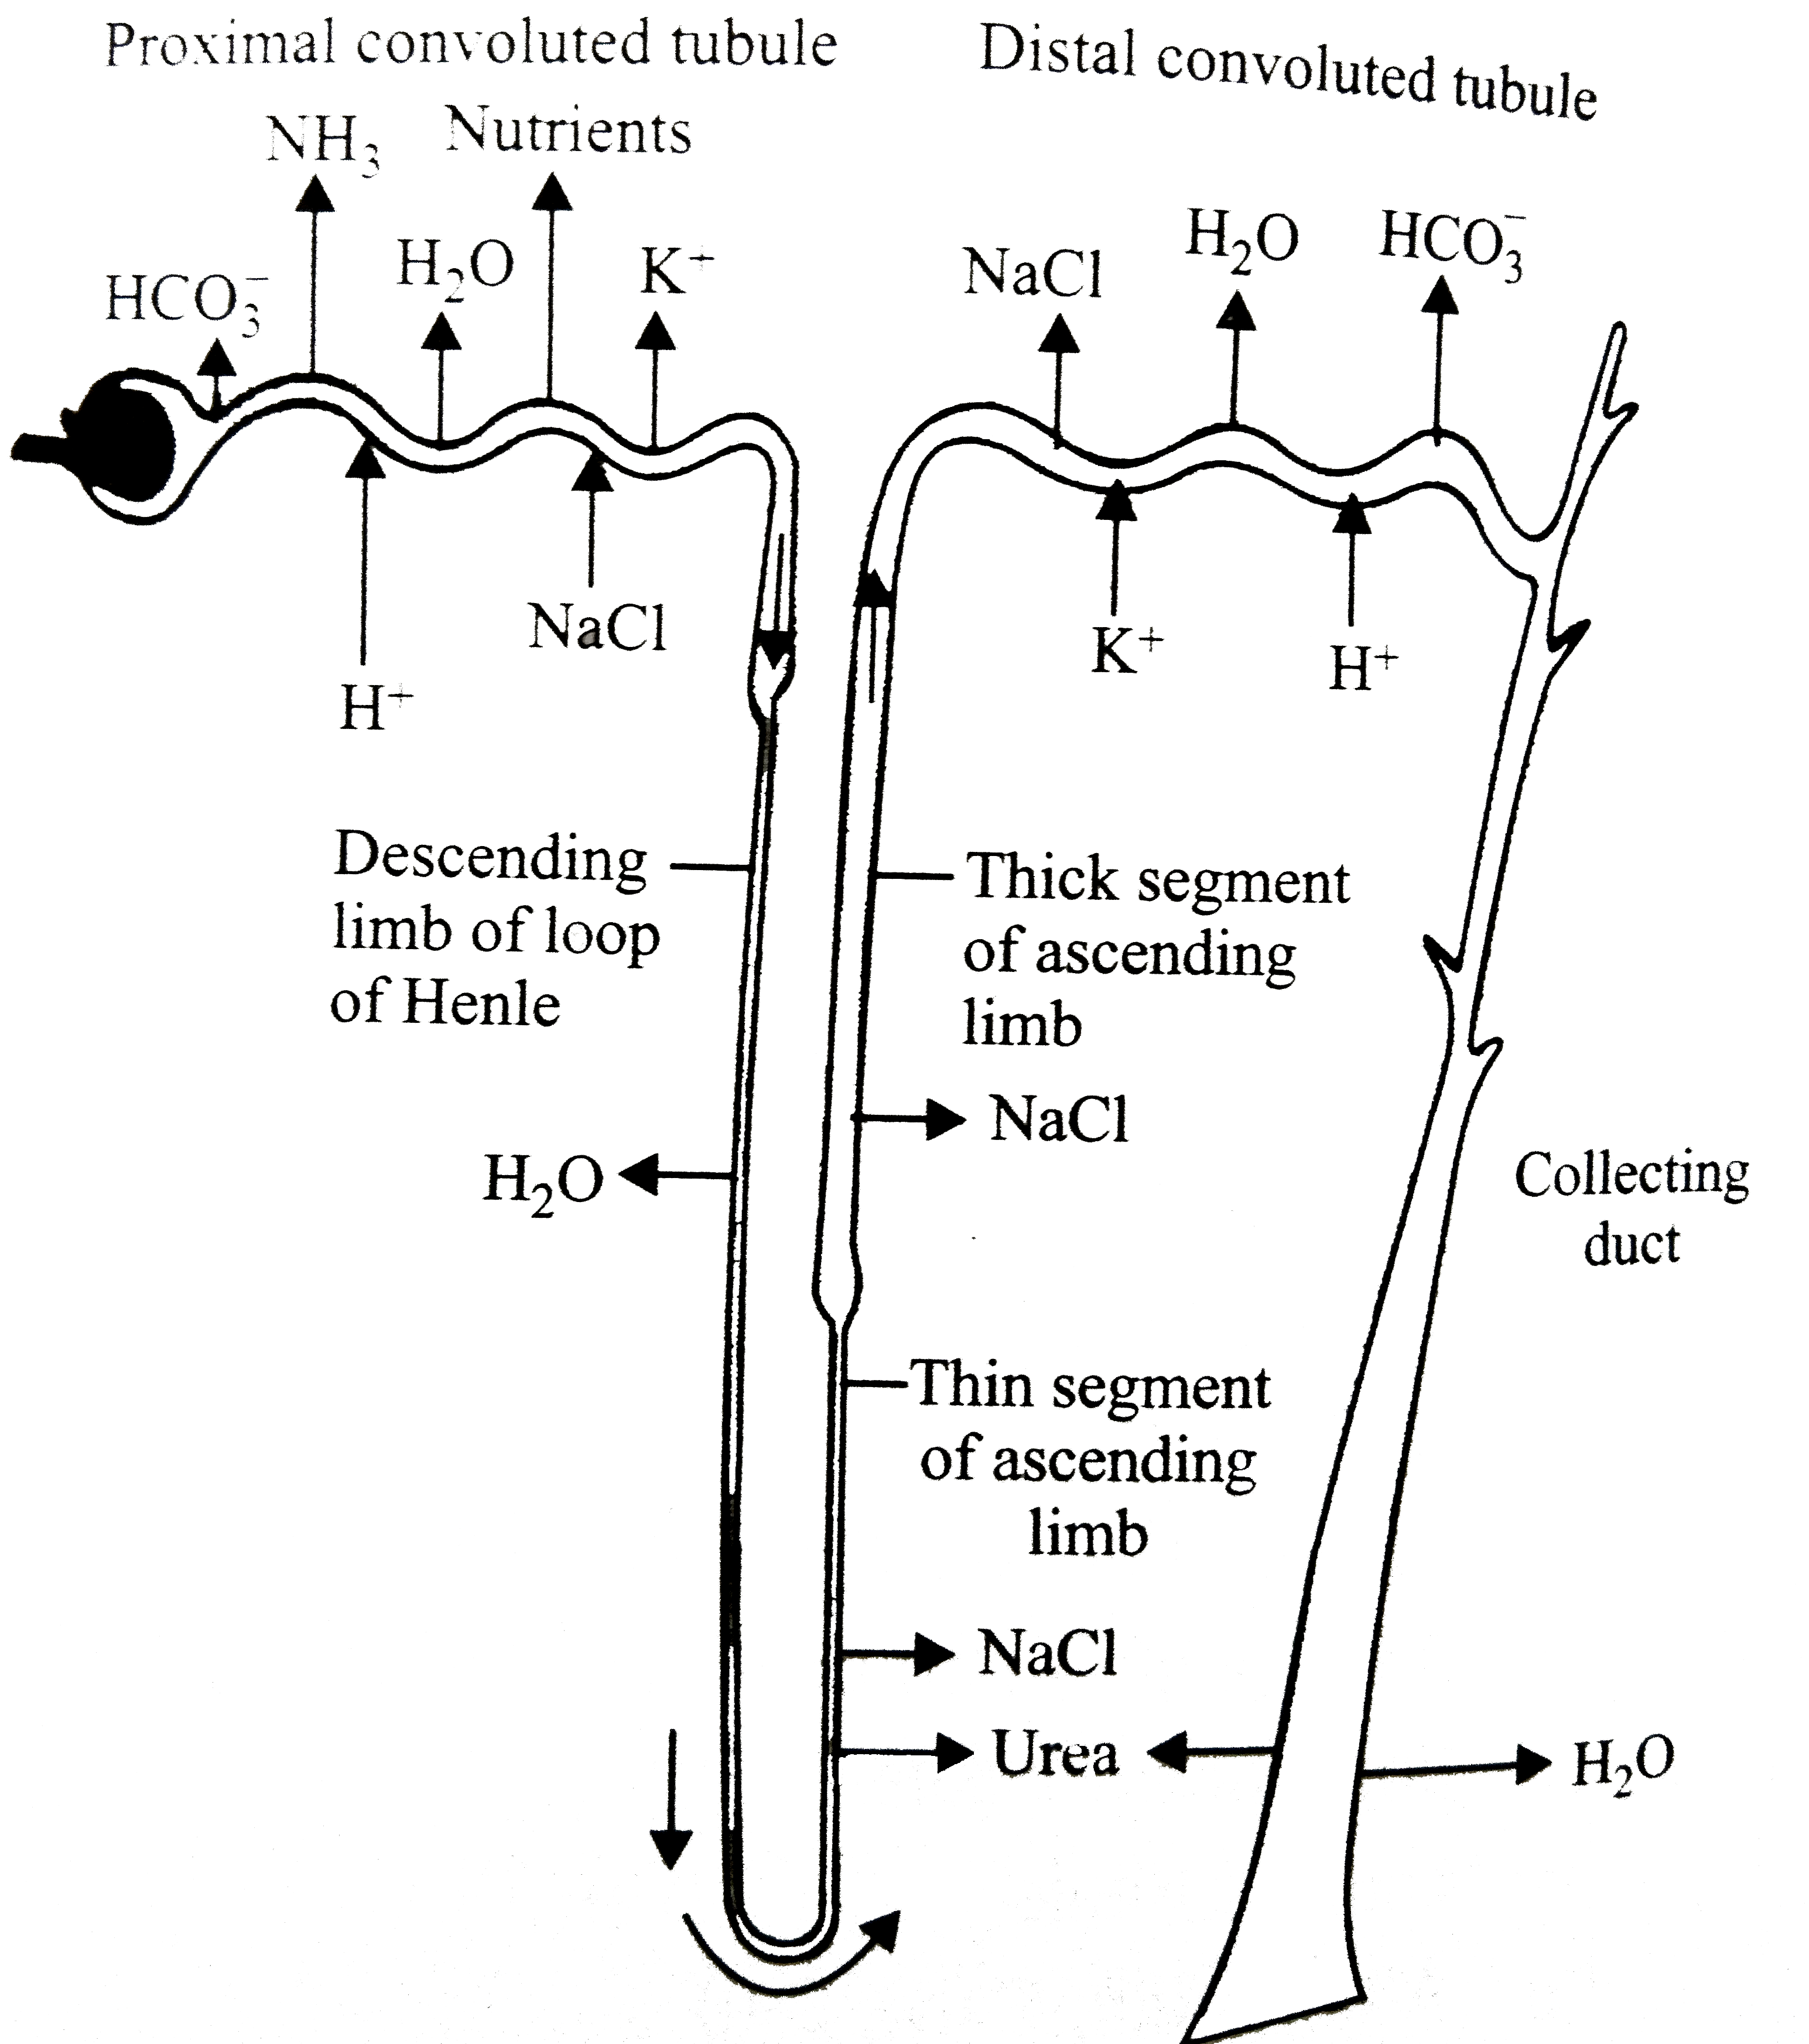
The given figure shows reabsorption and secretion of major substances at different parts of the nephron. The movelment of which of the following substances is wrongly depicted?ANaCl and K+ at DCTBNaCl and NH3 at PCTCNaCl at ascending limb of loop of HenleDH2O at descending limb of loop of Henle - Question 2 - Select One
The given figure shows the velocity versus time curve for a car traveling along a straight line. Which of the following statements is false ?
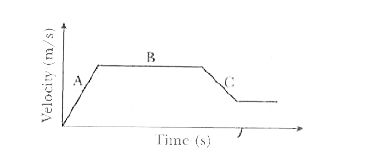 ANet forces act on the car during intervals A and C.BOpposing forces may be acting on the car during interval B.COpposing forces may be acting on the car during interval C.DThe magnitude of the net force acting duriing interval A is less then that during C.
 - Question 3 - Select One
Upward sloping supply curve shows that :
AWhen supply rises price risesBWhen supply falls price risesCWhen price rises supply risesDWhen supply rises price falls
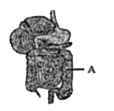
The given figure shows the digestive system. In the given figure, the part that is labeled A is the
 View Solution
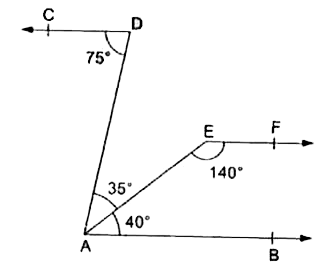
In Figure, show that AB∣∣EF
 View Solution
What does an indifference curve show ?
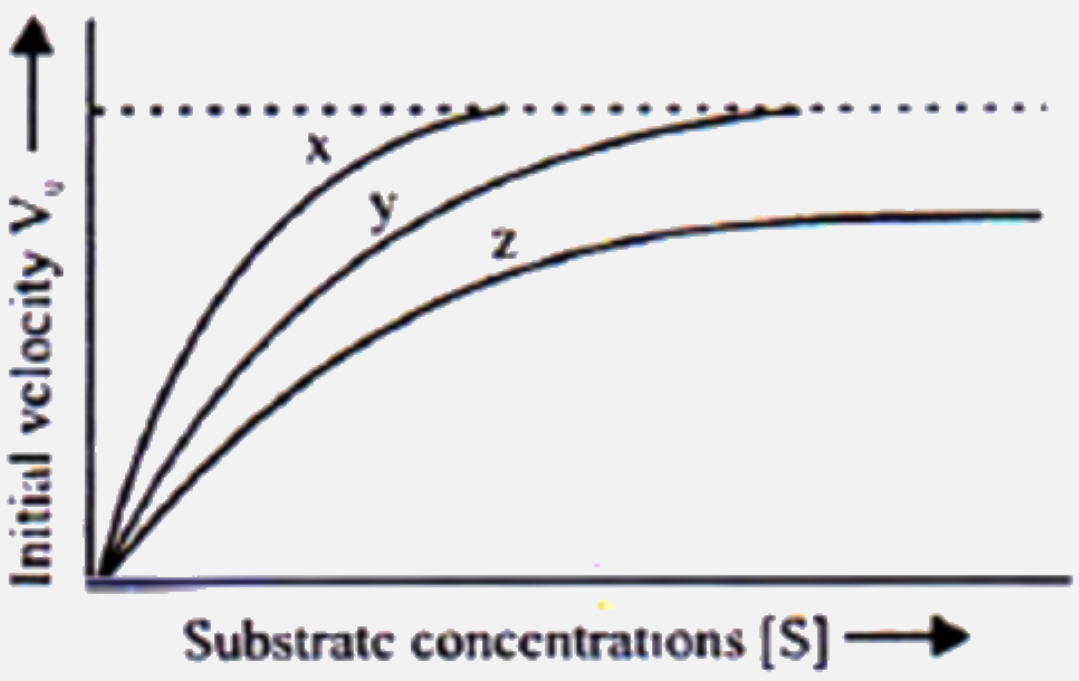
View SolutionThe Given figure shows three velocity-substrate concentration curves of an enzyme reaction. What do the curves X Y and Z depict respectively ?
 View Solution
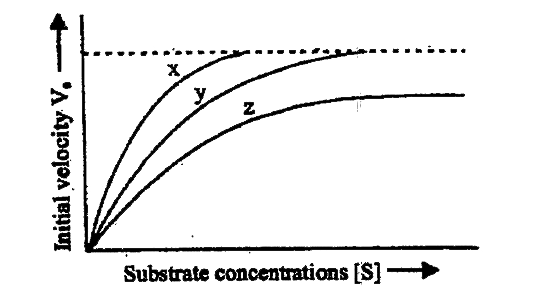
The given figure shows three velocity-substrate concentration curves for an enzyme reaction. What do the curves x, y and z depict respectively?
 View Solution

