The given graph shows variation of charge .q. versus potential difference .V. for two capacitors
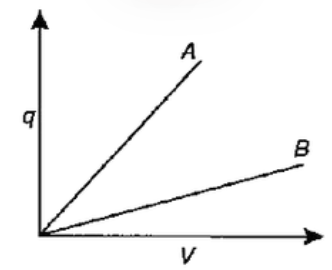
C1andC2. Both the capacitors have same plate separation but plate area of C2 is greater than that of C1. Which line (A or B) corresponds to C1 and why?
Step by step video & image solution for The given graph shows variation of charge .q. versus potential difference .V. for two capacitors C_(1)andC_(2). Both the capacitors have same plate separation but plate area of C_(2) is greater than that of C_(1). Which line (A or B) corresponds to C_(1) and why? by Physics experts to help you in doubts & scoring excellent marks in Class 12 exams.
Updated on:21/07/2023Similar Questions
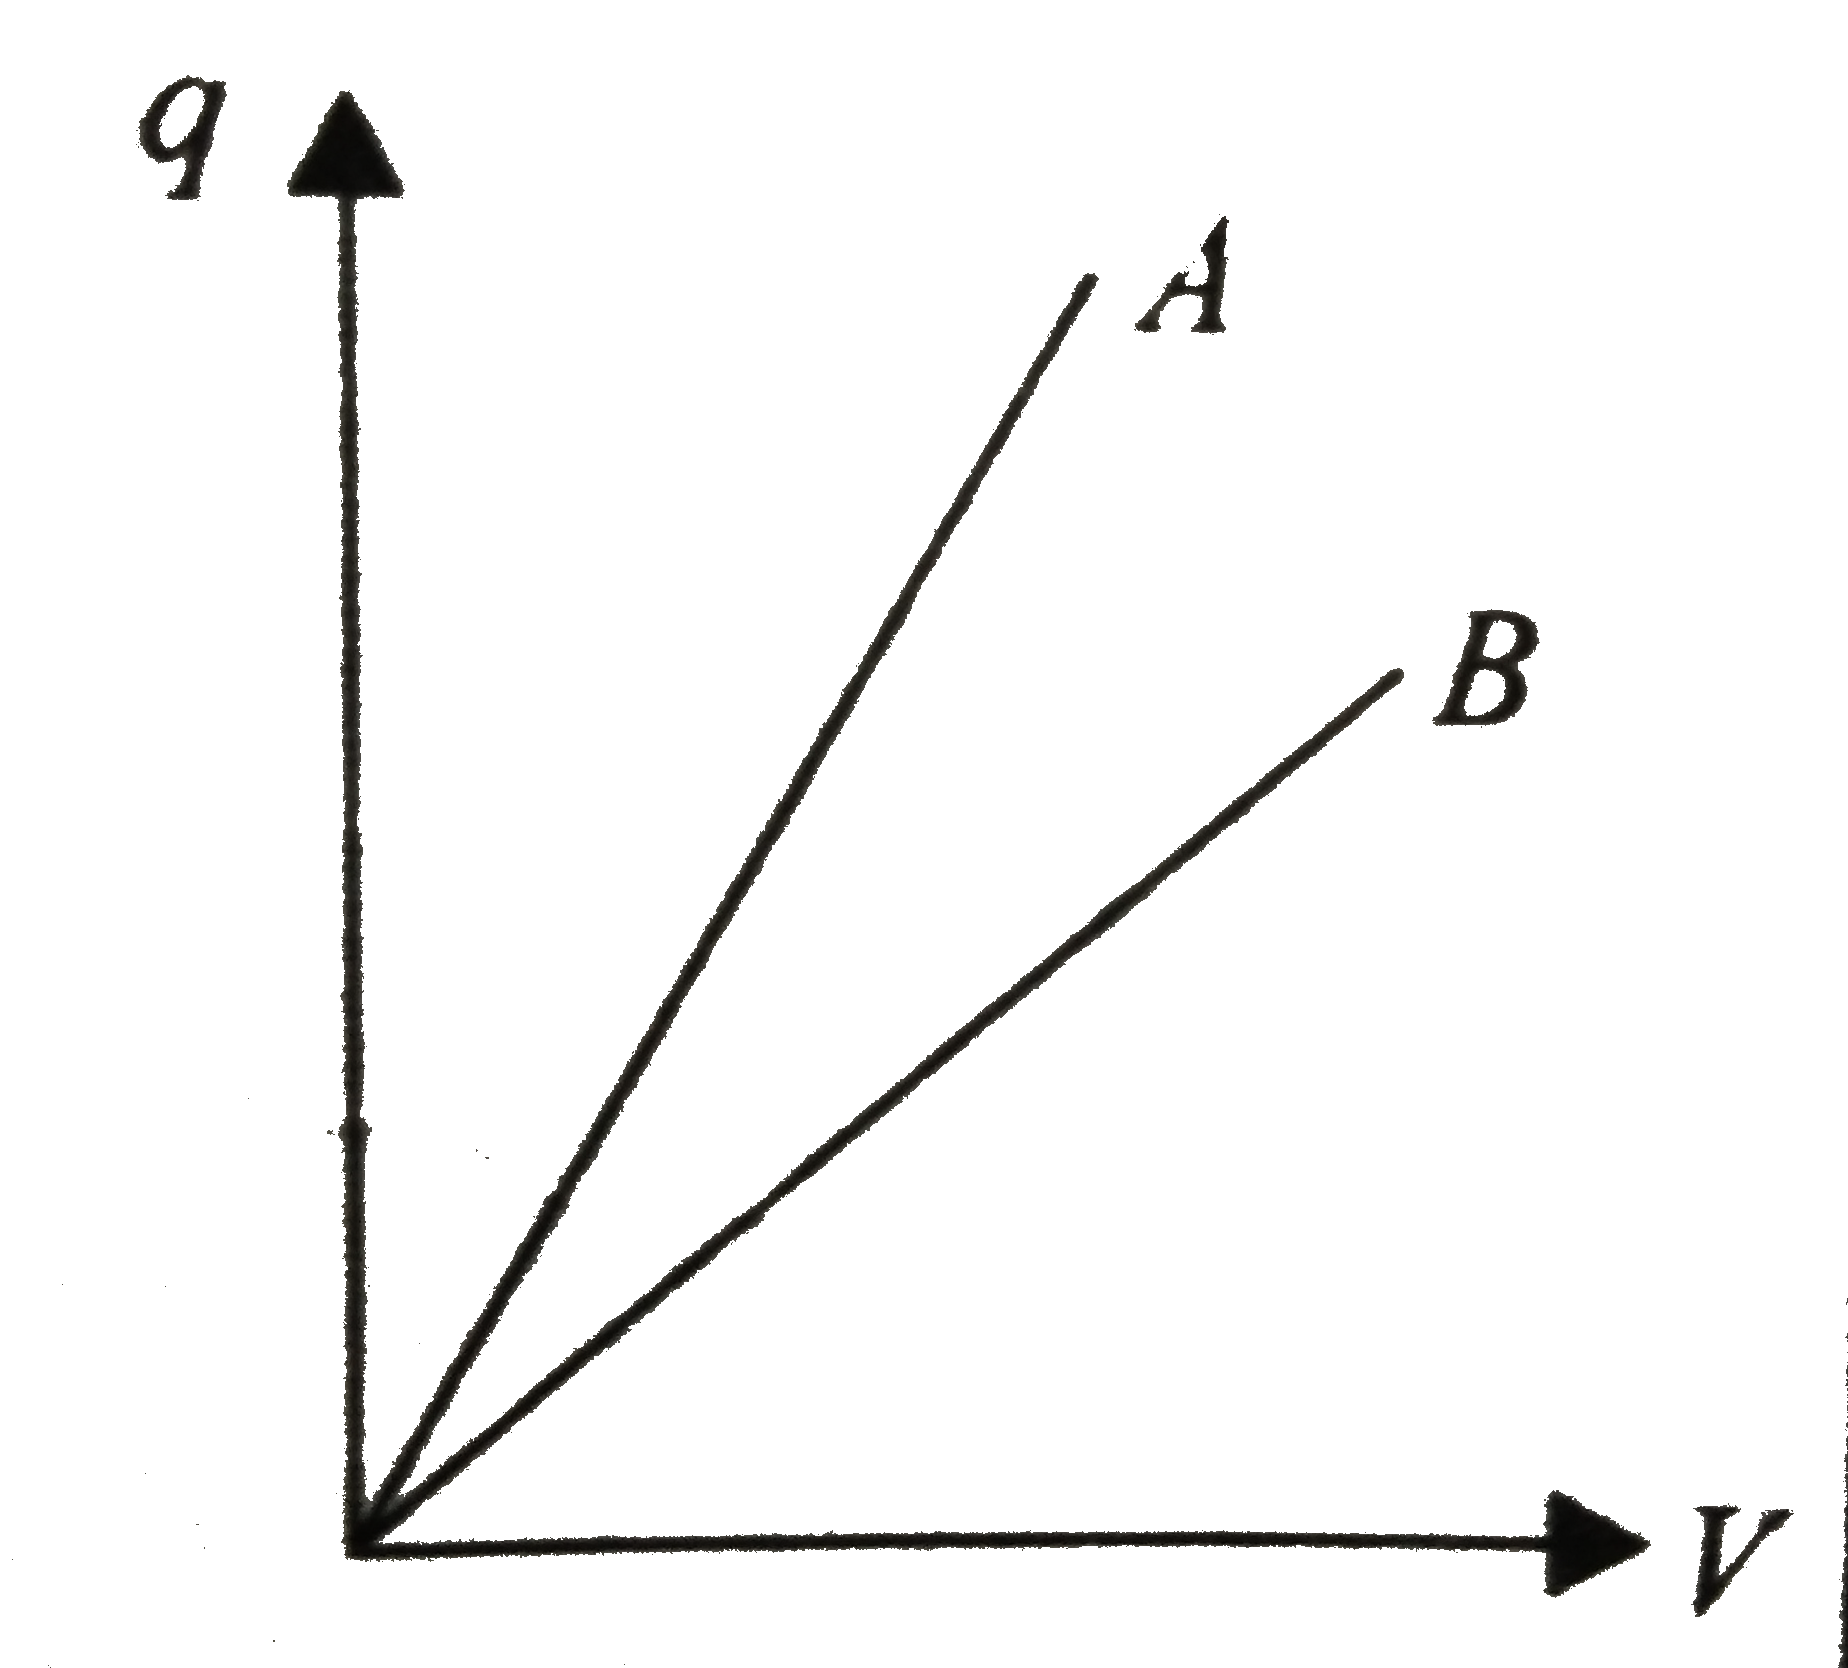
Shows these variation of charge q for two capacitors C1 and C2 The two capacitors have the same plate separation. But the plate area of C2 is double than that of C1. Which of the lines in the figure corresponds to C1 and C2 and why?
 .
.
View SolutionTwo capacitors C1 and C2 are charged to same potential V, but with opposite polarity as shown in the figure. The switches S1 and S2 are then closed

View SolutionGiven that C denotes capacitance of a capacitor and V is the potential difference across its plates. Then the dimensions of CV2 are same as that of
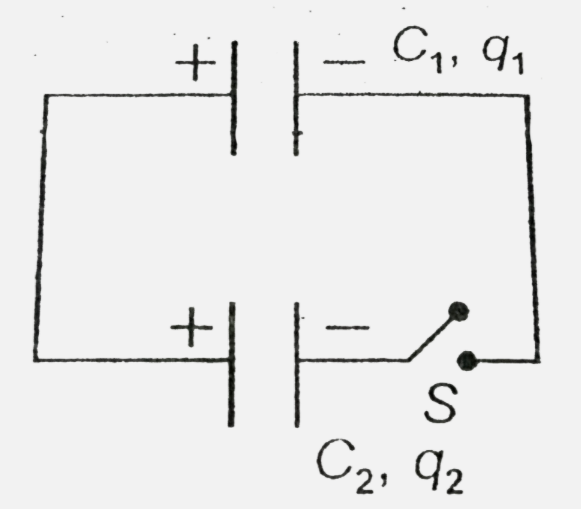
View SolutionThe circuit shows two capacitors, C1 and C2 charged so as to have respectively charges q1 and q2 . The switch is closed . Which of the following choices are incorrect ?
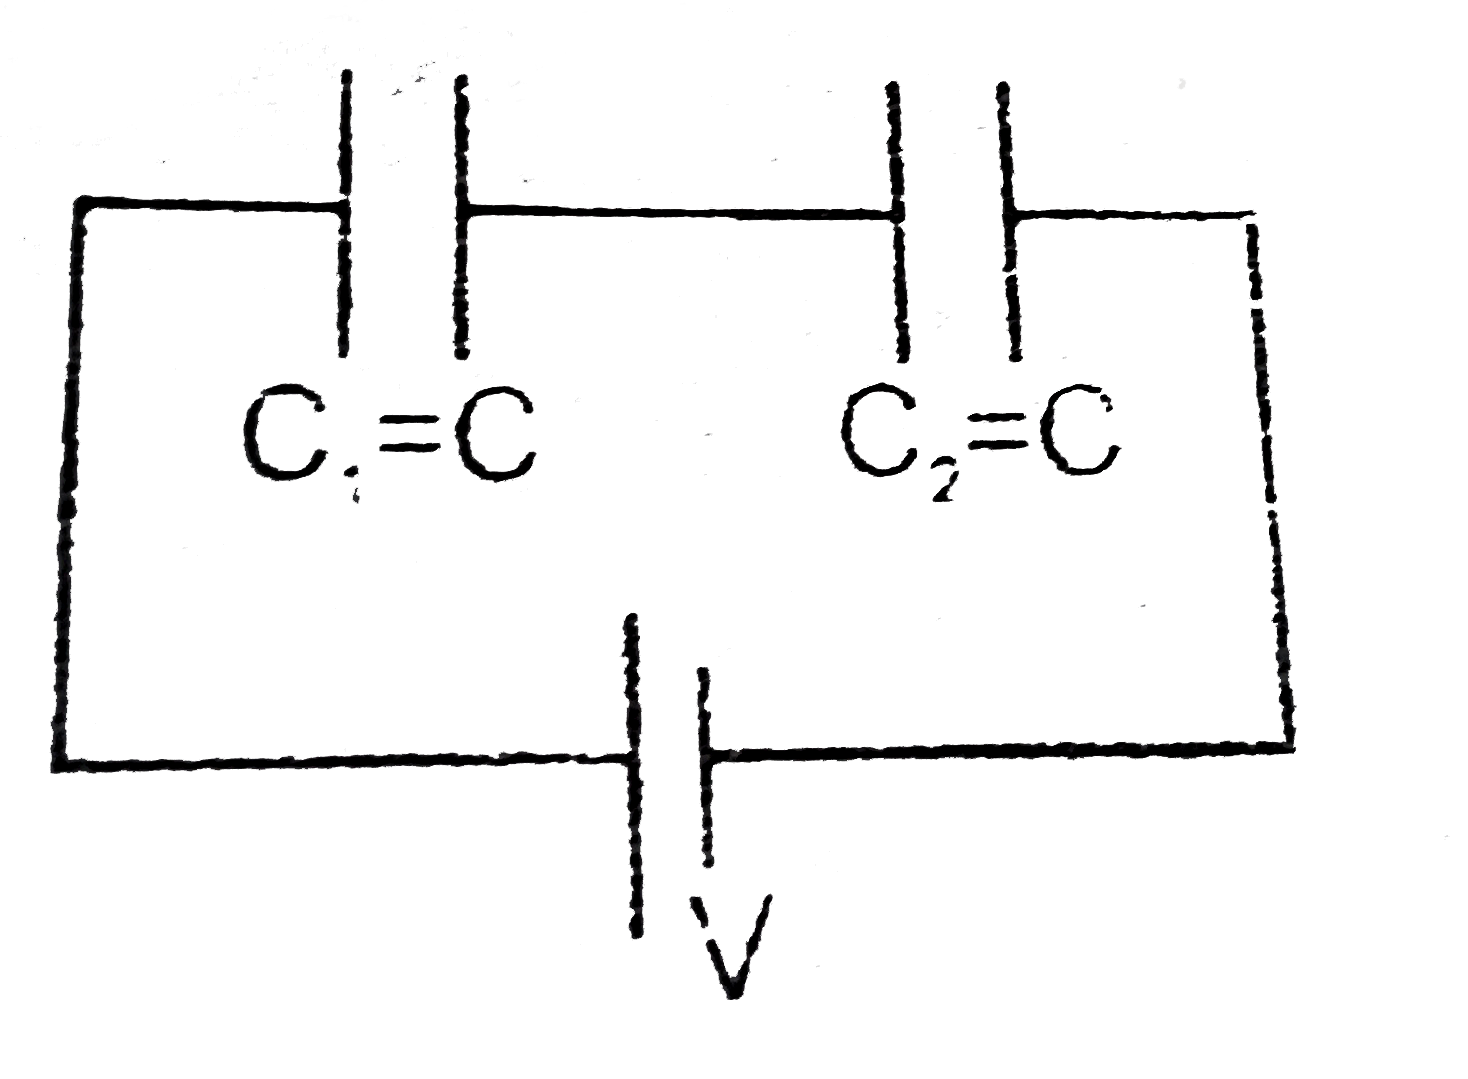
View SolutionTwo identical capacitor C1 and C2 are connected in series with a battery. They are fully charged. Now a dielectric slab is inserted between the plates of C2. The potential across C1 will :
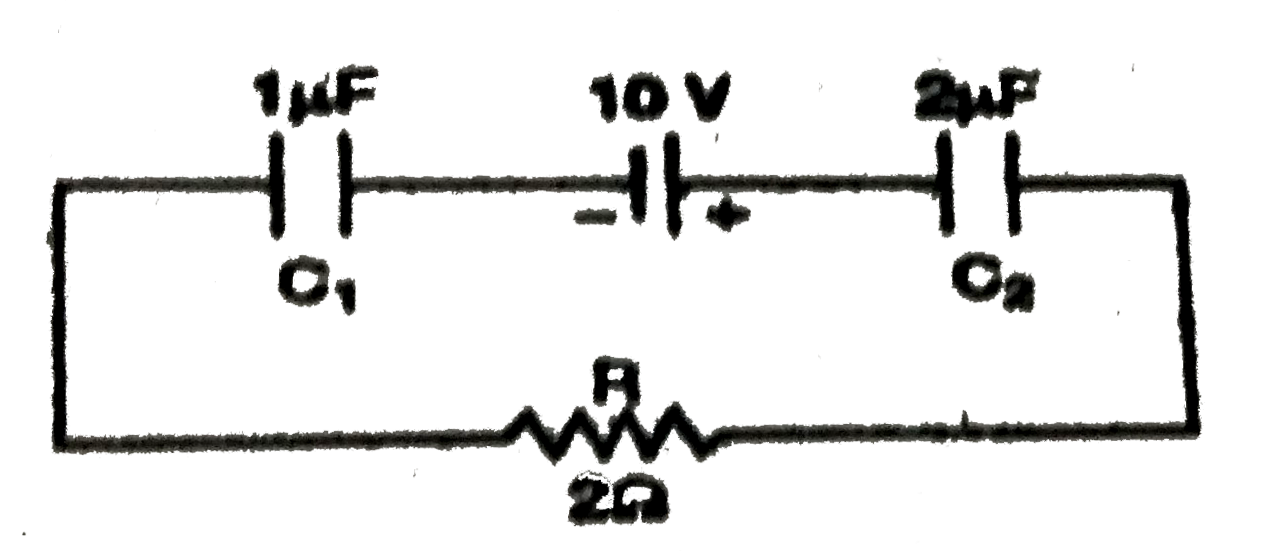
View SolutionA 10V battery is connected to two capacitors C1 and C2 and a resistor R. When the capacitors are fully charged, then the potential difference across the resistor will be
View SolutionAt which of the two points, 1 or 2, of a charged capacitor with nonparallel plates is the surface charge density greater?
View SolutionThe potentials of the two plates of capacitor are +10V and −10V. The charge on one of the plate is 40C. The capacitance of the capacitor is
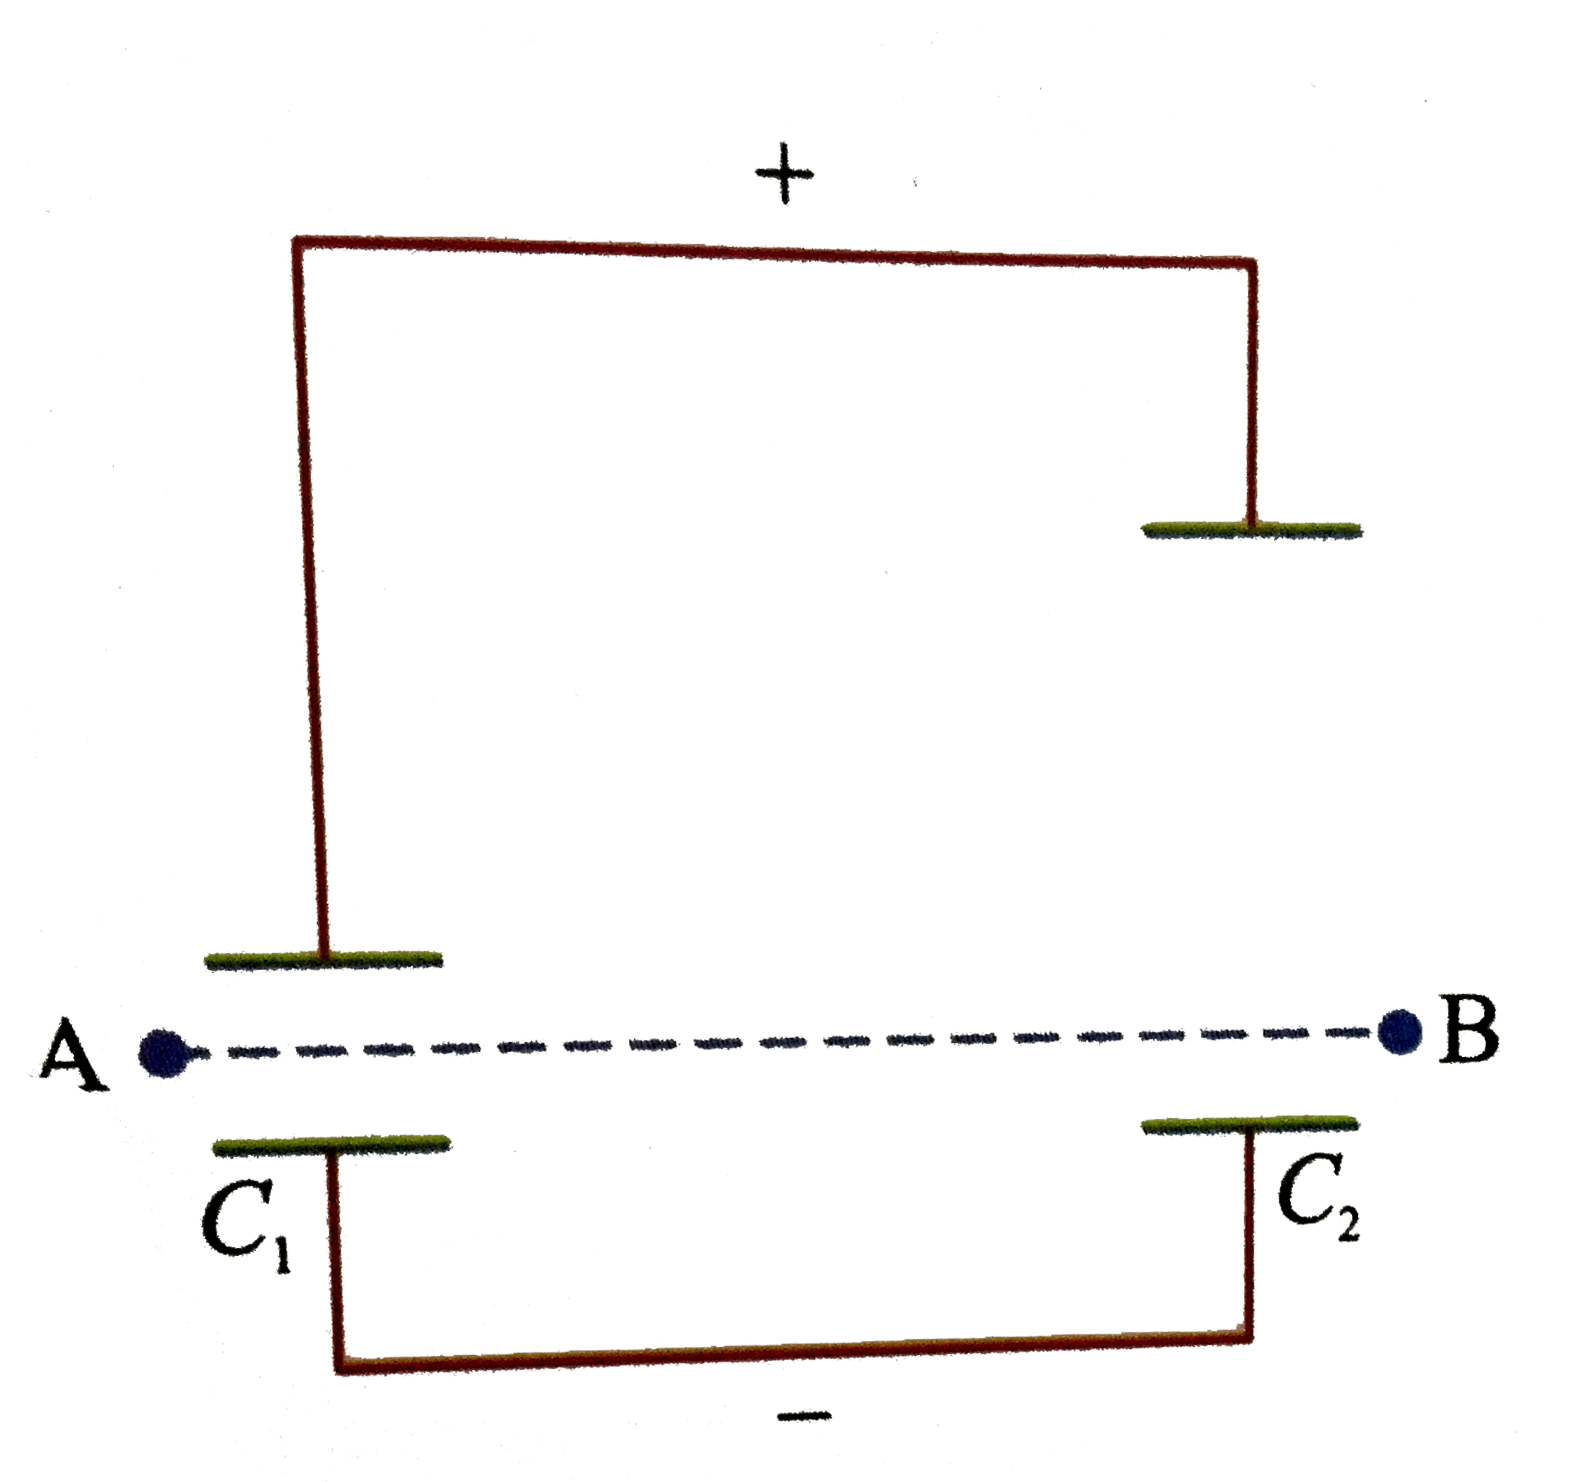
View SolutionTwo parallel-plate capacitors with different distances between the plates are connected in parallel to a voltage source. A point positive charge is moved from a point A, that is exactly in the middle between the plates of a capacitor C1 to a point B(or a capacitor C2 that lies at a distance from the negative plate of C2 equal to half the distance between the plates of C1) During this process of moving the charge.
 .
.
View SolutionFind potential difference across the plates AB if capacitance between the plates is C and area of each plate is equal and Q1,Q2(<Q1) are charges given to the plates
View Solution
