The given P - V diagram is showing an ideal gas undergoing a change of state different paths I, II, III and IV that lead to the same change of state, then change in internal energy is
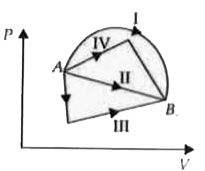
maximum along path 1
maximum and same along paths III and IV
minimum along path II
same in all the four cases
The correct Answer is:D
Topper's Solved these Questions
- THERMODYNAMICSBOOK - MTG GUIDECHAPTER - THERMODYNAMICSEXERCISE - AIPMT/NEET (MCQs)
26 Videos
- THERMODYNAMICSBOOK - MTG GUIDECHAPTER - THERMODYNAMICSEXERCISE - NEET Cafe (Topicwise practice Questions)
80 Videos
- PROPERTIES OF BULK MATTERBOOK - MTG GUIDECHAPTER - PROPERTIES OF BULK MATTEREXERCISE - AIPMT/NEET (MCQs)
40 Videos
- WORK, ENERGY AND POWERBOOK - MTG GUIDECHAPTER - WORK, ENERGY AND POWEREXERCISE - AIPMT/NEET (MCQs)
34 Videos
Similar Questions
Knowledge Check
Figure shows the p−V diagram of an ideal gas undergoing a change of state from A to B. Four different parts I, II, III and IV as shown in the figure may lead to the same change of state. ltBrgt
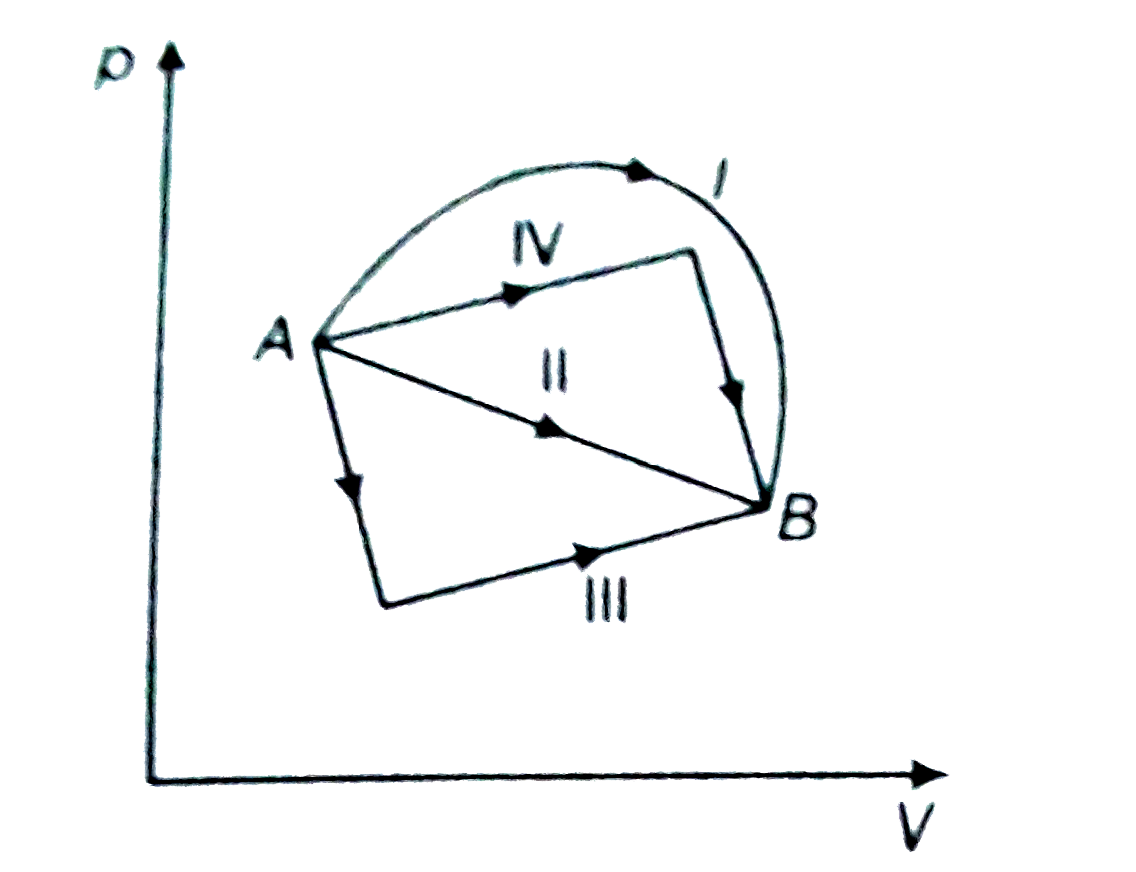 AChange in internal energy is same in IV and III cases, but not in I and IIBChange in internal energy is same in all the four casesCWork done is maximum in case IDWork done in minimum in case II
An ideal gas undergoing a change of state from A to B through four different paths I, II,III and IV as shown in the P-V diagram that lead to the same change of state tyhen the change in internal energy is
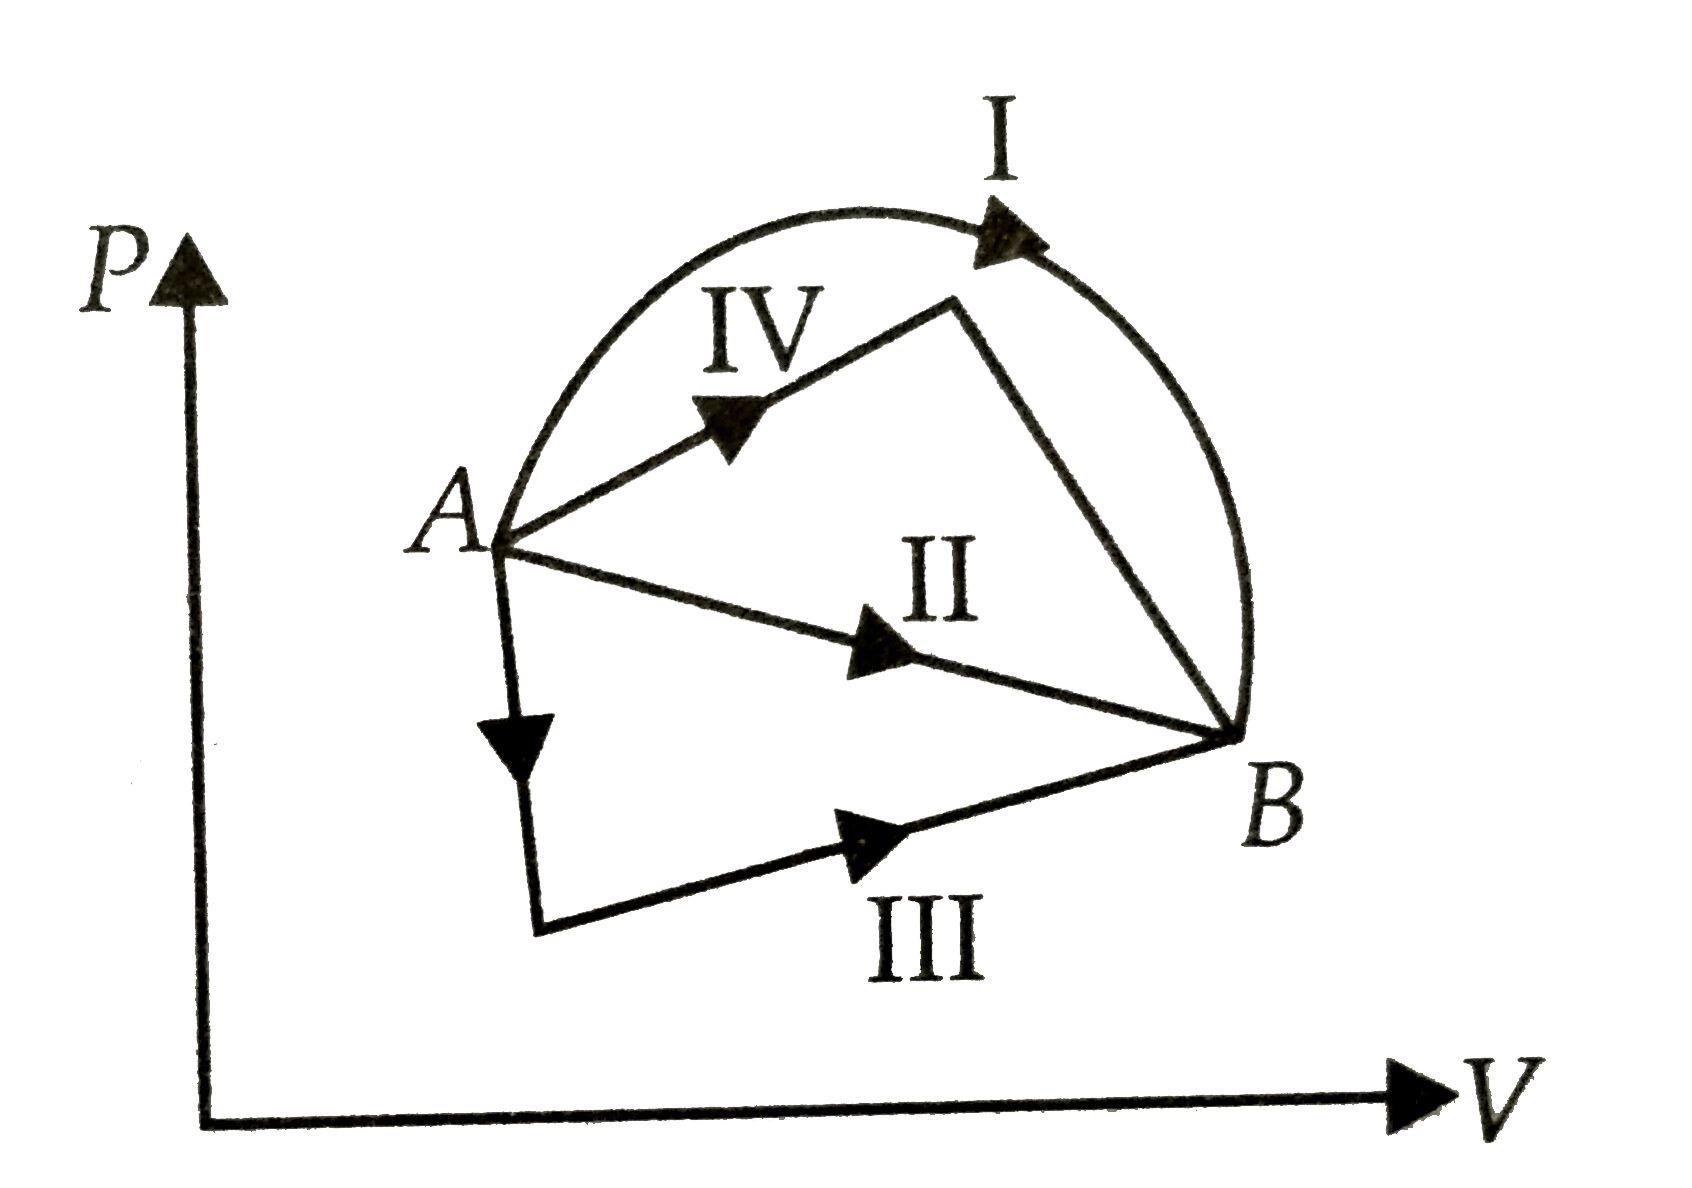 Asame in I and II but not in III and IVBsame in III and IV but not I I and IICsame in I, II and III but not I IVDsame in all the four cases
(figure). Shows the P−V diagram of an ideal gas undergoing a change of state from A to B. Four different process I, II, III, IV, as shown in (figure) may lead to the same change of state.
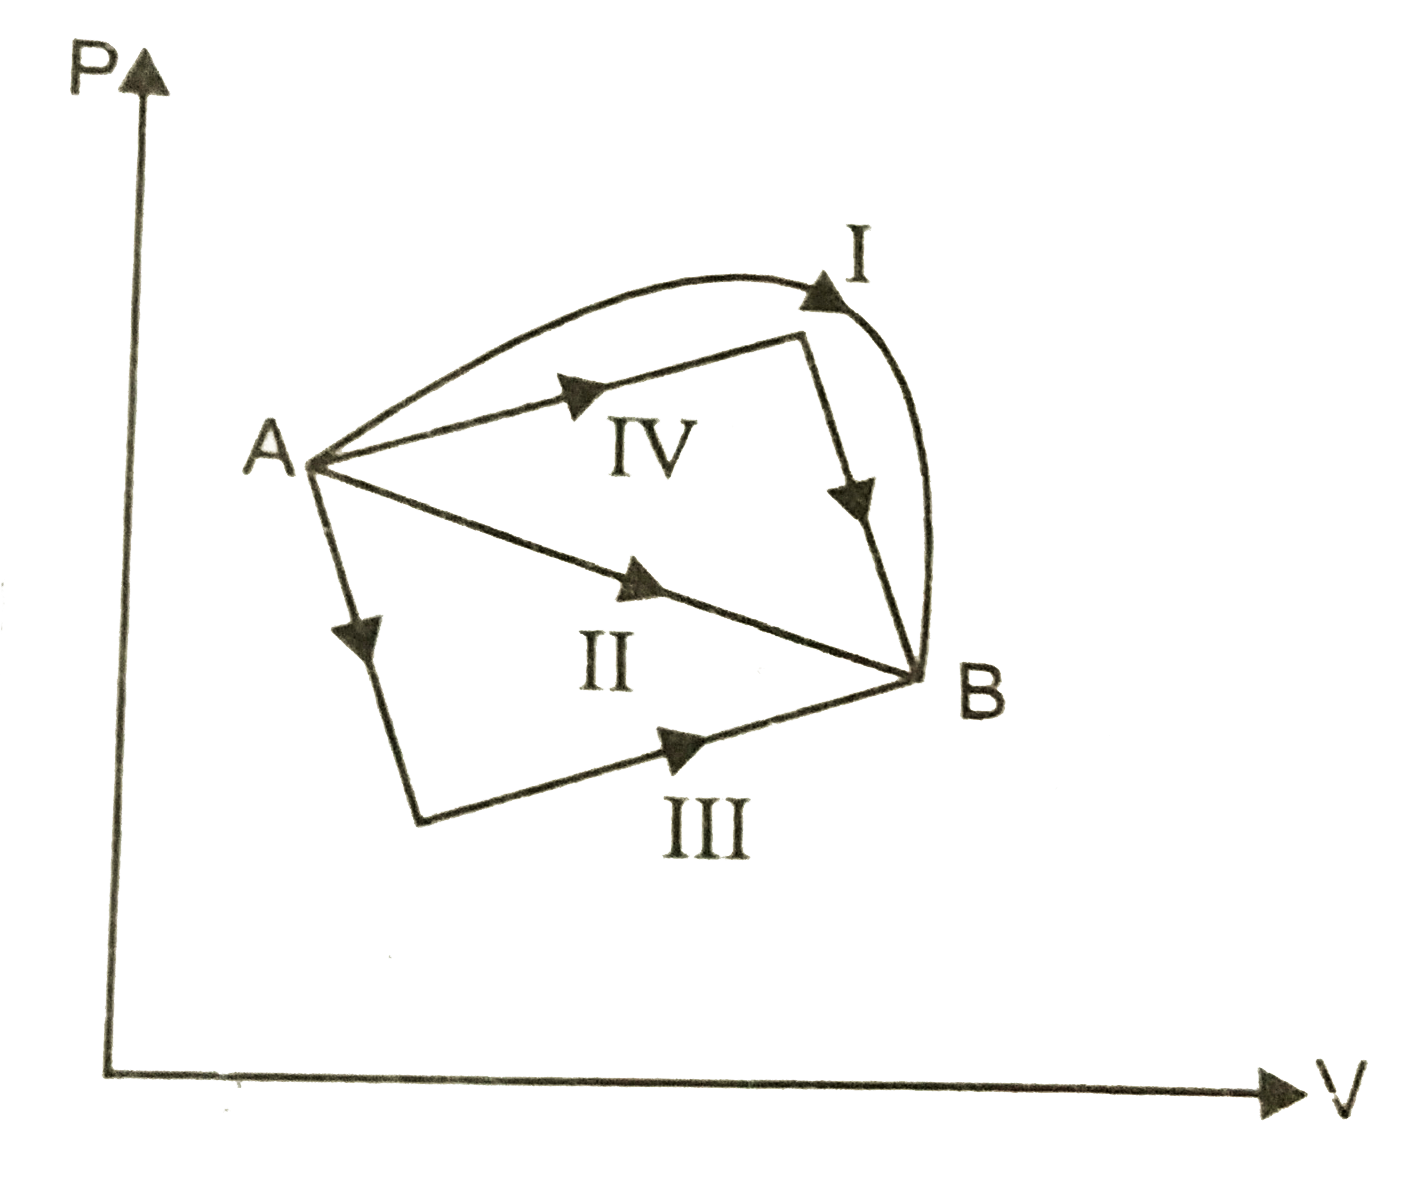 AChange in internal energy is same in IV and III cases but not in I and IIBChange in internal energy is same in all the four casesCWork done is maximum is Case IDWork done is minimum in case II
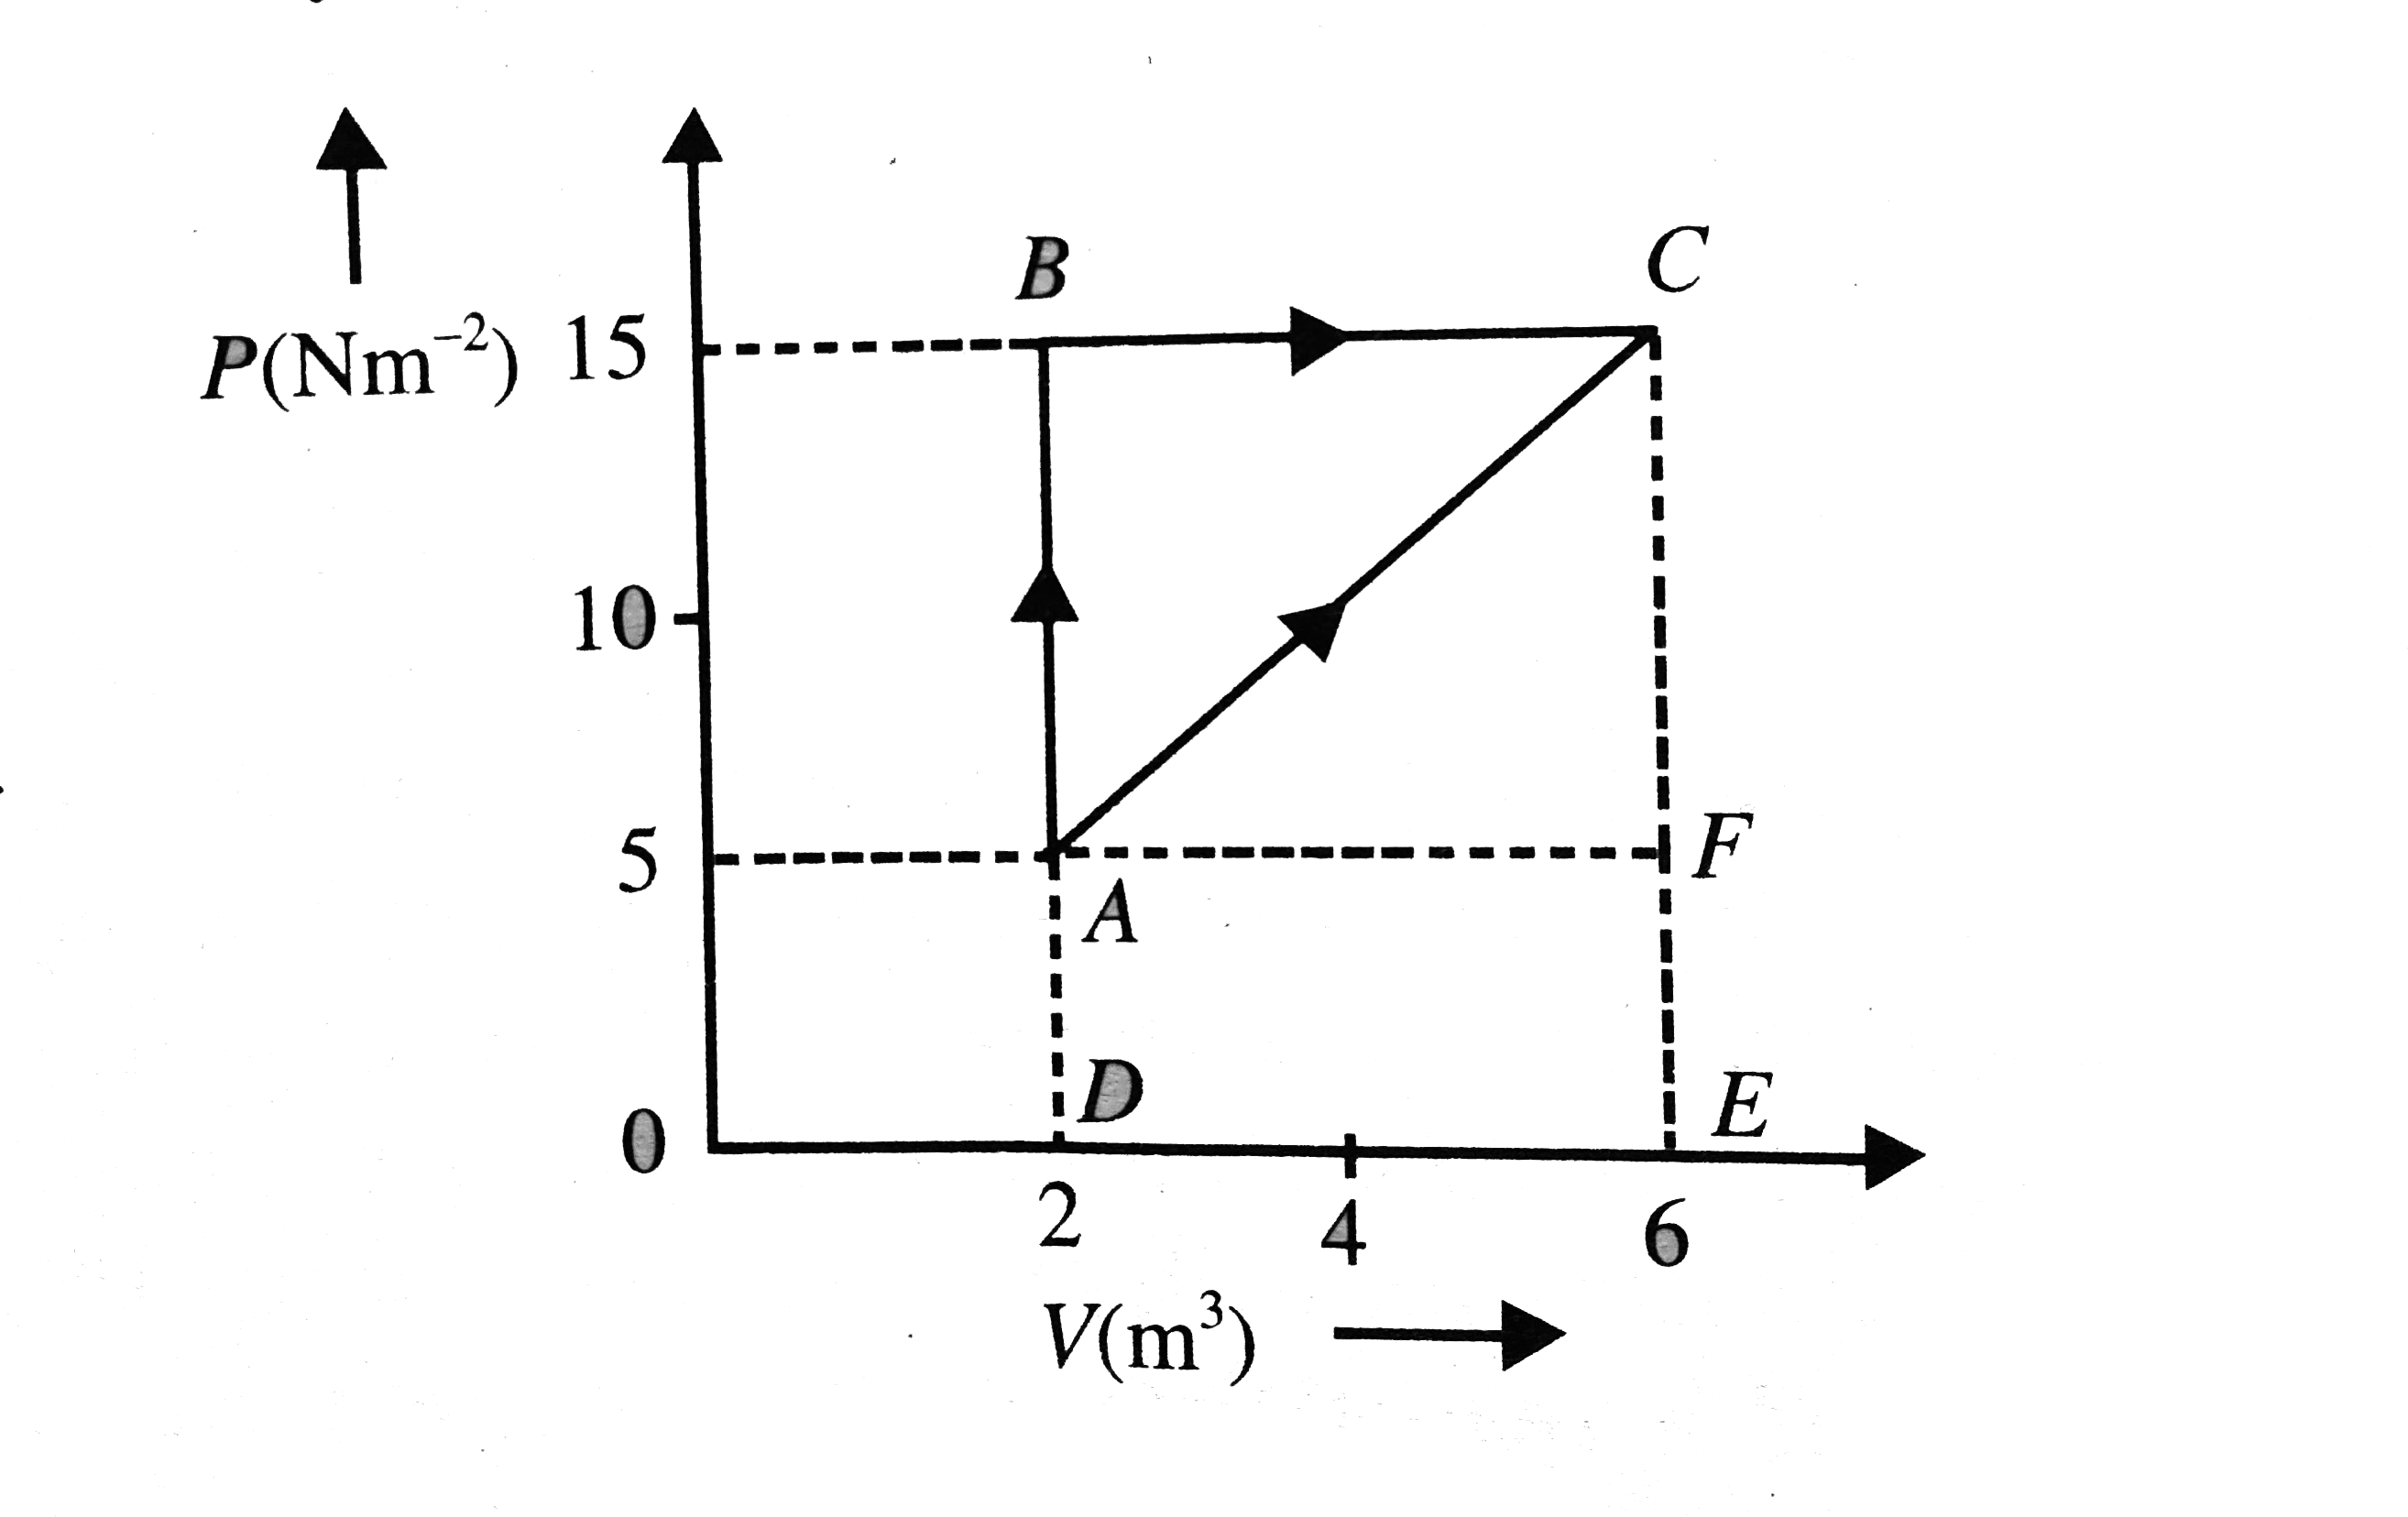
Figure. Shows an ideal gas changing its state A to state C by two different path ABC and AC.
a. Find the path along which the work done is the least.
b. The internal energy of the gas at A is 10J and the amount of heat supplied to change its state to C through the path AC is 200J. Find the internal energy at C.
c. The internal energy of the gas at state B is 20J. Find the amount of heat supplied to the gas to go from state A to state B.
View SolutionOne mole of an ideal gas undergoes change of state from (4 L, 3 atm) to (6 L, 5 atm). If the change in internal energy is 45 L-atm then the change of enthalpy for the process is
View Solution(figure). Shows the P−V diagram of an ideal gas undergoing a change of state from A to B. Four different process I, II, III, IV, as shown in (figure) may lead to the same change of state.

View SolutionInternal energy of an ideal gas changes with change in its
View SolutionAn ideal gas undergoes change in its state from the initial state I to the final state F via two possible paths as shown. Then

View Solution
