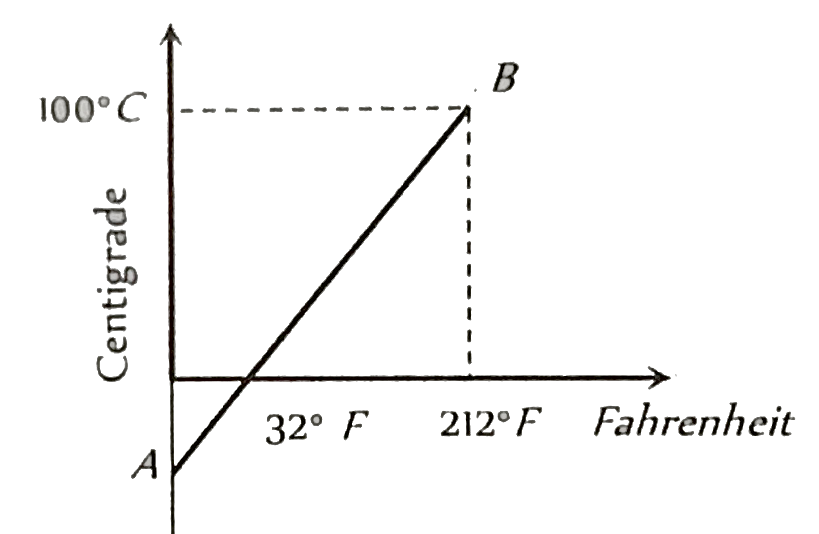
The graph AB shown in figure is a plot of temperature of a body in degree celsius and degree Fahrenheit. Then

Slope of line AB is 9/5
Slope of line AB is 5/9
Slope of line AB is 1/9
Slope of line AB is 3/9
The correct Answer is:B
Step by step video, text & image solution for The graph AB shown in figure is a plot of temperature of a body in degree celsius and degree Fahrenheit. Then by Physics experts to help you in doubts & scoring excellent marks in Class 11 exams.
Updated on:21/07/2023Topper's Solved these Questions
- THERMOMETRY, THERMAL EXPANSION AND CALORIMETRY Book:ERRORLESS Chapter:THERMOMETRY, THERMAL EXPANSION AND CALORIMETRY Exercise:Assertion & Reason
Explore 14 Videos
- THERMOMETRY, THERMAL EXPANSION AND CALORIMETRY Book:ERRORLESS Chapter:THERMOMETRY, THERMAL EXPANSION AND CALORIMETRY Exercise:Self Evaluation Test
Explore 15 Videos
- THERMOMETRY, THERMAL EXPANSION AND CALORIMETRY Book:ERRORLESS Chapter:THERMOMETRY, THERMAL EXPANSION AND CALORIMETRY Exercise:Critical Thinking
Explore 27 Videos
- THERMODYNAMICSBook:ERRORLESS Chapter:THERMODYNAMICSExercise:All Questions
Explore 304 Videos
- TRANSMISSION OF HEATBook:ERRORLESS Chapter:TRANSMISSION OF HEATExercise:ET Self Evaluation Test
Explore 23 Videos
Similar Questions
Knowledge Check
Consider the following statements
I. The temperature in degree Celsius and degree Fahrenheit are related to each other by the following relationship
^∘F=95(^∘c)+32
II. The temperature on degree Celsius and Kelvin scale are related to each other by the following relationship.^∘C=K+273.15
Choose the correct option.AStatement I is correctBStatement II is correctCBoth the statements are correctDNeither the statement I nor II is correctThe normal temperature of human body on the Celsius scale and Fahrenheit scales in respectively
A37∘Cand98.6∘FB37∘Fand98.6∘CC37∘Cand98.8∘FD37∘Fand98.8∘CThe normal temperature of human body on the Celsius scale and Fahrenheit scales is respectively
A37∘Cand98.6∘FB37∘Fand98.6∘CC37∘Cand96.8∘FD37∘Fand96.8∘C
Let C denote the temperature of a body in degree Celsius Let F denote its temperature in degree Fahrenheit. The realtion between C and F is given by C100=F−32180. If F=2.2C, then find the value of C.
View SolutionLet C denote the temperature of a body in degree Celsius Let F denote its temperature in degree Fahrenheit. The realtion between C and F is given by C100=F−32180. If F=2.2C, then find the value of C.
View Solution77∘F convert it into degree celsius :
View SolutionThe normal temperature of human body on the Celsius scale and Fahrenheit scales is respectively
View SolutionThe function 't' which maps temperature in degree Celsius into temperature in degree Fahrenheit is defined by t(3)=9c5+32, find t(−10).
View Solution
