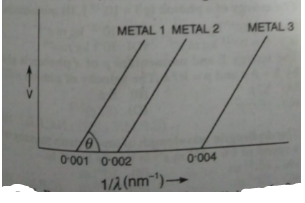
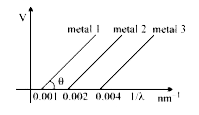
The graph between 1/λ and stopping potential (V) of three metals having work functionω1,ω2 and ω3 in an experiment of photoelectric effect is plotted as shown in the figure.Which of the following statements is / are correct?
 .Solution in Punjabi
ratio of work functions isω1:ω2:ω3=1:2:4
Ratio of work functions is ω1:ω2:ω3=4:2:1
tan θ is directly proportional to hc/e,where h i sPlanck's constant and c is the speed of light
The violet colour light can eject photoelectrons from metals 2 and 3.
Step by step video & image solution for The graph between 1 //lambda and stopping potential (V) of three metals having work functionomega_1,omega_2 and omega_3 in an experiment of photoelectric effect is plotted as shown in the figure.Which of the following statements is / are correct?. by Physics experts to help you in doubts & scoring excellent marks in Class 12 exams.
Topper's Solved these Questions
Similar Questions
The photon of frequency v has a momntum associated with it .If c is the velocity of light,then momentum is
03:05View SolutionTo get five images of a single object, one should have two plane mirrors at an angle of :
03:43View SolutionProve that electromagnetic waves are transverse in nature.
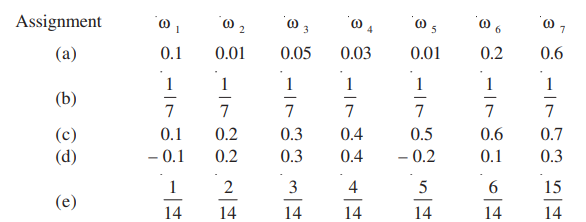
01:36View SolutionWhich of the following cannot be valid assignment of probabilities for outcomes of sample Space S={ω1,ω2,ω3,ω4,ω5,ω6,ω7}
 01:50View Solution
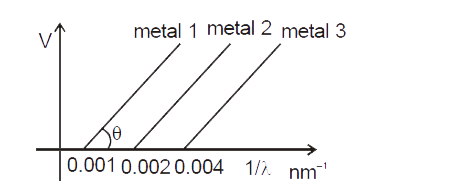
The graph between 1//lambda and stopping potential (V) of three metals having work- functions Phi_1 , Phi_2 and Phi_3 in an experiment of photoelectric effect is plotted as shown in the figure. Which of the following statement(s) is/are correct? (Here, lambda is the wavelength of the incident ray). (a) Ratio of work functions phi_1 : phi_2 : phi_3 = 1 : 2 : 4 (b) Ratio of work functions phi_1 : phi_2 : phi_3 = 4 : 2 : 1 (c ) tan theta is directly proportional to hc / e, where h is Planck constant and c is the speed of light (d) The violet colour light can eject photoelectrons from metals 2 and 3 .
05:13View SolutionIn an experiment on photoelectric effect the frequency f of the incident light is plotted against the stopping potential V_(0) . The work function of the metal is given by ( e is the electronic charge)
05:25View SolutionThe stopping potential as a function of the frequency of the incident radiation is plotted for two different photoelectric surfaces A and B . The graphs show that work function of A is
 01:35View Solution
In photoelectric effect the work function of a metal is 3.5 eV. The emitted electrons can be stopped by applying a potential of –1.2 V. Then
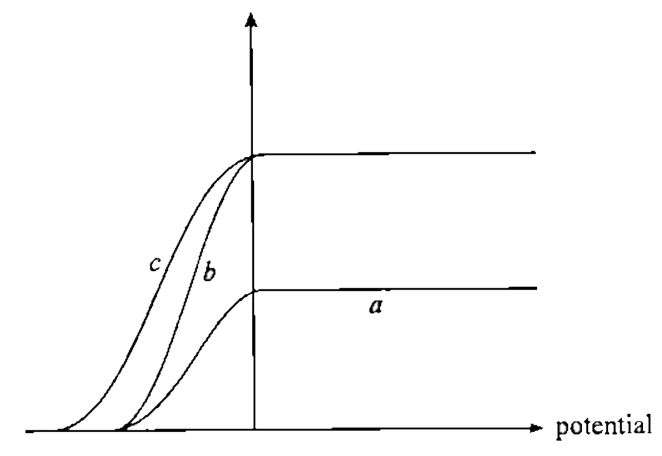
02:13View SolutionIn photoelectric experiment the plot between anode potential and photoelectric current is shown in figure 2.3.1. Which of the following is correct:
 05:43View Solution
The stopping potential as a function of frequency of incident radiation is plotted for two different photoelectric surfaces A and B . The graphs as shown in figure shows that , the work function of A is
05:30View SolutionIn photoelectric effect, the work function of a metal is 3.7 eV. The emitted electron can be stopped by applying a potential of 1.8 V. Then
01:41View SolutionThe graph between 1/λ and stopping potential ( V ) of three metals having work functions ϕ1,ϕ2 and ϕ3 in an experiment of photoelectric effect is plotted as shwon in the figure. Which of the following statement (s) is / are correct ? [Here λ is the wavelength of incident ray ].
 06:45View Solution
In photoelectric effect the slope of stop of stopping potential versus frequency of incident light for a given surface will be
04:14View SolutionThe stopping potential as a function of the frequency of the incident radiation is plotted for two different photoelectric surfaces A and B . The graphs show that work function of A is
 03:08View Solution
प्रकाश वैद्युत प्रभाव के एक प्रयोग में तीन धातुओं (जिनके कार्य फलन ϕ1,ϕ2 तथा ϕ3 है) के लिए 1/λ तथा निरोधी विभय (V) के बीच ग्राफ खींचे गये चित्रानुसार है। कौन-सा/से कथन सही है/है? [λआपतित विकिरण की तरंगदैर्ध्य है]
 View Solution
In photoelectric effect the work function of a metal is 3.5 eV. The emitted electrons can be stopped by applying a potential of –1.2 V. Then
View Solution

