The graph between inductive reactance and frequency is
parabola
straight line
hyperbola
an arc of a circle
The correct Answer is:B
Step by step video, text & image solution for The graph between inductive reactance and frequency is by Physics experts to help you in doubts & scoring excellent marks in Class 12 exams.
Updated on:21/07/2023Topper's Solved these Questions
Similar Questions
Explain the term 'inductive reactance'.Show graphically the variation of inductive reactance with frequency of the applied alternating voltage.
An a.c. voltage E=E0sinωt is applied across a pure inductor L.Show mathematically that the current flowing through it lags behind the applied voltage by a phase angle of π/2.
View SolutionThe inductance of a coil is 0.25 H. Calculate its inductive reactance in a.c. frequency 50 Hz.
View Solution
Knowledge Check
Which of the following graphs represent the correct variation of inductive reactance XL with frequency υ?
A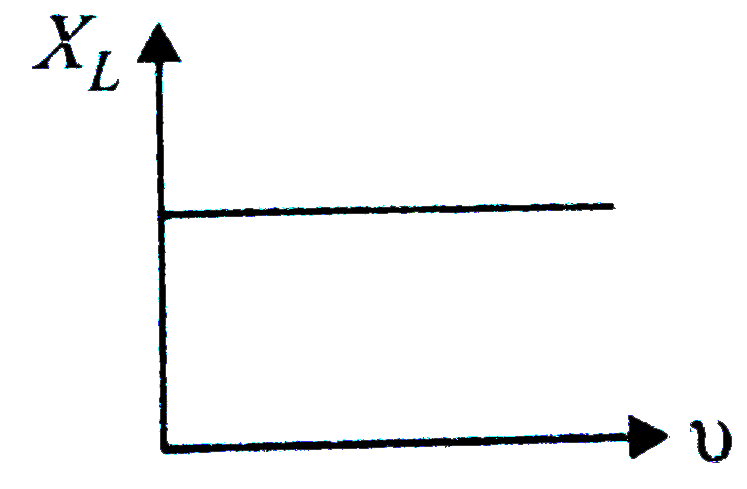 B
B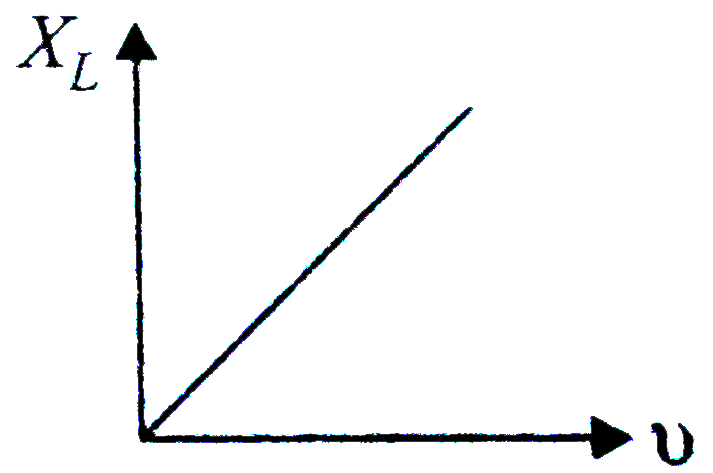 C
C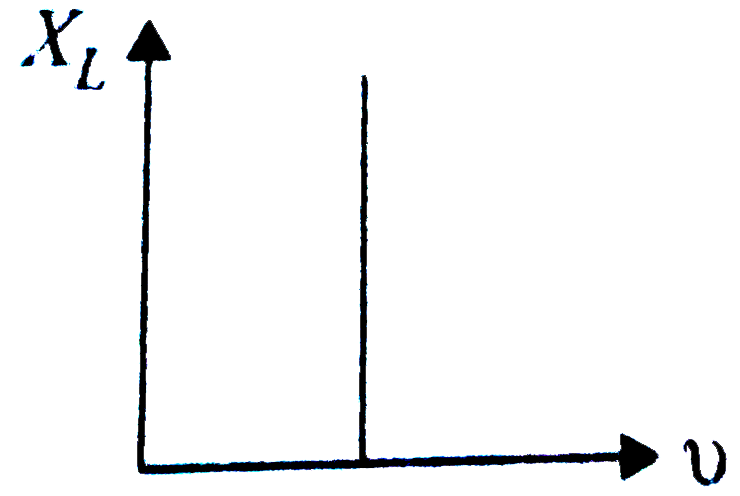 D
D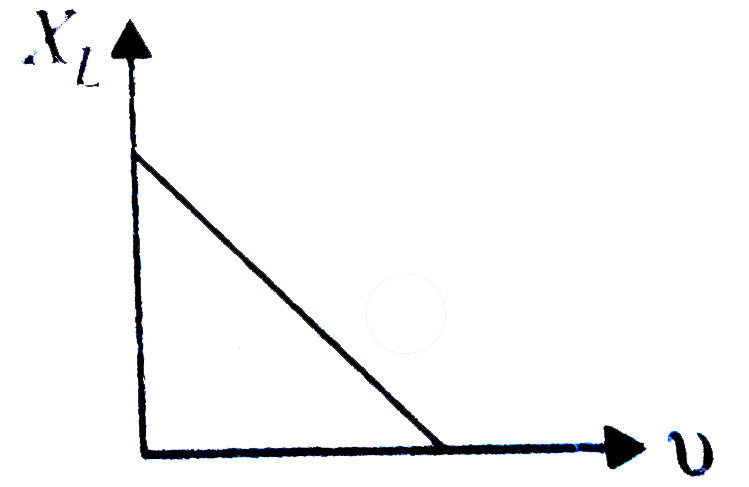
What is meant by self-inductance of a coil? Obtain an expression for the self-inductance of a long solenoid.
View SolutionWhat happens to the inductive reactance and the current in a purely inductive circuit if the frequency is halved ?
View SolutionHow does inductive reactance vary when frequency of a.c. source in the circuit is halved ?
View Solution(i) Draw the graphs showing variation of inductive reactance and capacitive reactance with frequency of applied a.c. source.
(ii) Can the voltage drop across the inductor or the capacitor in a series LCR circuit be greater than the applied voltage of the a.c. source ? Justify your answer.
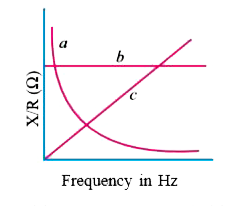
View SolutionIn given figure three curves a, b and c shows variation of resistance, (R) capacitive reactance (Xc) and inductive (XL) reactance with frequency. Identify the respective curves for these.
View SolutionHow inductive reactance depends on the frequency of AC ?
View SolutionSketch a graph that shows change in reactance with frequency of a series LCR circuit.
View Solution
