The graph given show the position of two cars A and B as a function of time. The cars move along the x axis on parallel but separate tracks, so that they can pass each other's position without colliding.
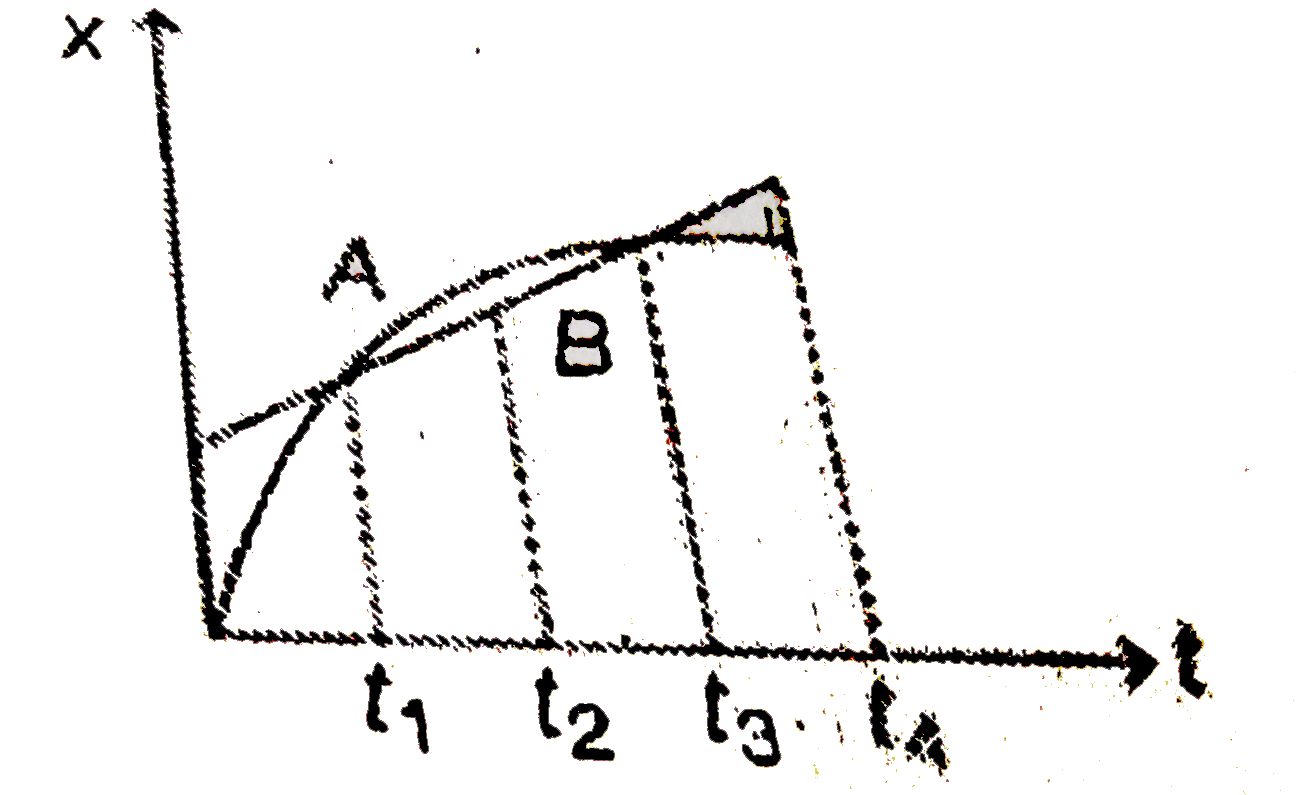
Which one of the following best describes the motion of car A as shown on the graphs?
speeding up
constant velocity
slowing down
first speeding up, then slowing down
The correct Answer is:C
Step by step video & image solution for The graph given show the position of two cars A and B as a function of time. The cars move along the x axis on parallel but separate tracks, so that they can pass each other's position without colliding. Which one of the following best describes the motion of car A as shown on the graphs? by Physics experts to help you in doubts & scoring excellent marks in Class 11 exams.
Updated on:21/07/2023Topper's Solved these Questions
- KINEMATICS 1BOOK - DC PANDEY ENGLISHCHAPTER - KINEMATICS 1EXERCISE - MATCH THE COLUMN
10 Videos
- KINEMATICS 1BOOK - DC PANDEY ENGLISHCHAPTER - KINEMATICS 1EXERCISE - INTEGER_TYPE
15 Videos
- KINEMATICS 1BOOK - DC PANDEY ENGLISHCHAPTER - KINEMATICS 1EXERCISE - MCQ_TYPE
27 Videos
- KINEMATICSBOOK - DC PANDEY ENGLISHCHAPTER - KINEMATICSEXERCISE - INTEGER_TYPE
10 Videos
- LAWS OF MOTIONBOOK - DC PANDEY ENGLISHCHAPTER - LAWS OF MOTIONEXERCISE - Medical entrances gallery
39 Videos
Similar Questions
The graph given show the position of two cars A and B as a function of time. The cars move along the x axis on parallel but separate tracks, so that they can pass each other's position without colliding.
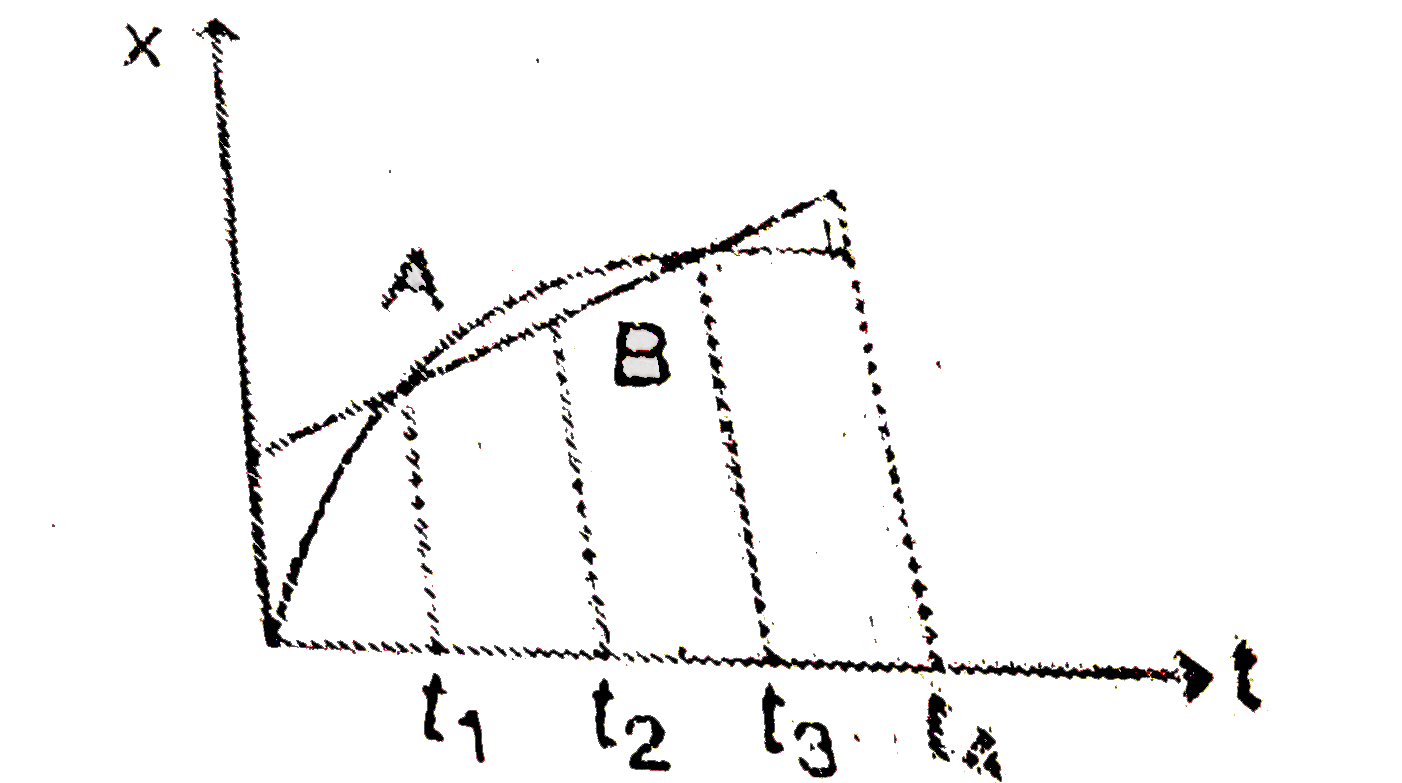
At time t3 which car is moving faster?
View SolutionThe graph given shows the positions of two cars, AandB, as a function of time. The cars move along the x-axis on parallel but separate tracks, so that they can pass each other's position without colliding. At which instant in time is car-A overtaking the car-B ?
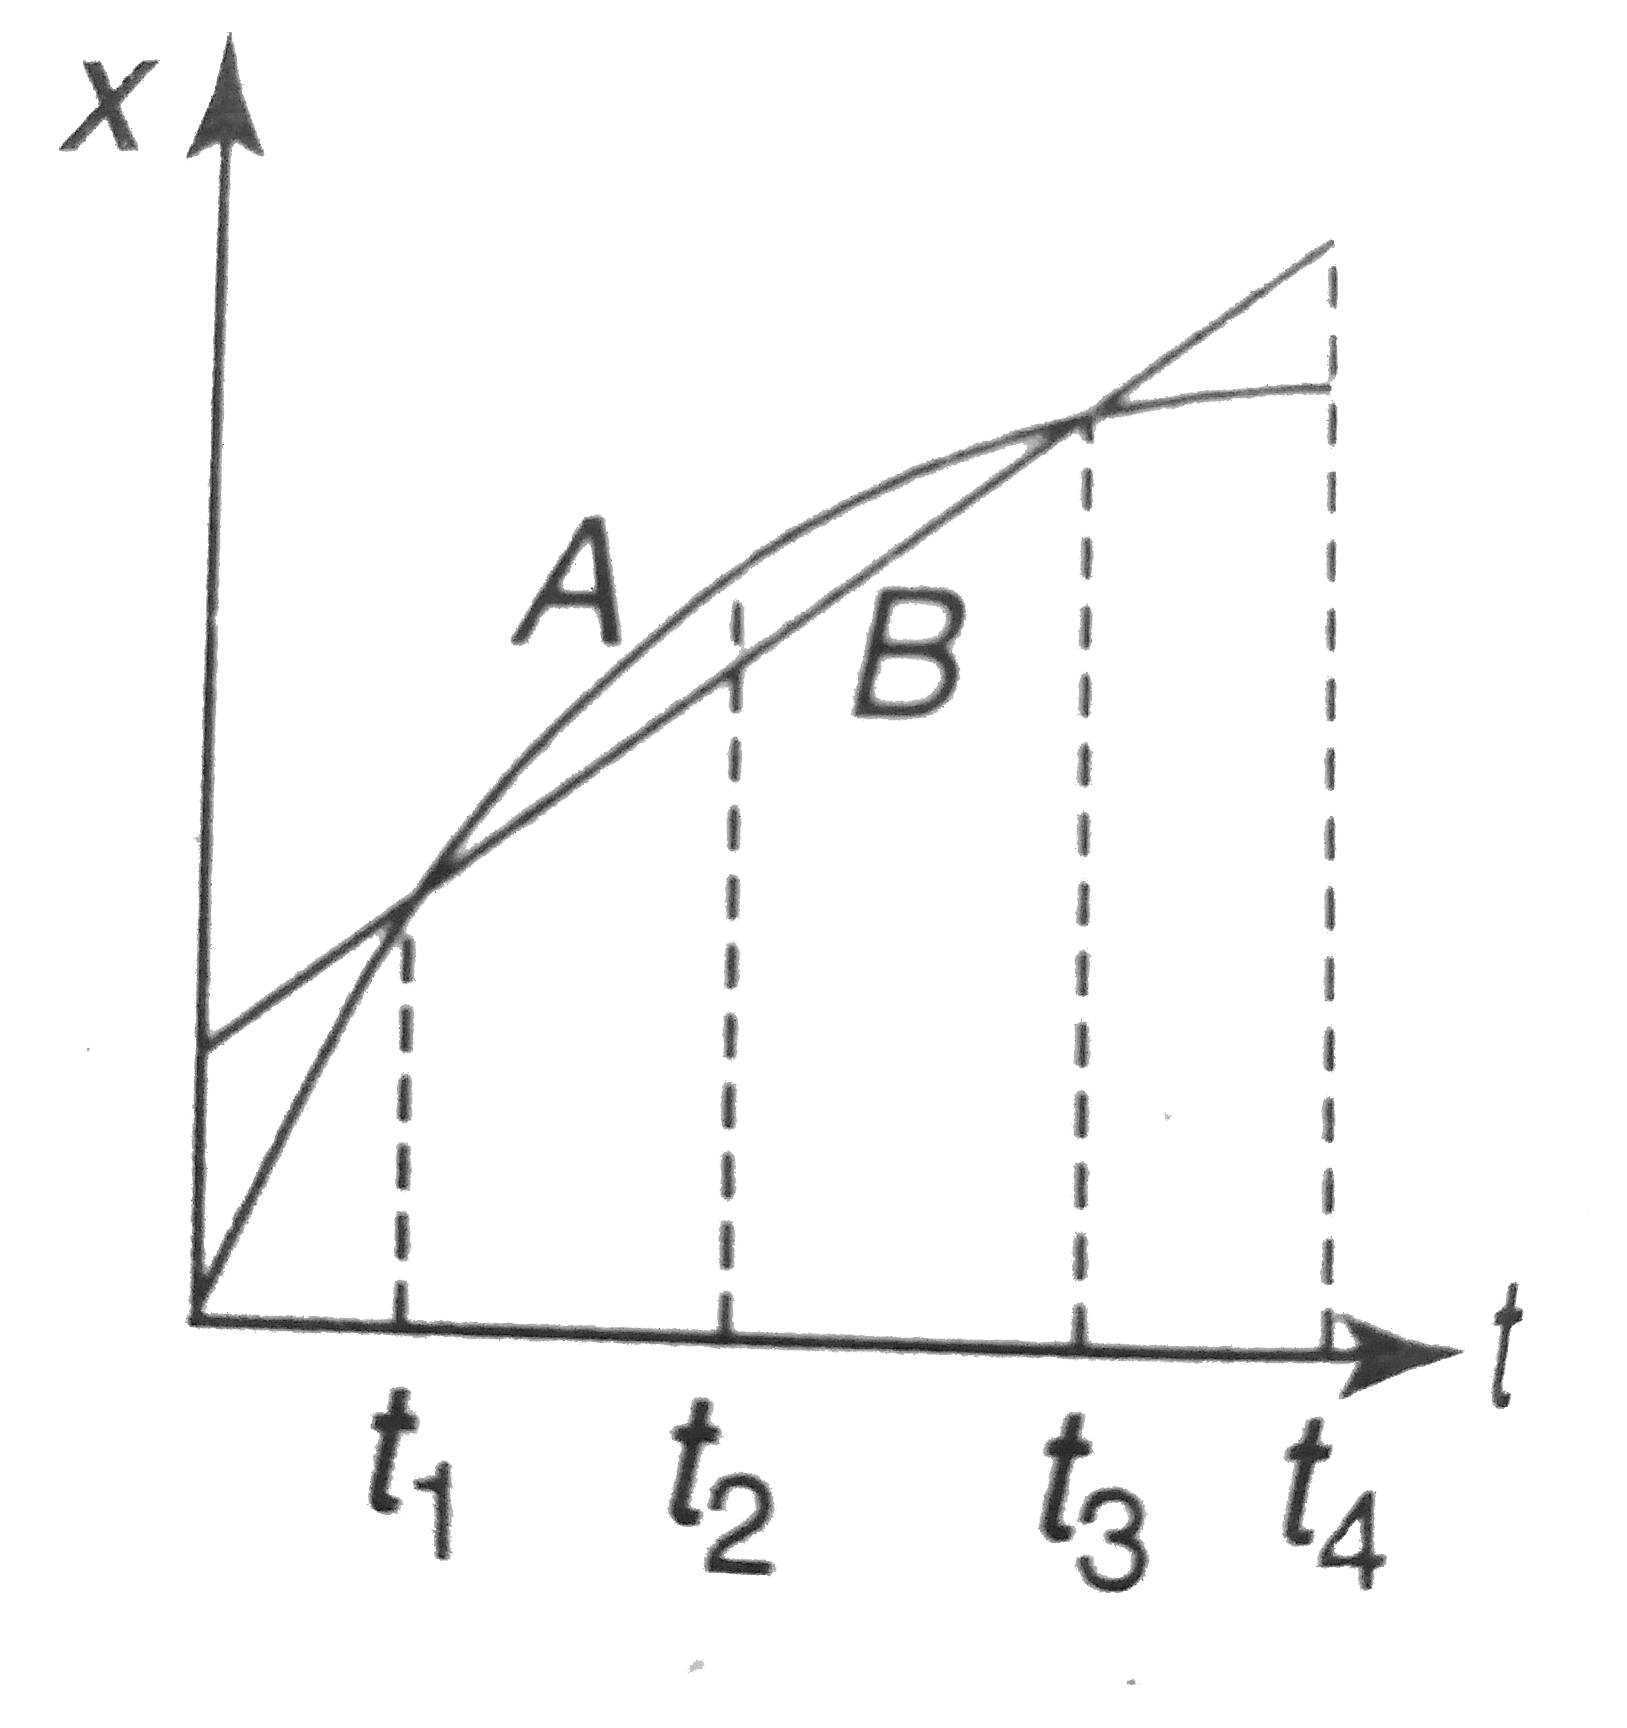
View SolutionThe graph given shows the positions of two cars, AandB, as a function of time. The cars move along the x-axis on parallel but separate tracks, so that they can pass each other's position without colliding. At which instant in time is car-A overtaking the car-B ?

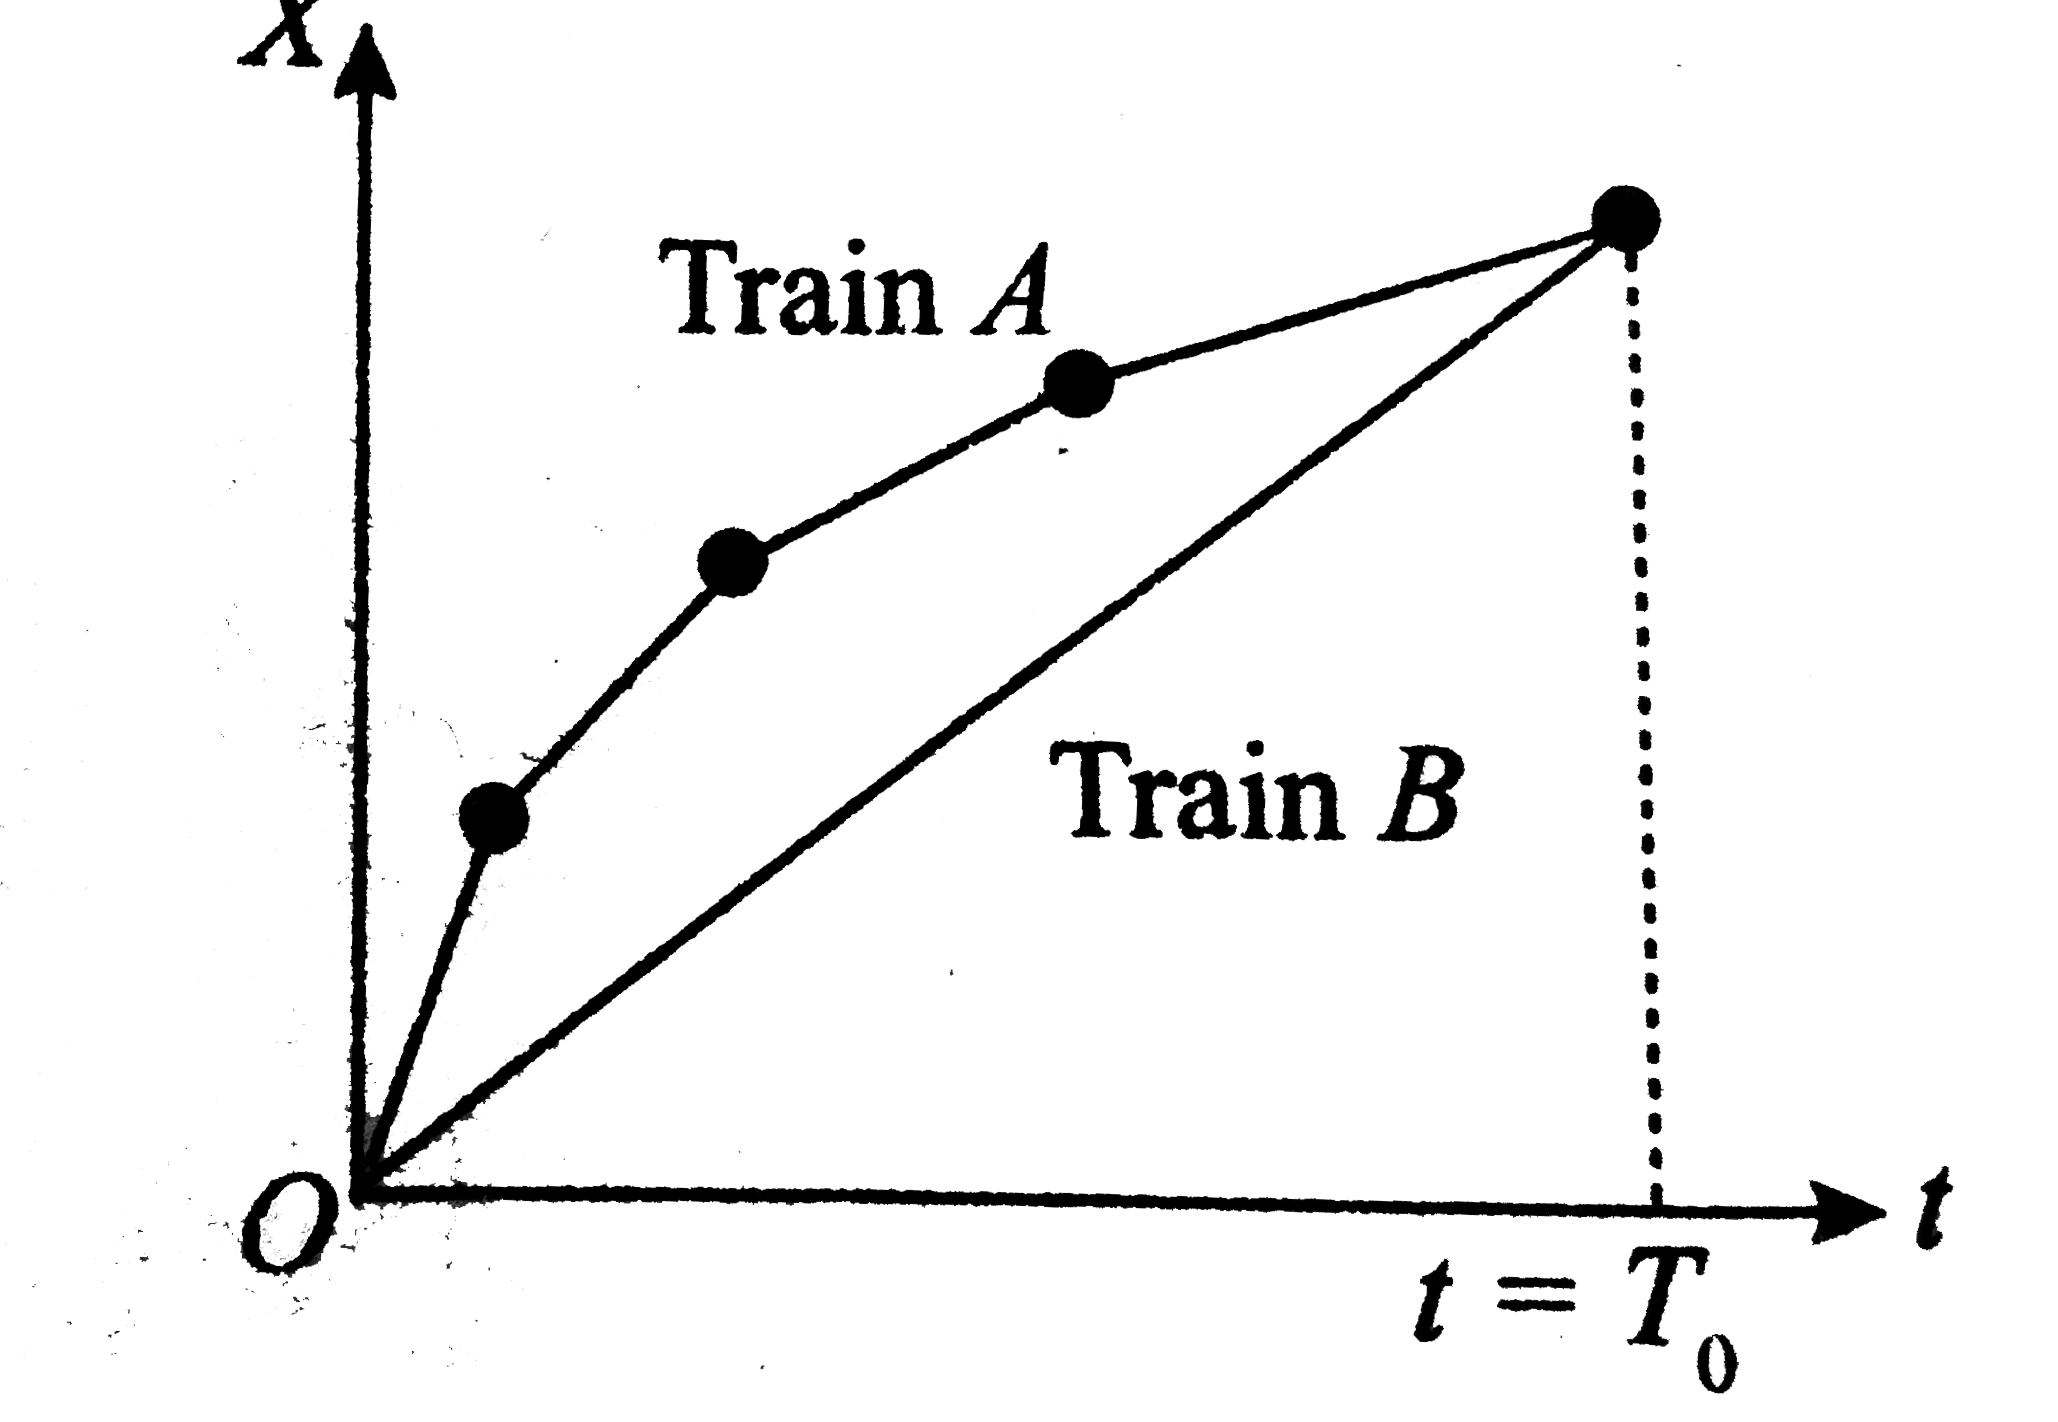
View SolutionThe plot shows the position (x) as a function of time (t) for two trains that run on a parallel track. Train A is next to train B at t=0 and at t=T0.
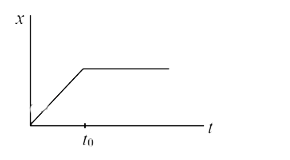
View SolutionFigure shows the position-time graph of a particle moving on the X--axis. Which of these option correctly describes the particle 's motion?
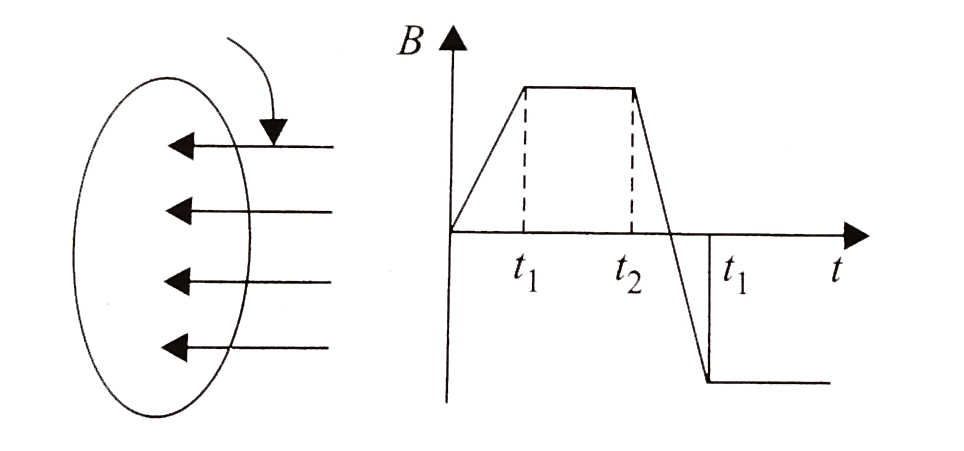
View SolutionA wire loop is placed in a region of time varying magnetic field which is oriented orthogonally to the plane of the loop as shown in Fig. The graph shows the magnetic field variation as the function of time. Assume the positive emf is the one which drives a current in the clockwise direction and seen by the observer in the direction of B. Which of the following graphs best represents the induced emf as a function of time?
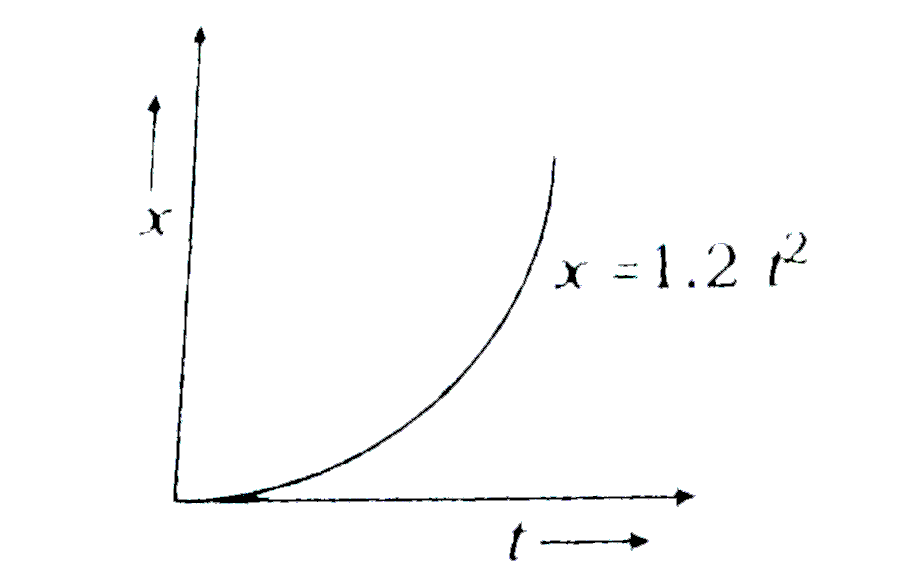
View SolutionFigure given shows the distance - time graph of the motion of a car. It follows from the graph that the car is
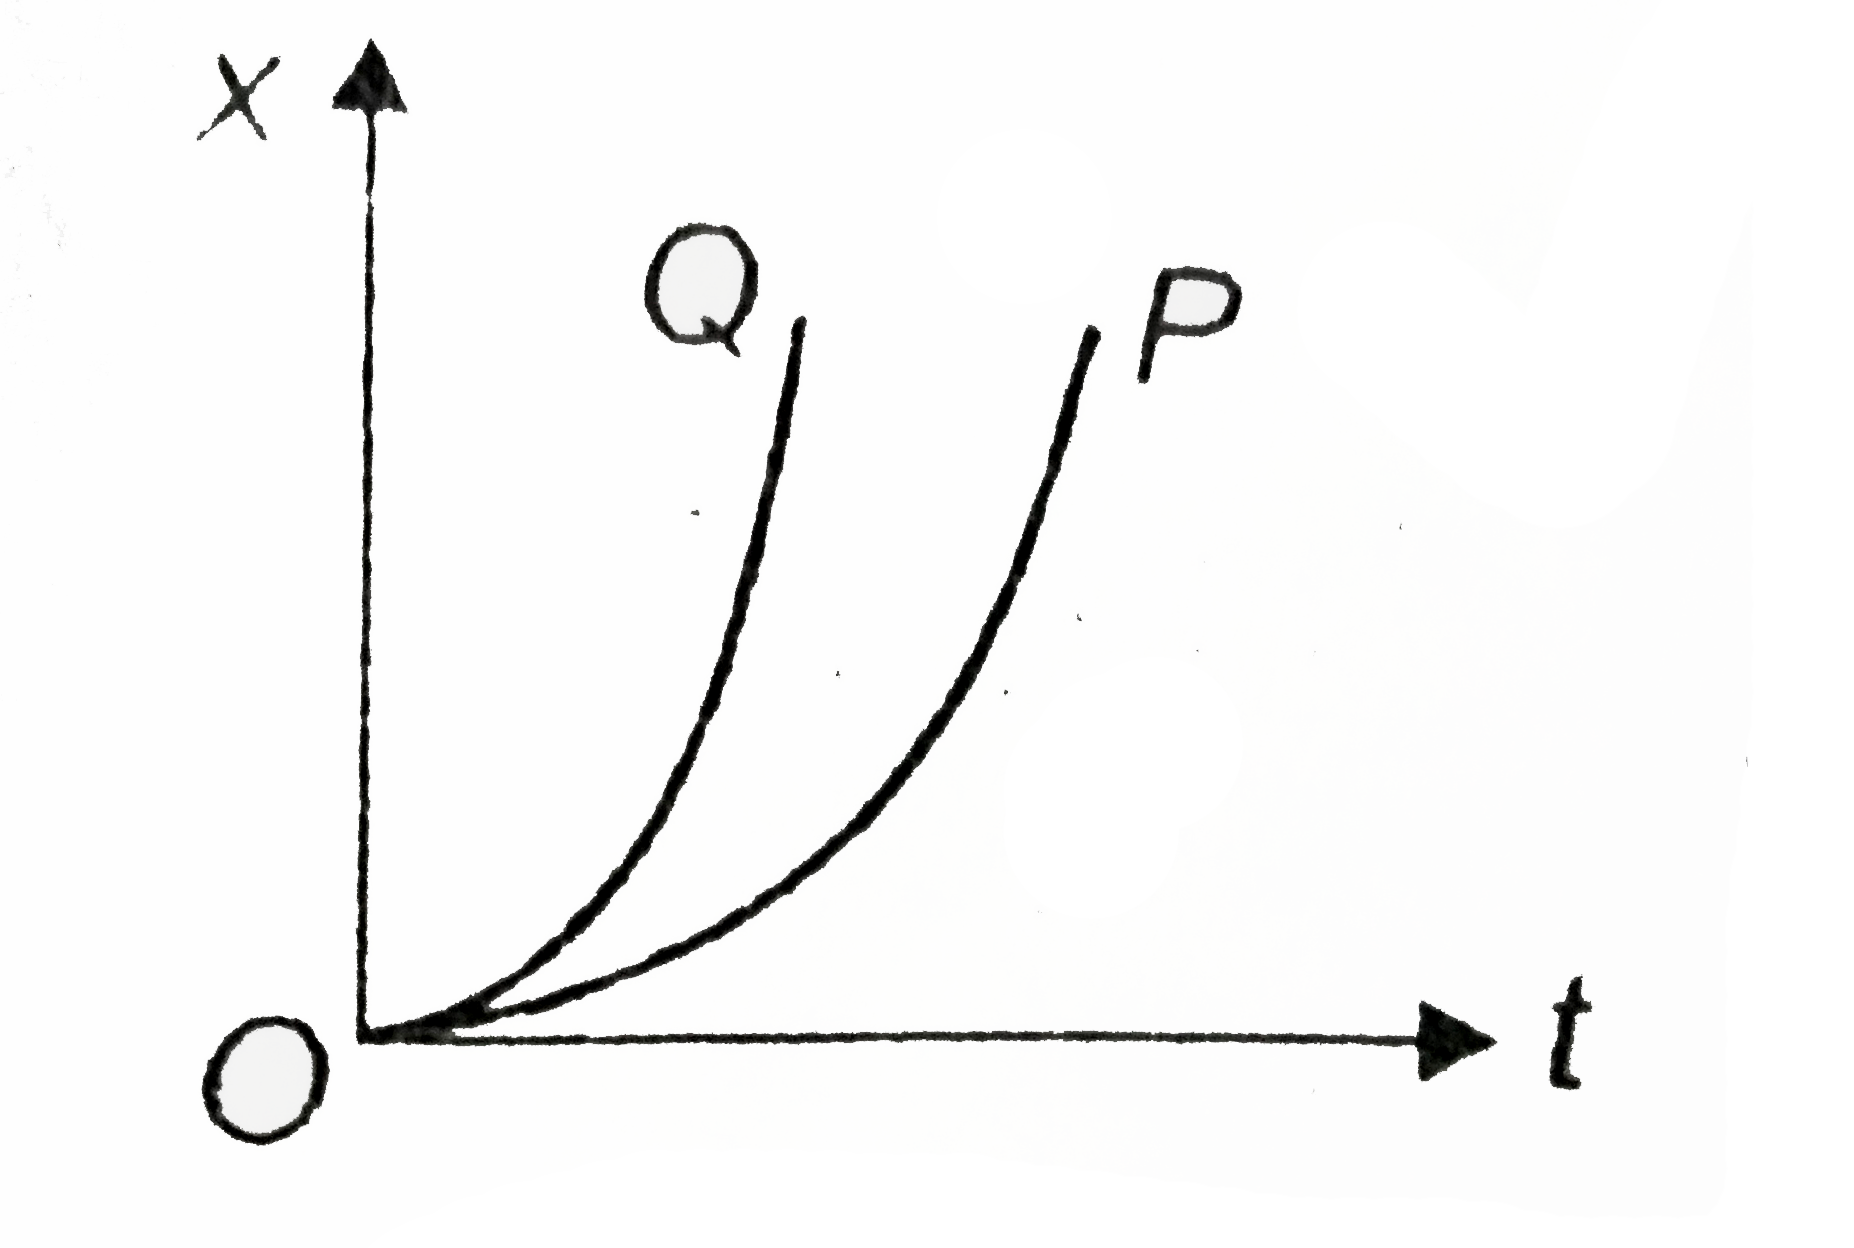
View SolutionThe position-time graph for two particles P and Q moving on x-axis is shown in the figure. Then
View SolutionThe velocity v of a particle moving along x - axis varies with ist position (x) as v=α√x, where α is a constant. Which of the following graph represents the variation of its acceleration (a) with time (t)?
View SolutionA particle moves along x− axis. It's velocity is a function of time according to relation V=(3t2−18t+24)m/s assume at t=0 particle is at origin.
Which of the following graph may be correct for the motion of particle
View Solution
