The graph given show the position of two cars A and B as a function of time. The cars move along the x axis on parallel but separate tracks, so that they can pass each other's position without colliding.
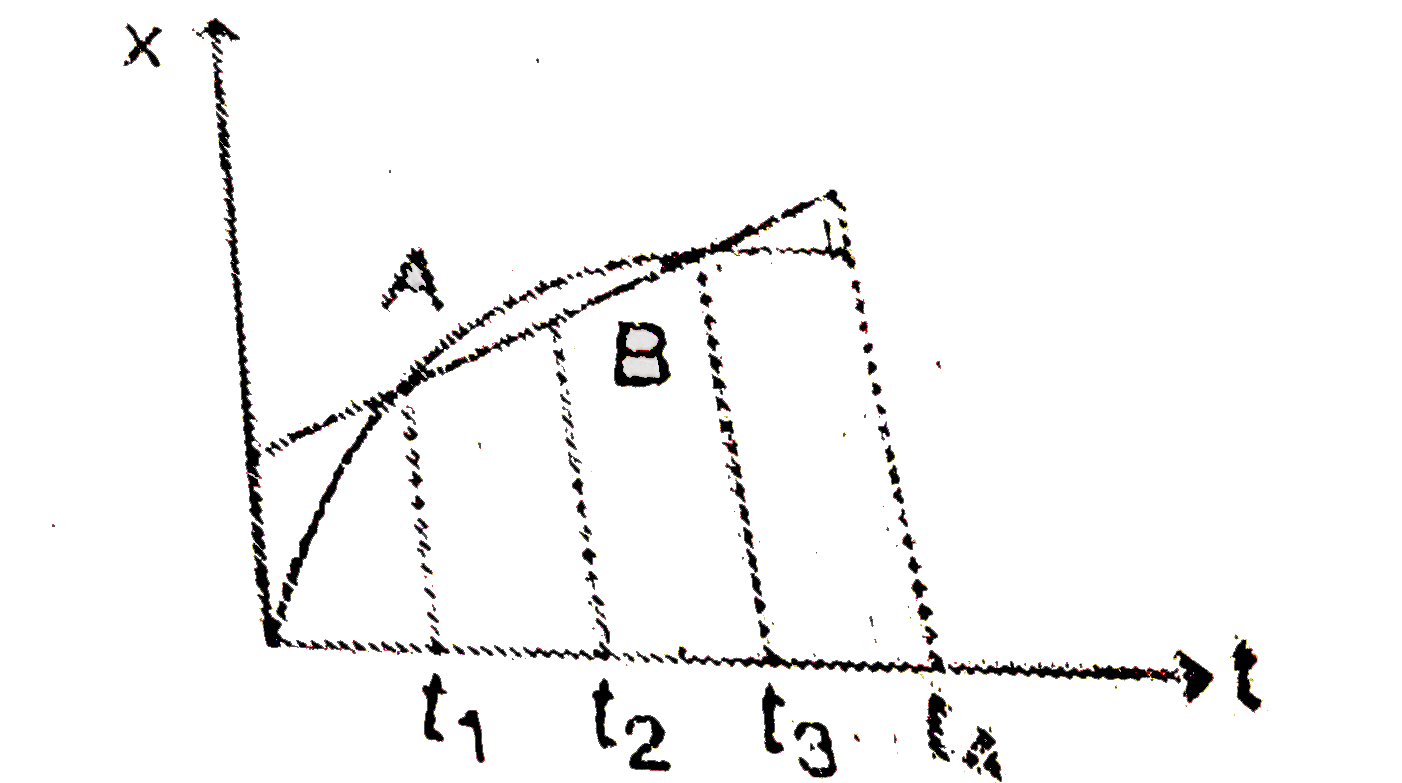
At time t3 which car is moving faster?
car A
car B
same sped
None of these
The correct Answer is:B
Step by step video & image solution for The graph given show the position of two cars A and B as a function of time. The cars move along the x axis on parallel but separate tracks, so that they can pass each other's position without colliding. At time t_(3) which car is moving faster? by Physics experts to help you in doubts & scoring excellent marks in Class 11 exams.
Updated on:21/07/2023Topper's Solved these Questions
- KINEMATICS 1BOOK - DC PANDEY ENGLISHCHAPTER - KINEMATICS 1EXERCISE - MATCH THE COLUMN
10 Videos
- KINEMATICS 1BOOK - DC PANDEY ENGLISHCHAPTER - KINEMATICS 1EXERCISE - INTEGER_TYPE
15 Videos
- KINEMATICS 1BOOK - DC PANDEY ENGLISHCHAPTER - KINEMATICS 1EXERCISE - MCQ_TYPE
27 Videos
- KINEMATICSBOOK - DC PANDEY ENGLISHCHAPTER - KINEMATICSEXERCISE - INTEGER_TYPE
10 Videos
- LAWS OF MOTIONBOOK - DC PANDEY ENGLISHCHAPTER - LAWS OF MOTIONEXERCISE - Medical entrances gallery
39 Videos
Similar Questions
The graph given shows the positions of two cars, AandB, as a function of time. The cars move along the x-axis on parallel but separate tracks, so that they can pass each other's position without colliding. At which instant in time is car-A overtaking the car-B ?
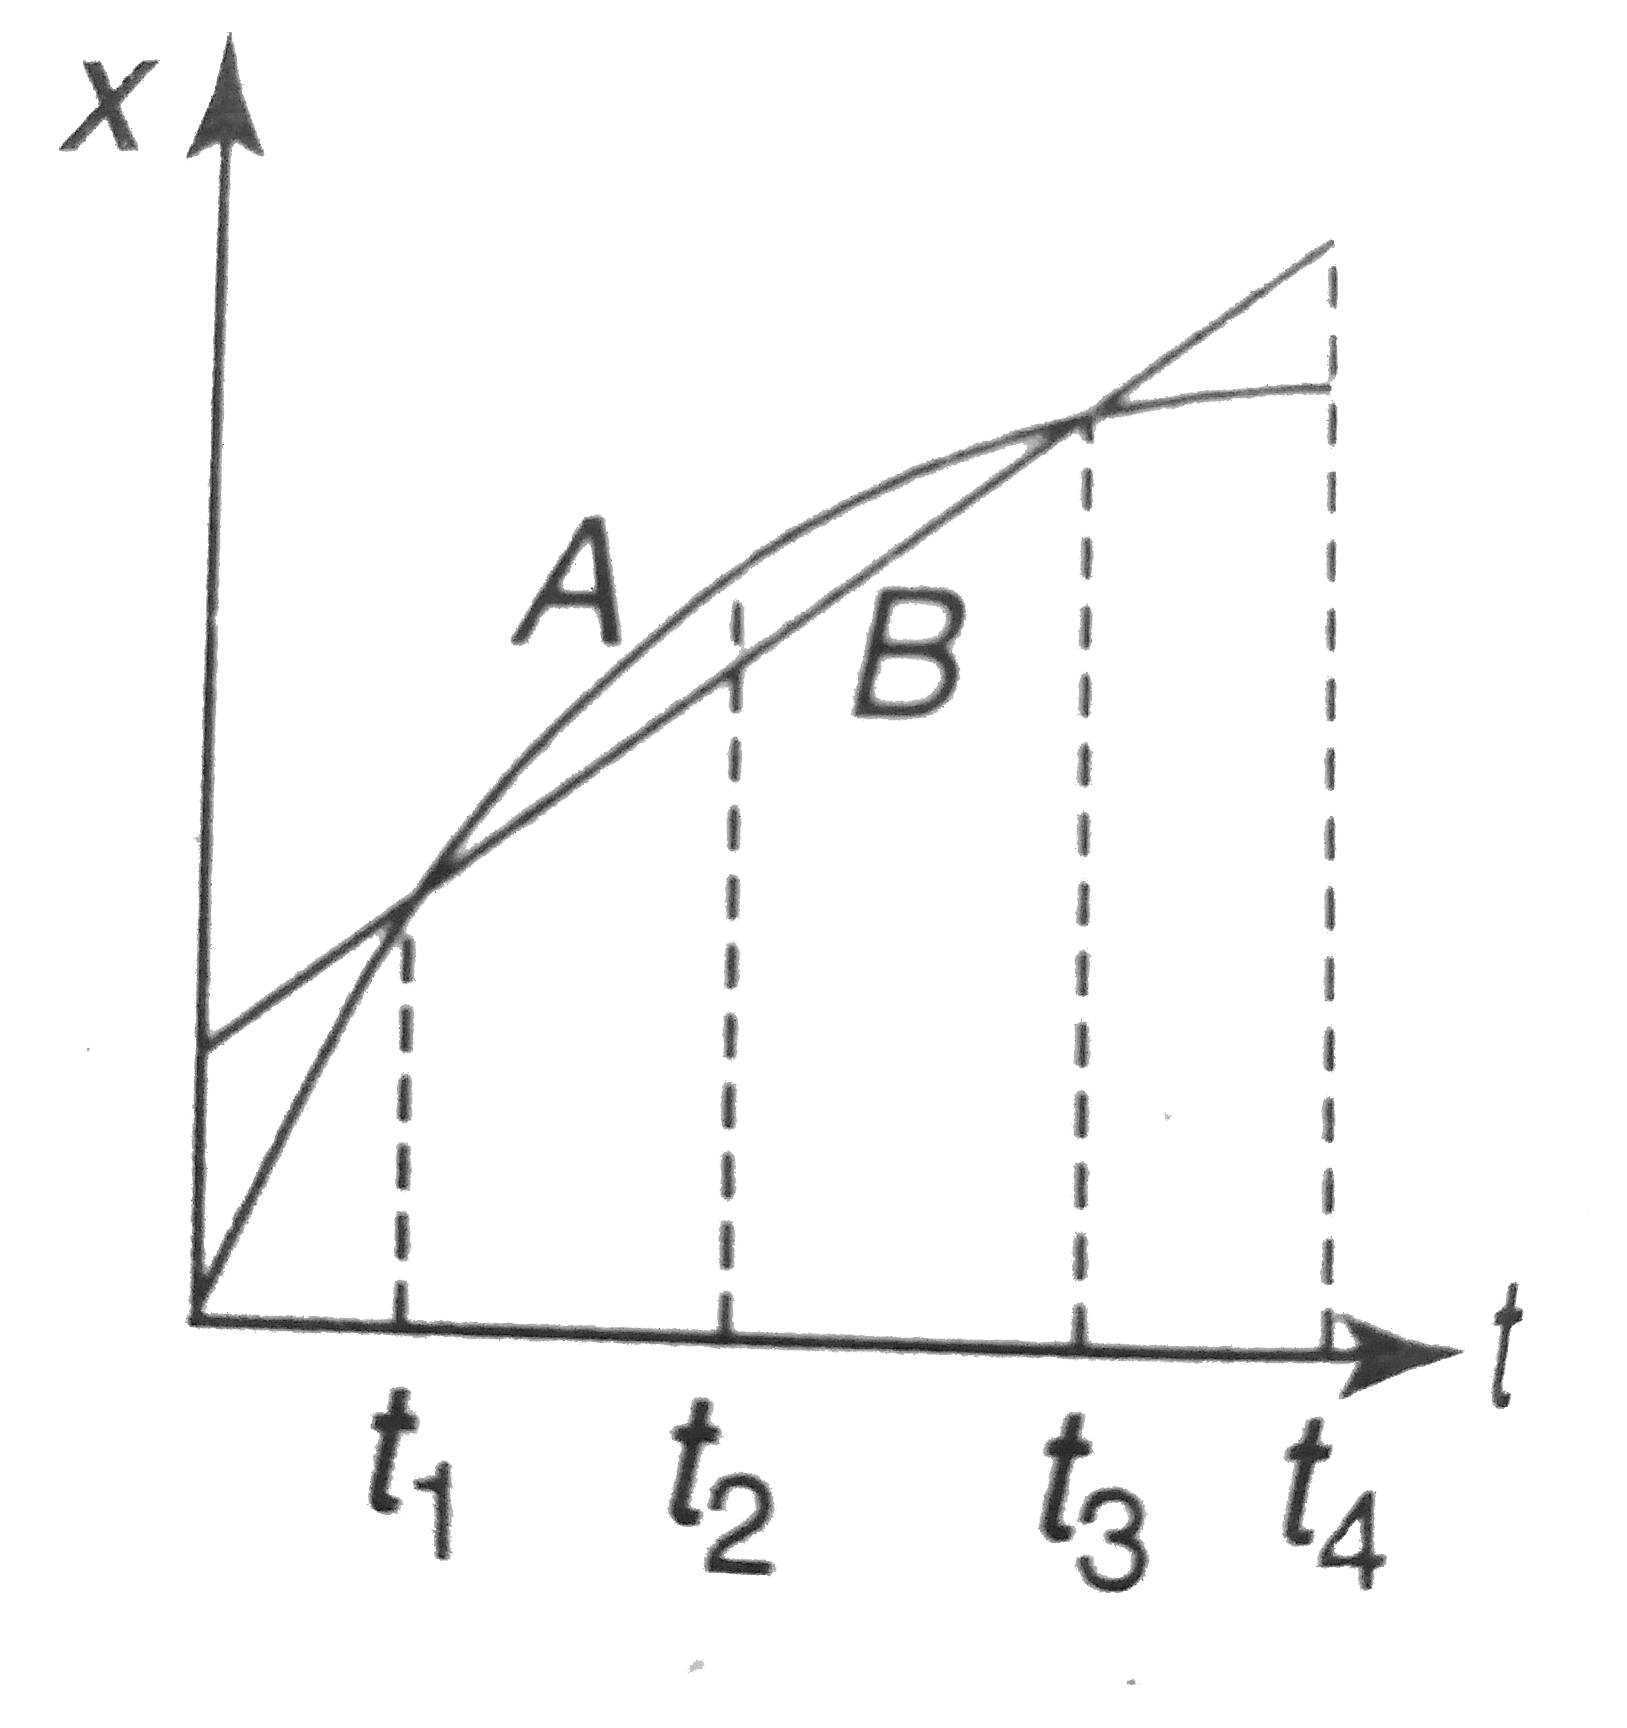
View SolutionThe graph given shows the positions of two cars, AandB, as a function of time. The cars move along the x-axis on parallel but separate tracks, so that they can pass each other's position without colliding. At which instant in time is car-A overtaking the car-B ?

View SolutionThe graph given show the position of two cars A and B as a function of time. The cars move along the x axis on parallel but separate tracks, so that they can pass each other's position without colliding.
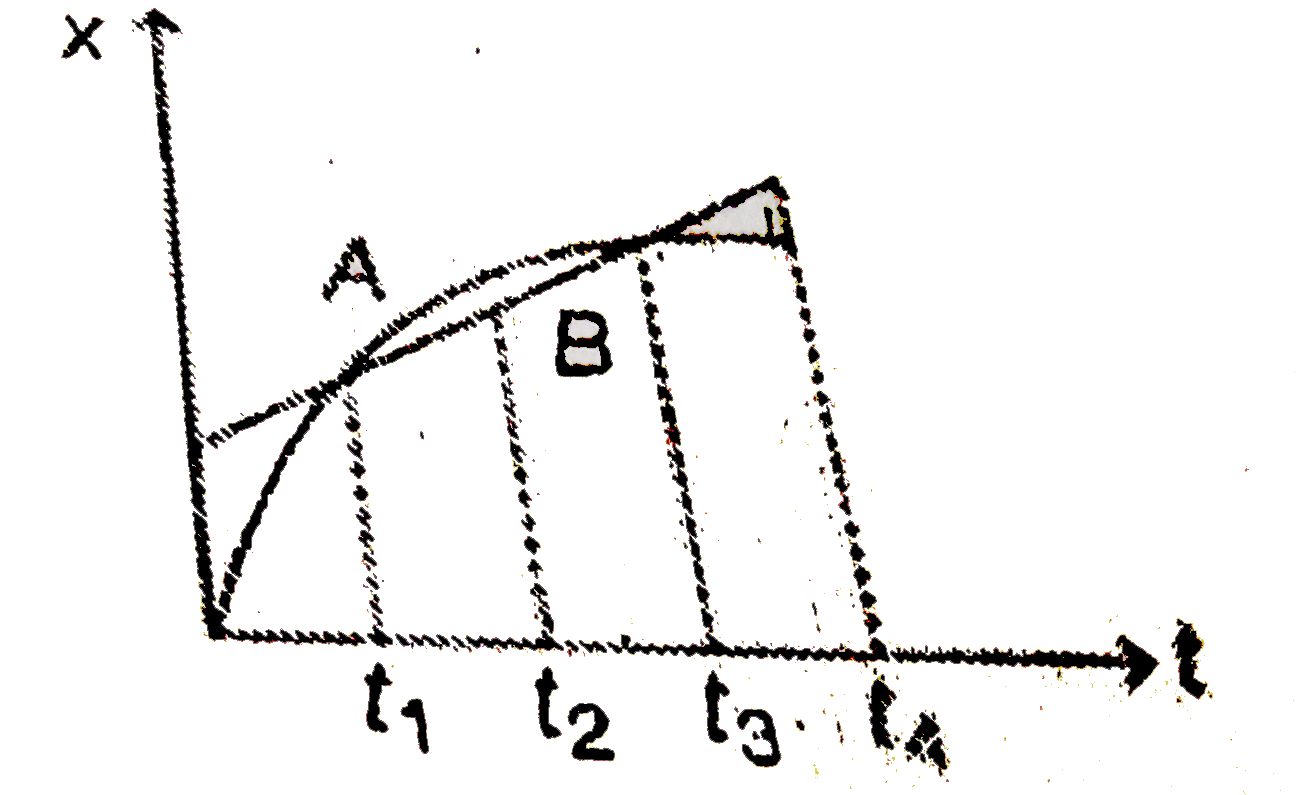
Which one of the following best describes the motion of car A as shown on the graphs?
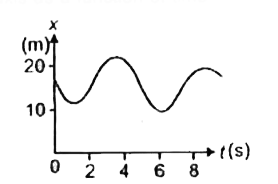
View SolutionFigure shows the position of a particle moving on the X-axis as a function of time.
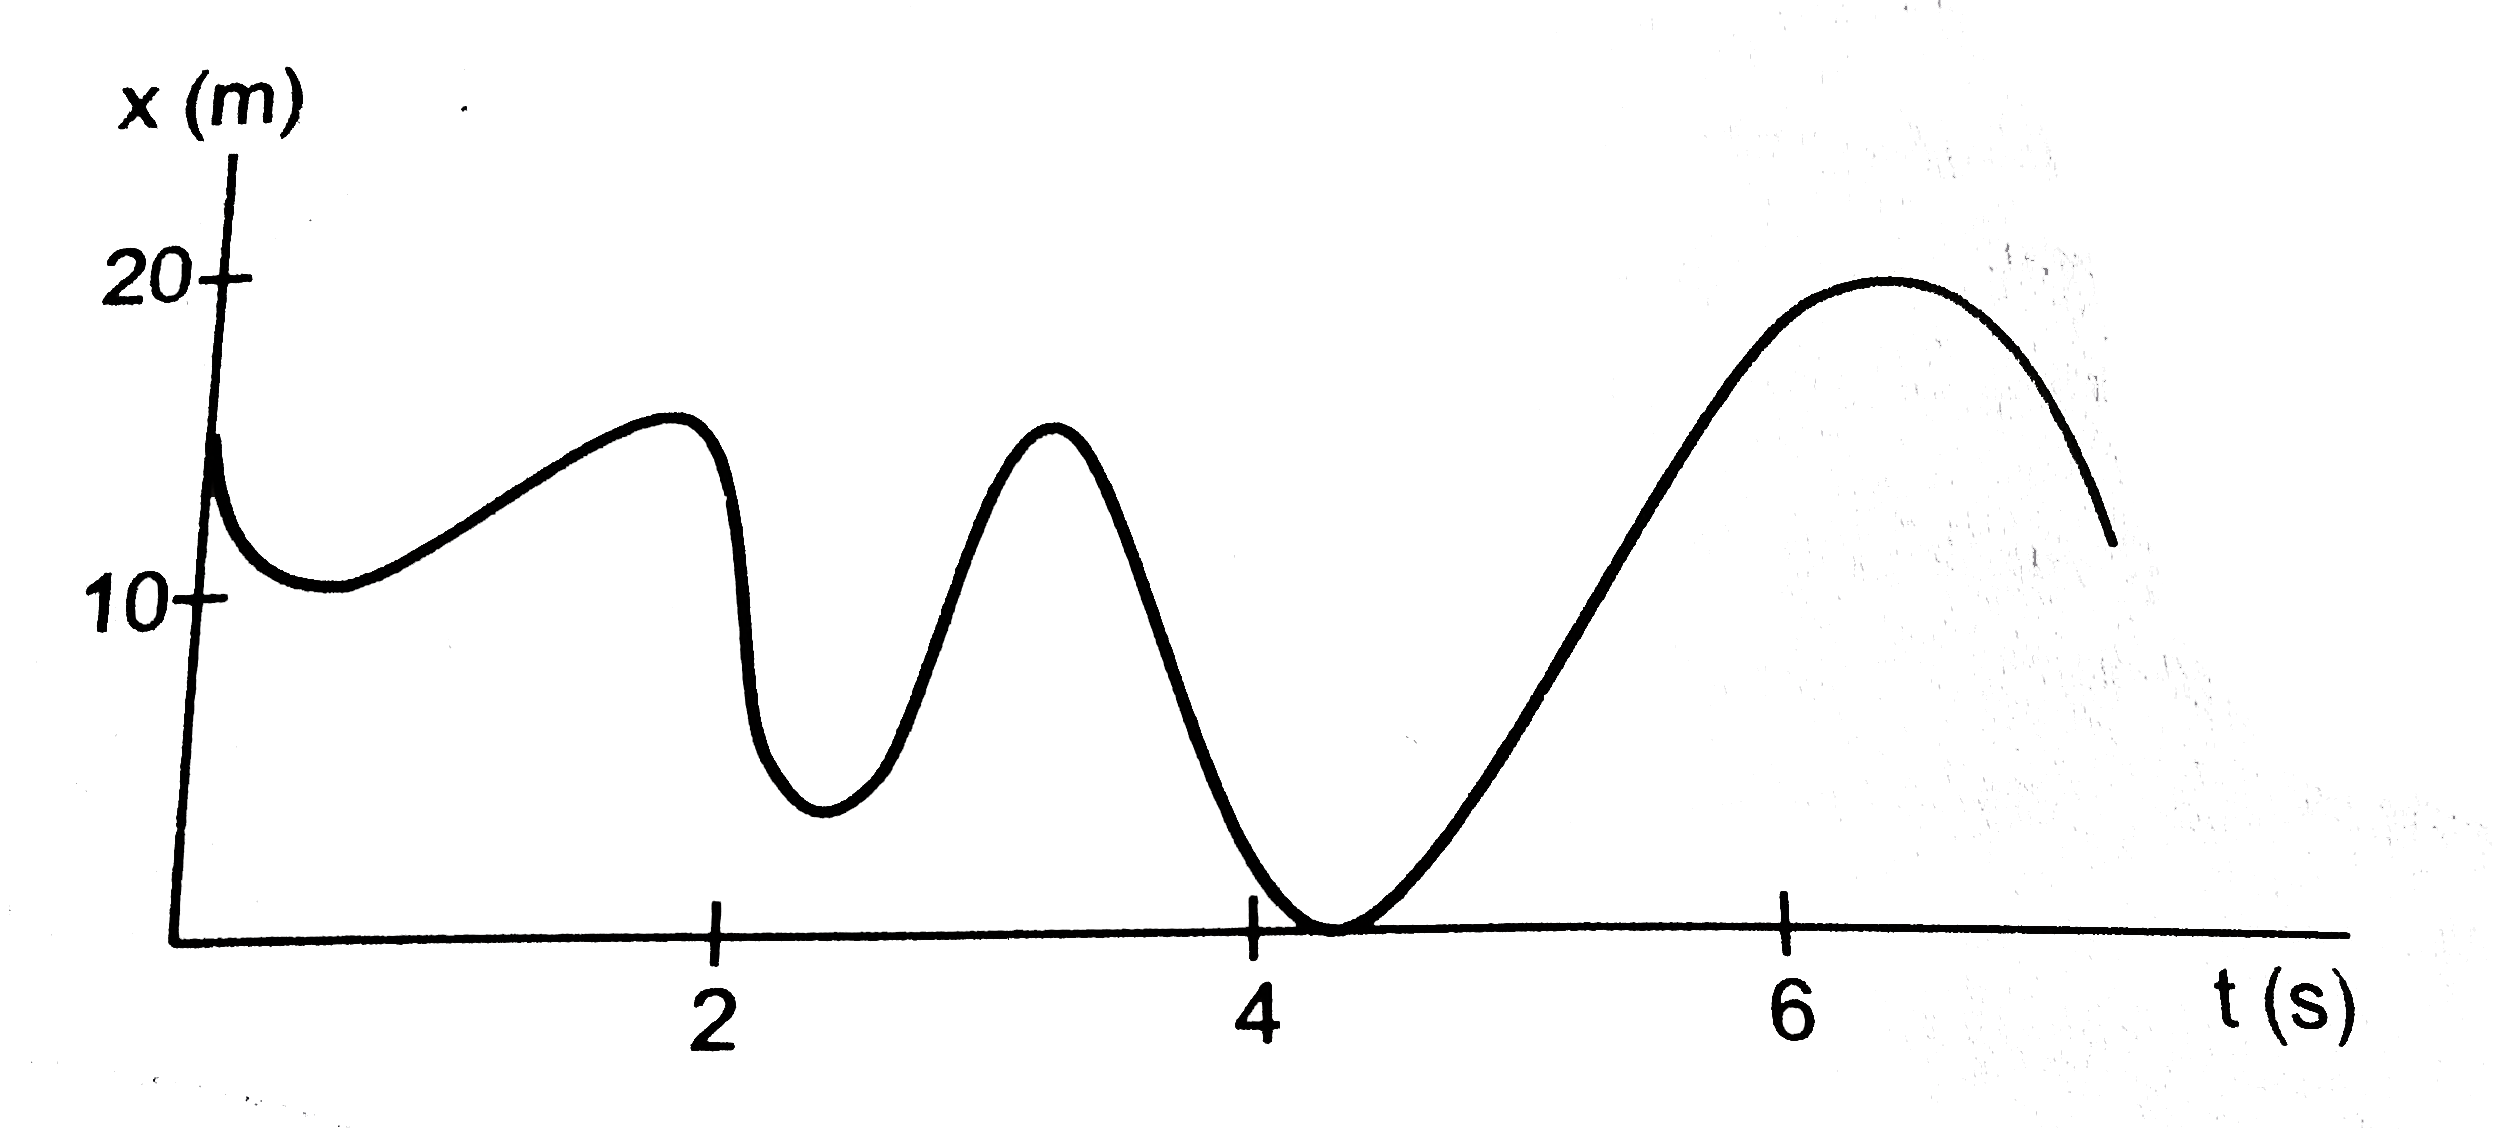
View SolutionFigure shows the position of a particle moving on the x - axis as a function of time
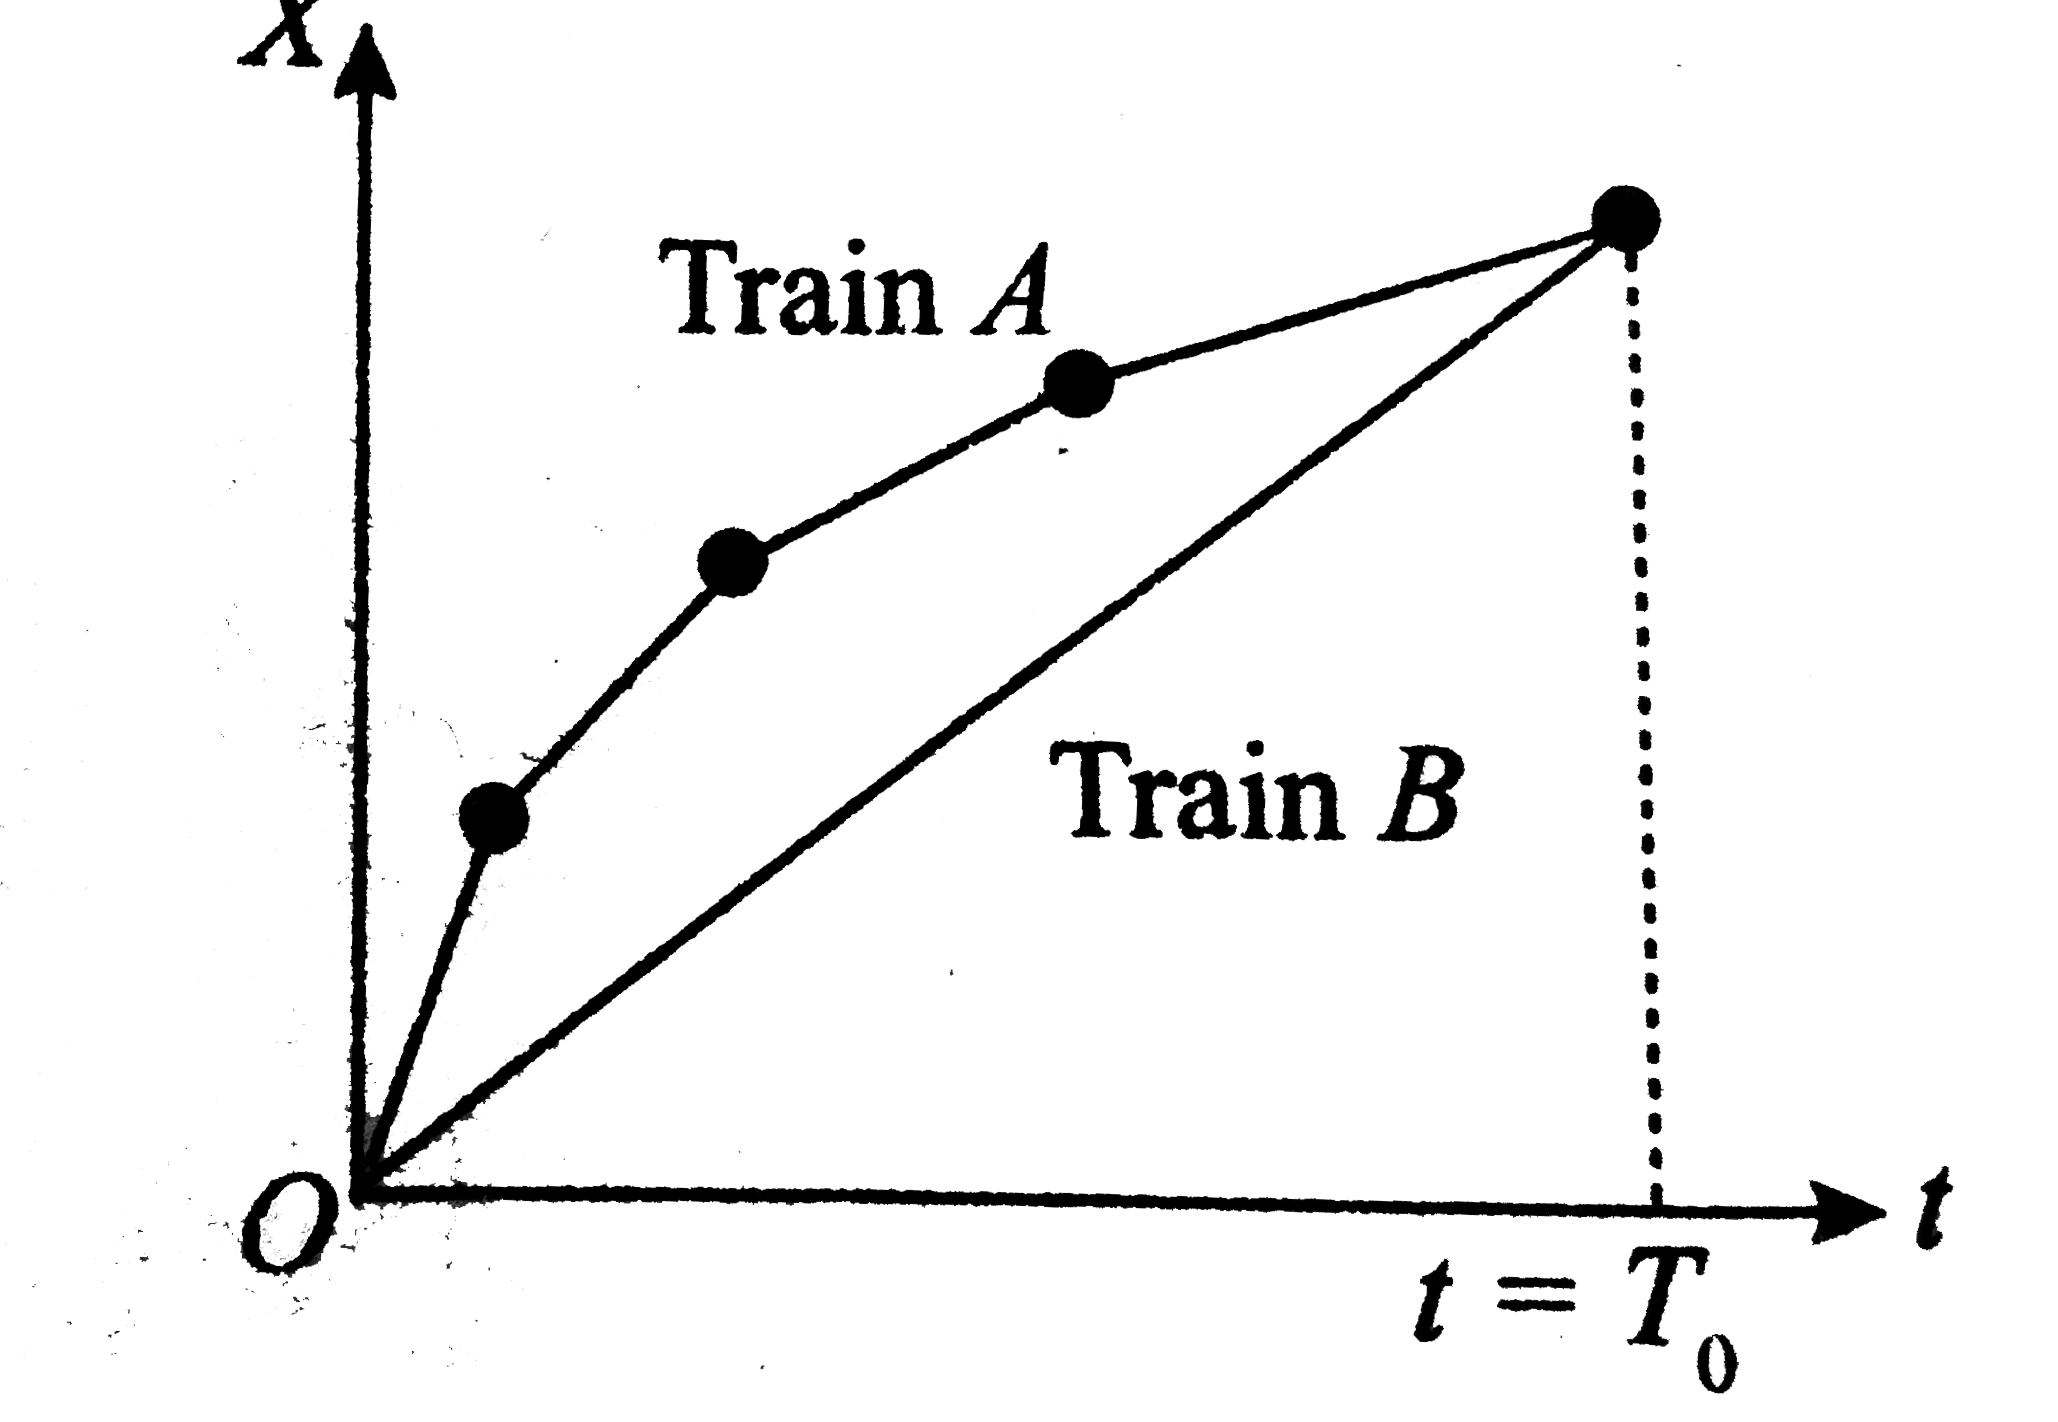
View SolutionThe plot shows the position (x) as a function of time (t) for two trains that run on a parallel track. Train A is next to train B at t=0 and at t=T0.
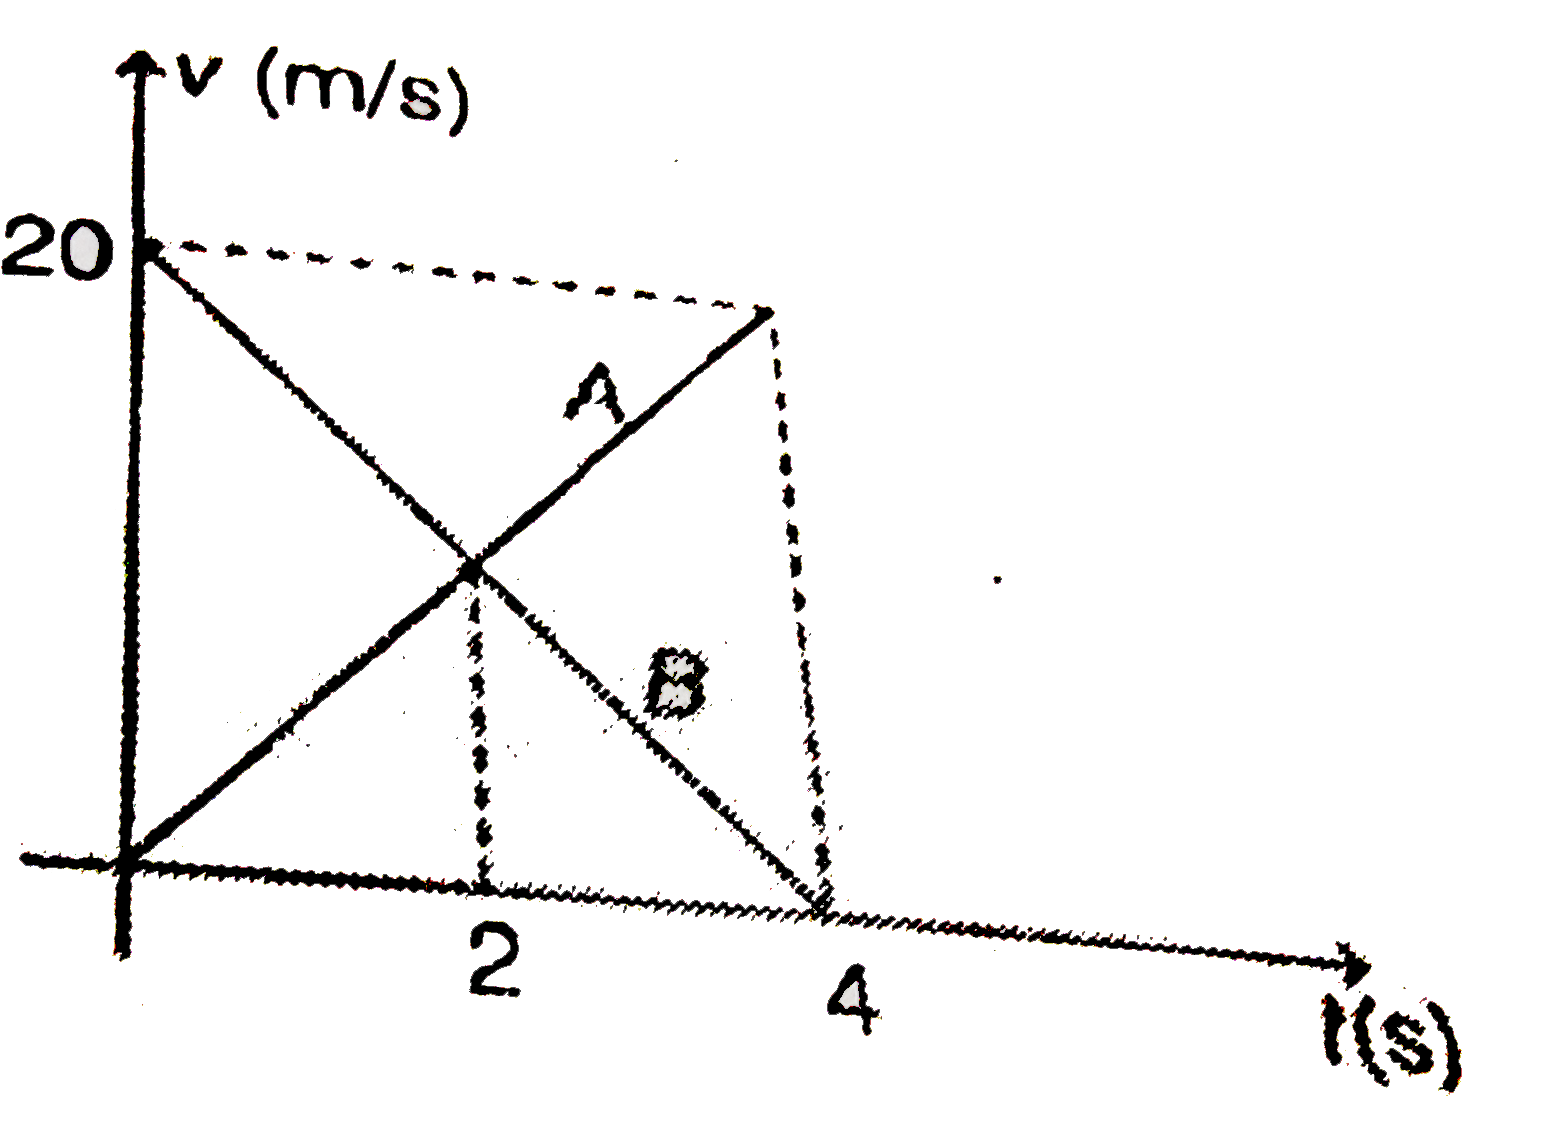
View SolutionSpeed time graph of two cars A and B approaching towards each other is shown in figure. Initial distance between them is 60m. The two cars will cross each other after t secons. Find value of it t.
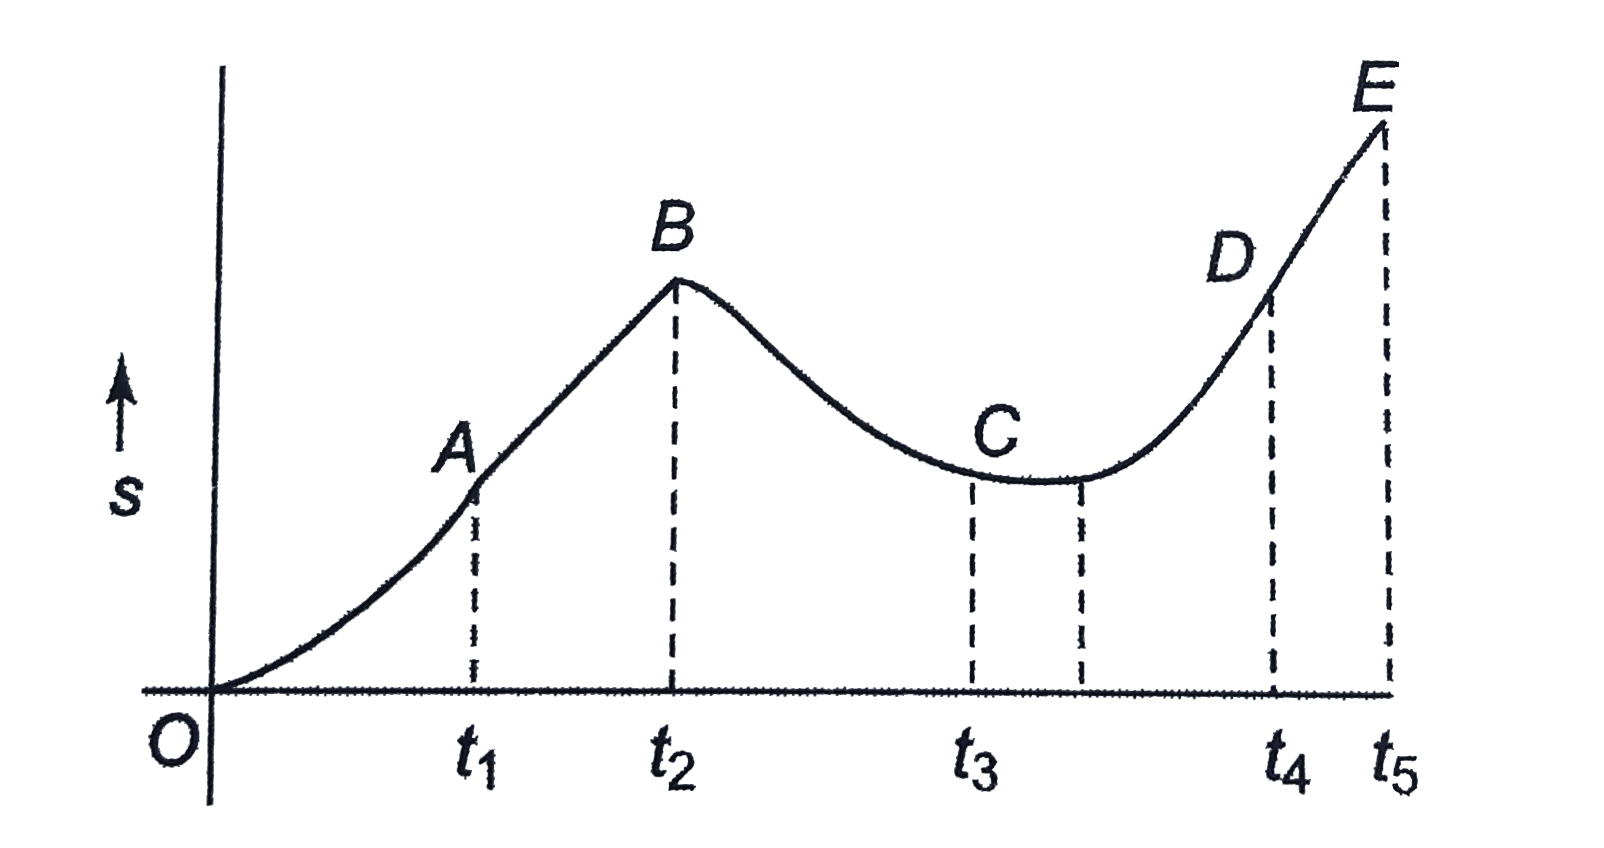
View SolutionA particle is moving along the x-axis and its position-time graph is shown. Determine the sign of acceleration.
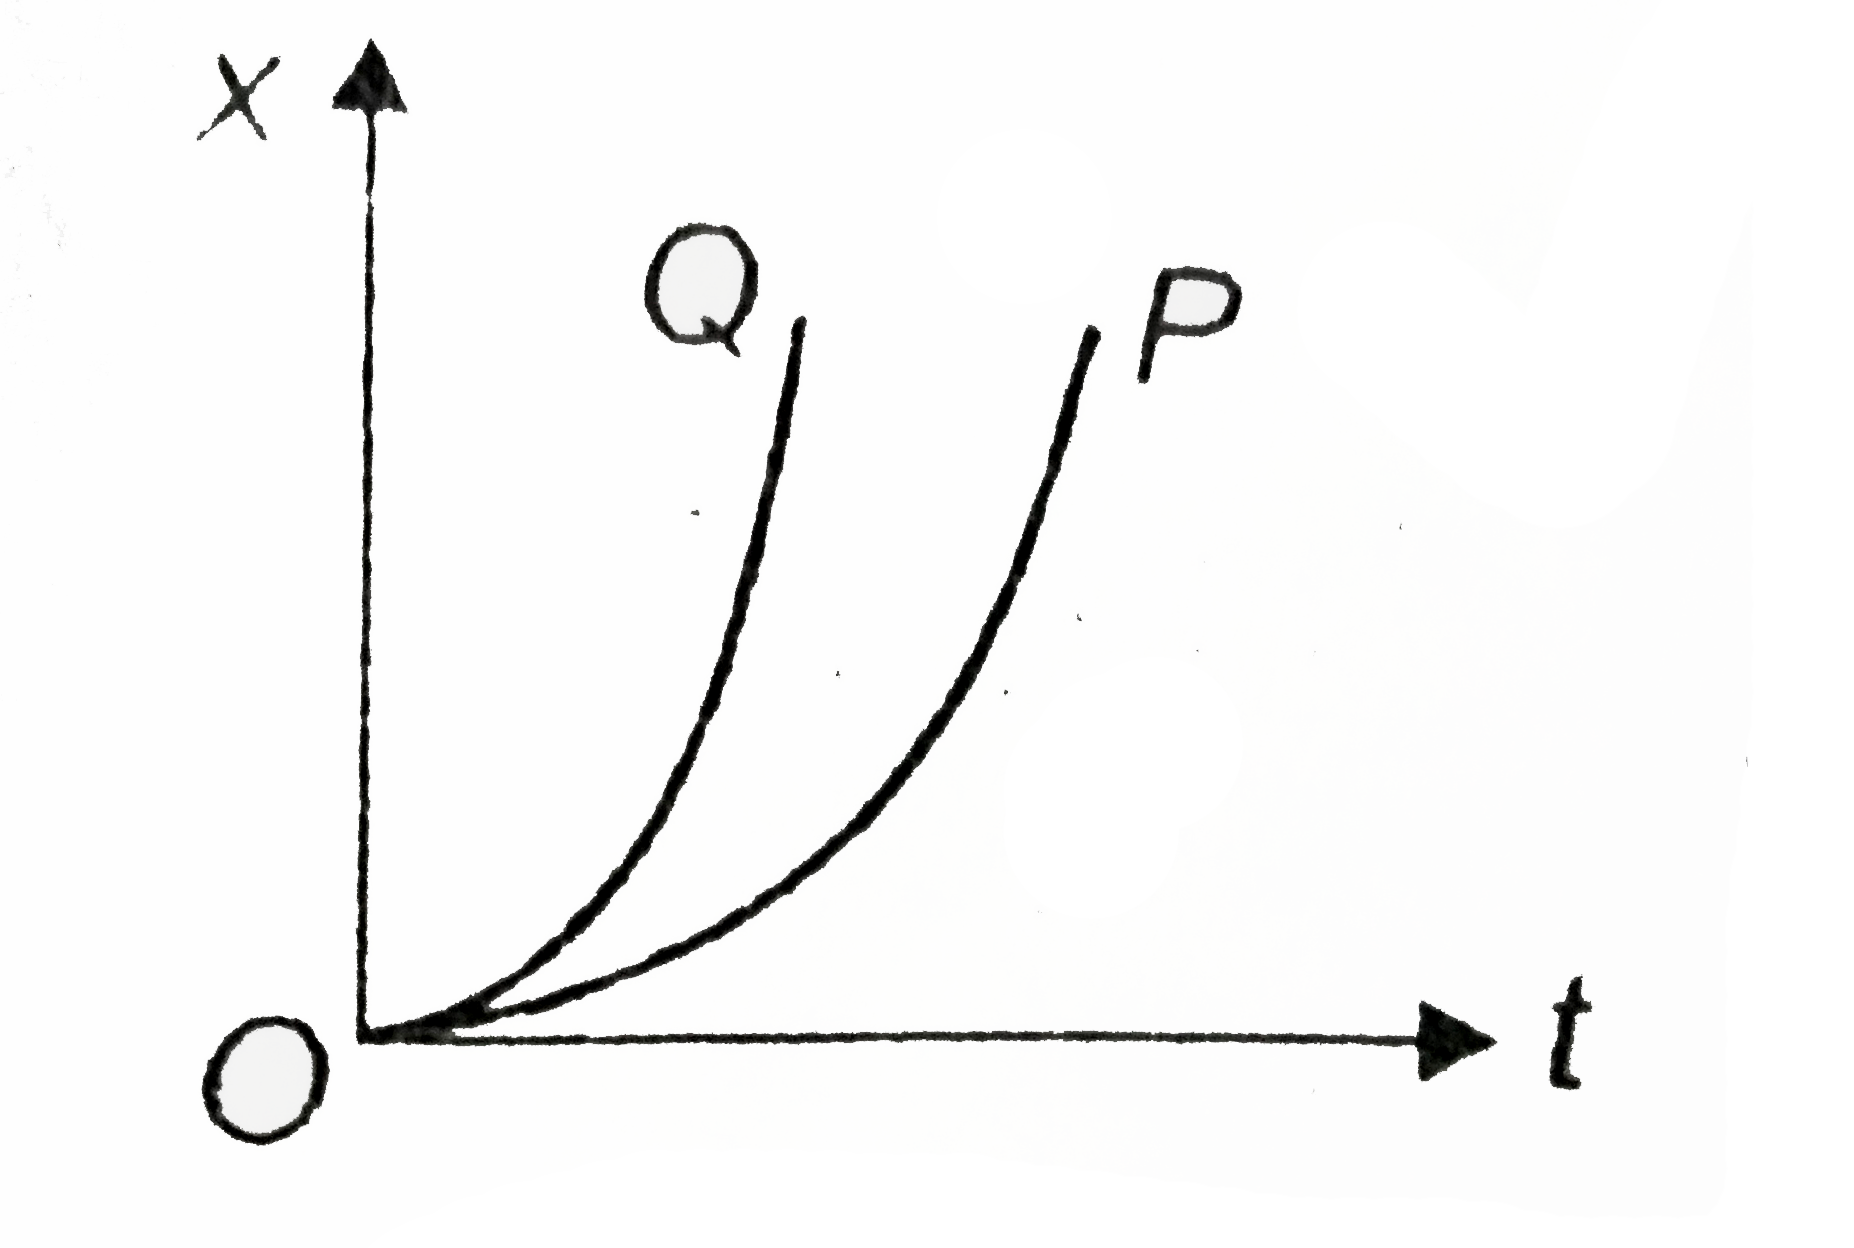
View SolutionThe position-time graph for two particles P and Q moving on x-axis is shown in the figure. Then
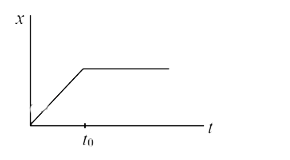
View SolutionFigure shows the position-time graph of a particle moving on the X--axis. Which of these option correctly describes the particle 's motion?
View Solution
