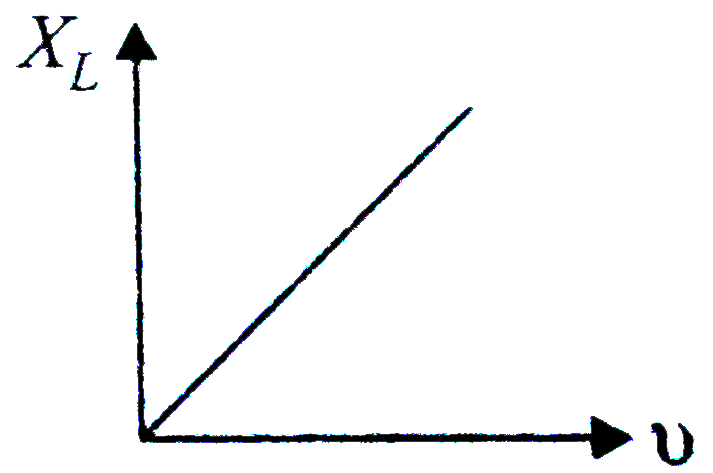
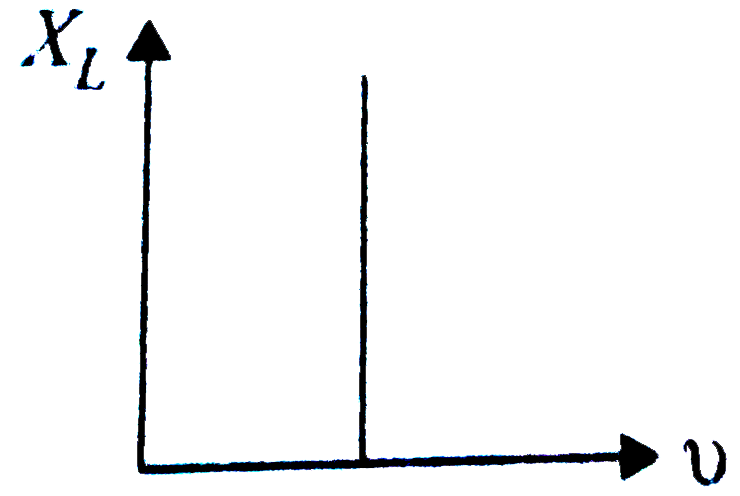
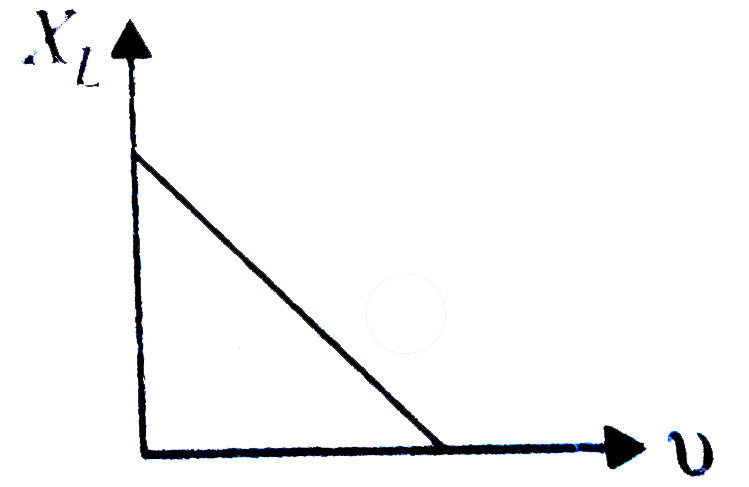
The graph gives the relation between the inductive reactance (X1) of an inductor against the frequency of the applied e.m.f. What is the value of the inductance?

1.2×10⁻³H
2.2×10⁻³H
3.2×10⁻³H
4.2×10⁻³H
The correct Answer is:C
Inductive reactance XL=2πfL,∴L=XL2πf
Slope of (XL−f) graph = XLf
∴L=XL2πf=12π (slope of XL−f graph)
=12π[4−0200−0]=12π×150=1100π
=10−2π=10×10−33.14÷3.2×10⁻³H.
Topper's Solved these Questions
- ELECTROMAGNETIC INDUCTION AND ALTERNATING CURRENTS BOOK - MARVEL PUBLICATIONCHAPTER - ELECTROMAGNETIC INDUCTION AND ALTERNATING CURRENTS EXERCISE - TEST YOUR GRASP - 16
30 Videos
- ELASTICITYBOOK - MARVEL PUBLICATIONCHAPTER - ELASTICITYEXERCISE - Test Your Grasp - 5
15 Videos
- ELECTRONS AND PHOTONS BOOK - MARVEL PUBLICATIONCHAPTER - ELECTRONS AND PHOTONS EXERCISE - TEST YOUR GRASP - 17
15 Videos
Similar Questions
Sketch a graph showing the variation of reactance of an inductor with frequency of the applied voltage
View Solution(i) Draw the graphs showing variation of inductive reactance and capacitive reactance with frequency of applied a.c. source.
(ii) Can the voltage drop across the inductor or the capacitor in a series LCR circuit be greater than the applied voltage of the a.c. source ? Justify your answer.
View Solution
Knowledge Check
The graph between inductive reactance and frequency is
AparabolaBstraight lineChyperbolaDan arc of a circleWhich of the following graphs represent the correct variation of inductive reactance XL with frequency υ?
A B
B C
C D
D
Which of the following graphs represent the correct variation of inductive reactance XL with frequency υ?
A B
B C
C D
D
Draw a labelled graph showing the variation of inductive reactance (XL) verses frequency (f)
View SolutionWhat happens to the inductive reactance and the current in a purely inductive circuit if the frequency is halved ?
View SolutionAssertion: Inductive reactance of an inductor in DC circuit is zero.
Reason: Angular frequency of DC circuit is zero.
View SolutionExplain the term 'inductive reactance'.Show graphically the variation of inductive reactance with frequency of the applied alternating voltage.
An a.c. voltage E=E0sinωt is applied across a pure inductor L.Show mathematically that the current flowing through it lags behind the applied voltage by a phase angle of π/2.
View SolutionAssertion: Inductive reactance of an inductor in DC circuit is zero.
Reason: Angular frequency of DC circuit is zero.
View Solution
