The graph in Figure shows the positions of a body at different times. Calculate the speed of the body as it moves from (i) A to B (ii) B to C and (iii) C to D.
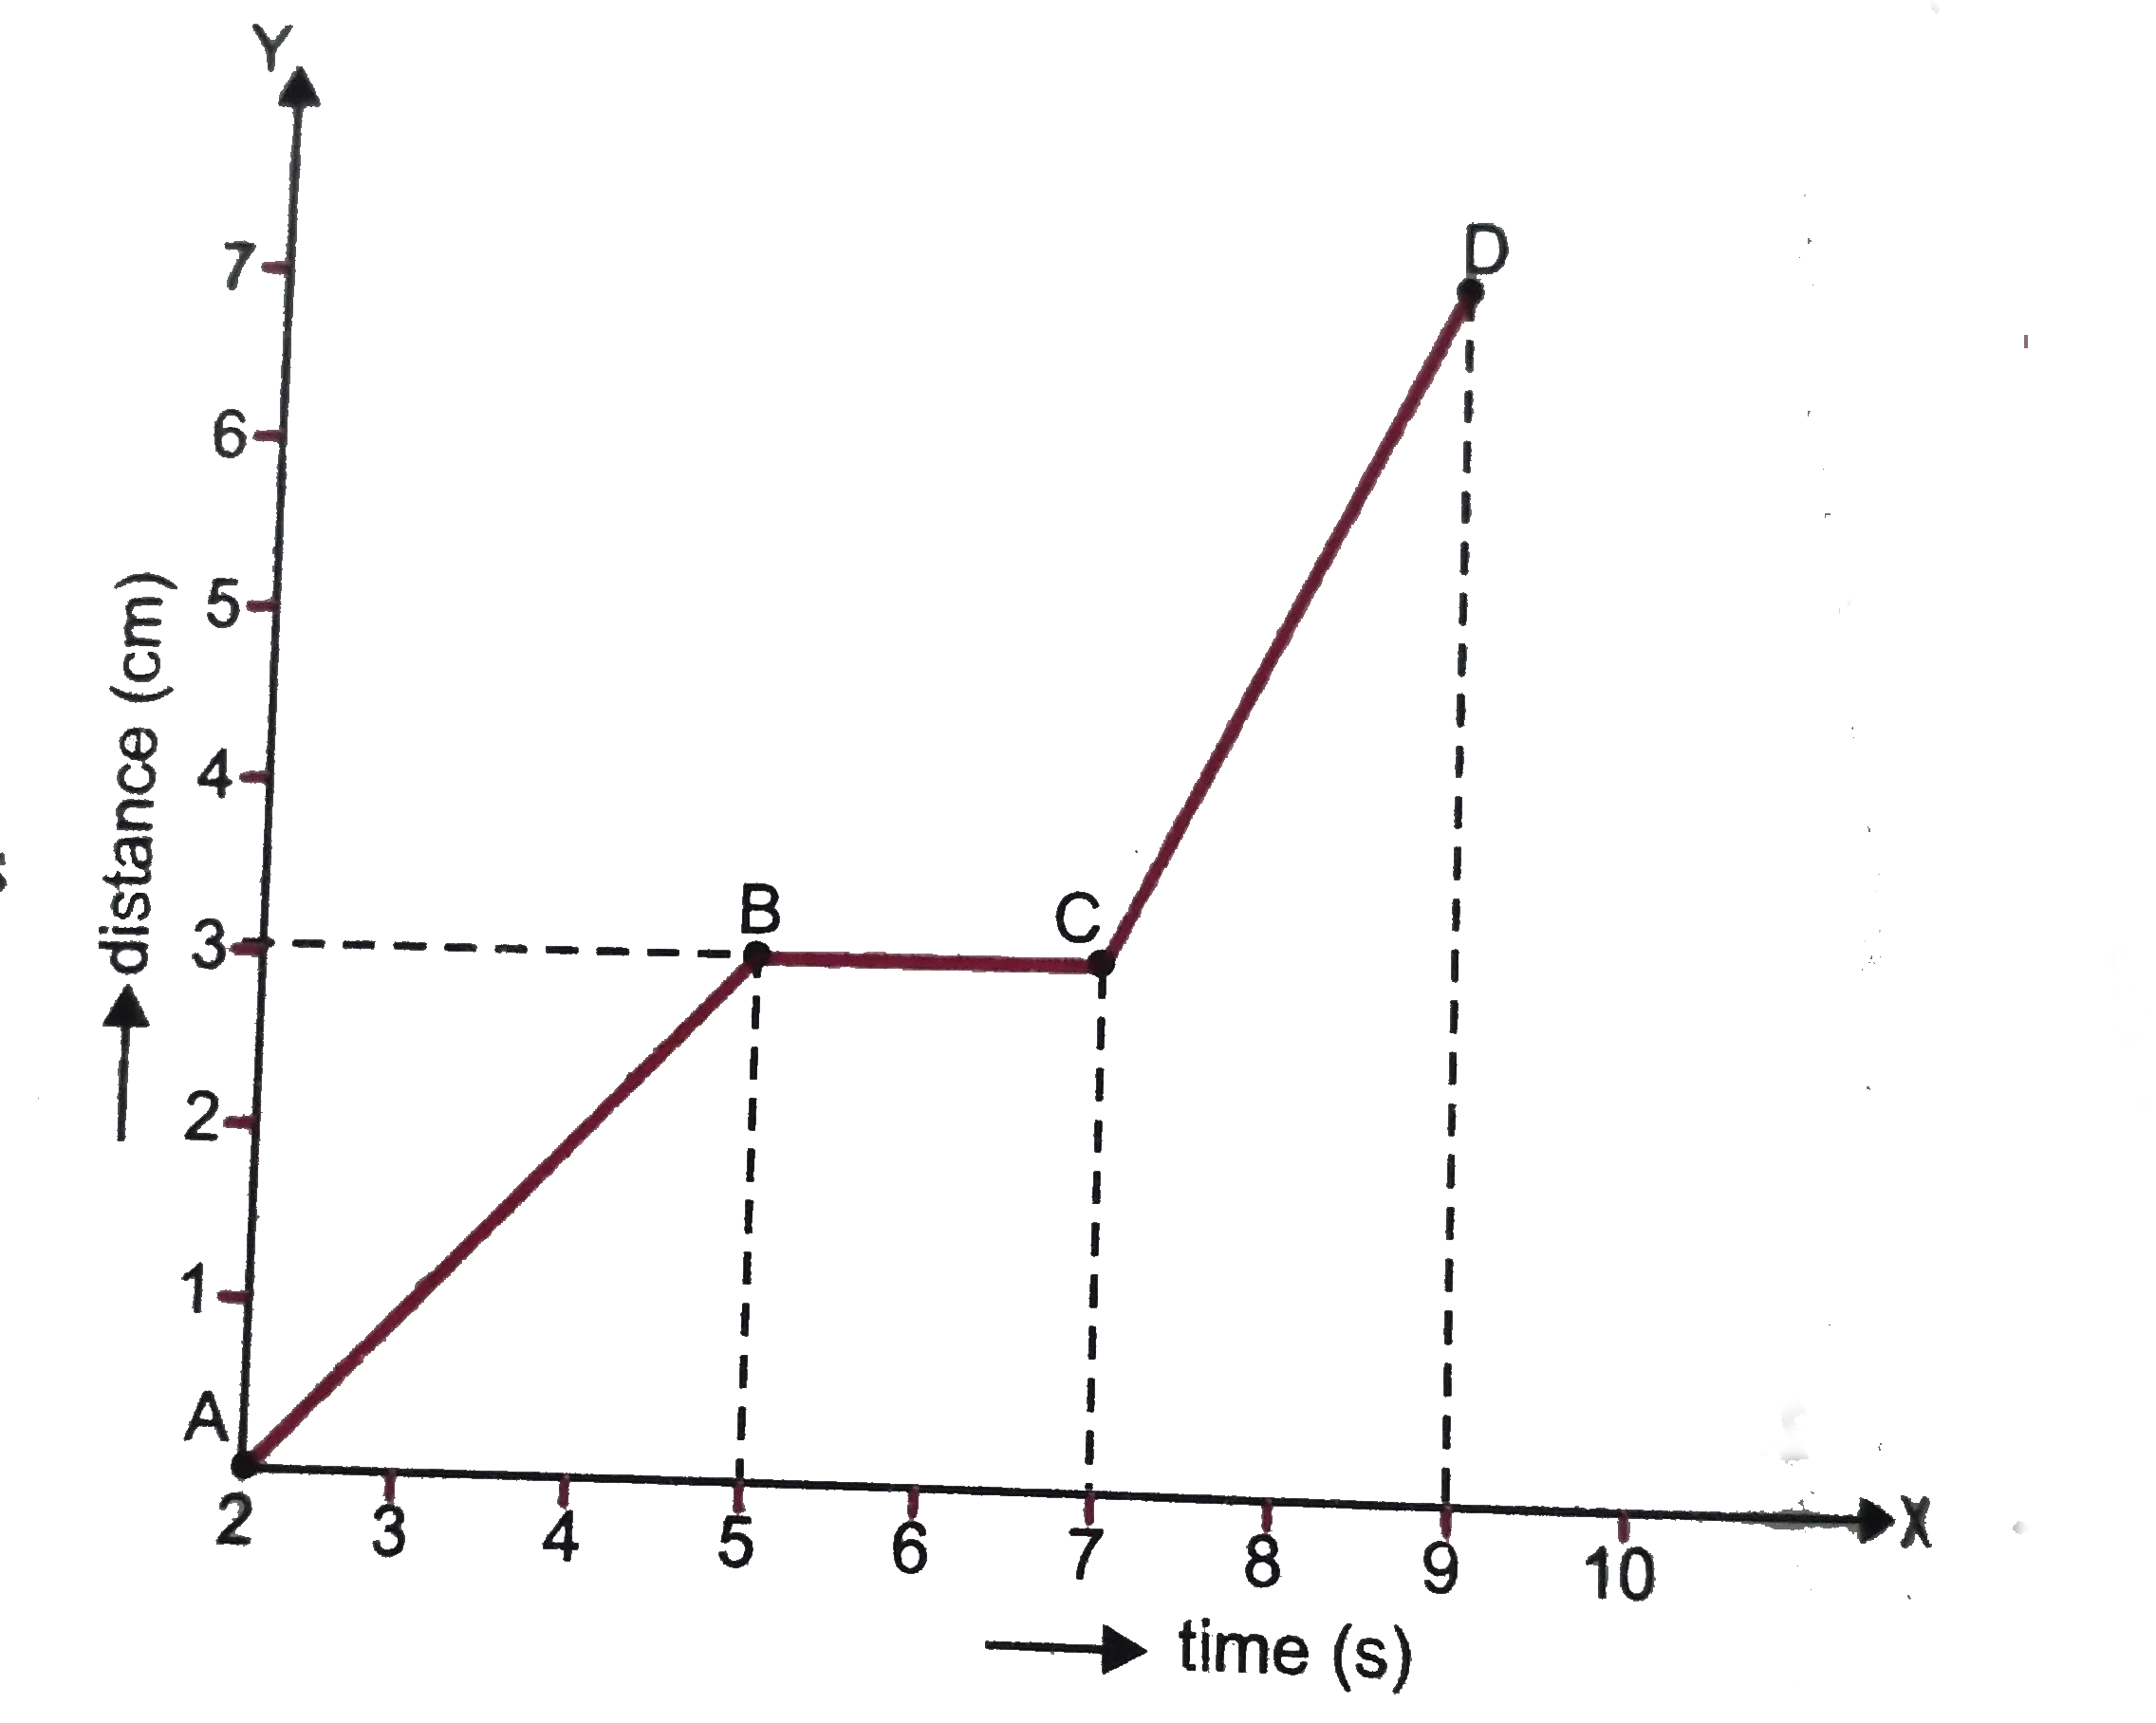
(i) In moving from A to B,
distance moved (s1)=(3−0)cm=3cm
time taken (t1)=(5−2)s=3s
Thus , speed , v1=s1t1=33=1cm/s
(ii) In moving from B to C ,
distance moved , s2=0
time taken ,t2=7−5=2s
Thus , speed , v2=s2t2=02=0
(iii) In moving from C to D , distance moved ,
s3=7−3=4cm , time taken , t3=9−7=2s
Thus , speed , v3=s3t3=42=2cm/s
Topper's Solved these Questions
- MOTIONBOOK - PRADEEPCHAPTER - MOTIONEXERCISE - NCERT queations
20 Videos
- MOTIONBOOK - PRADEEPCHAPTER - MOTIONEXERCISE - NCERT Exercises
10 Videos
- GRAVITATIONBOOK - PRADEEPCHAPTER - GRAVITATIONEXERCISE - Model Test paper (1)
36 Videos
- SOUNDBOOK - PRADEEPCHAPTER - SOUNDEXERCISE - Model Test (sec - B)
12 Videos
Similar Questions
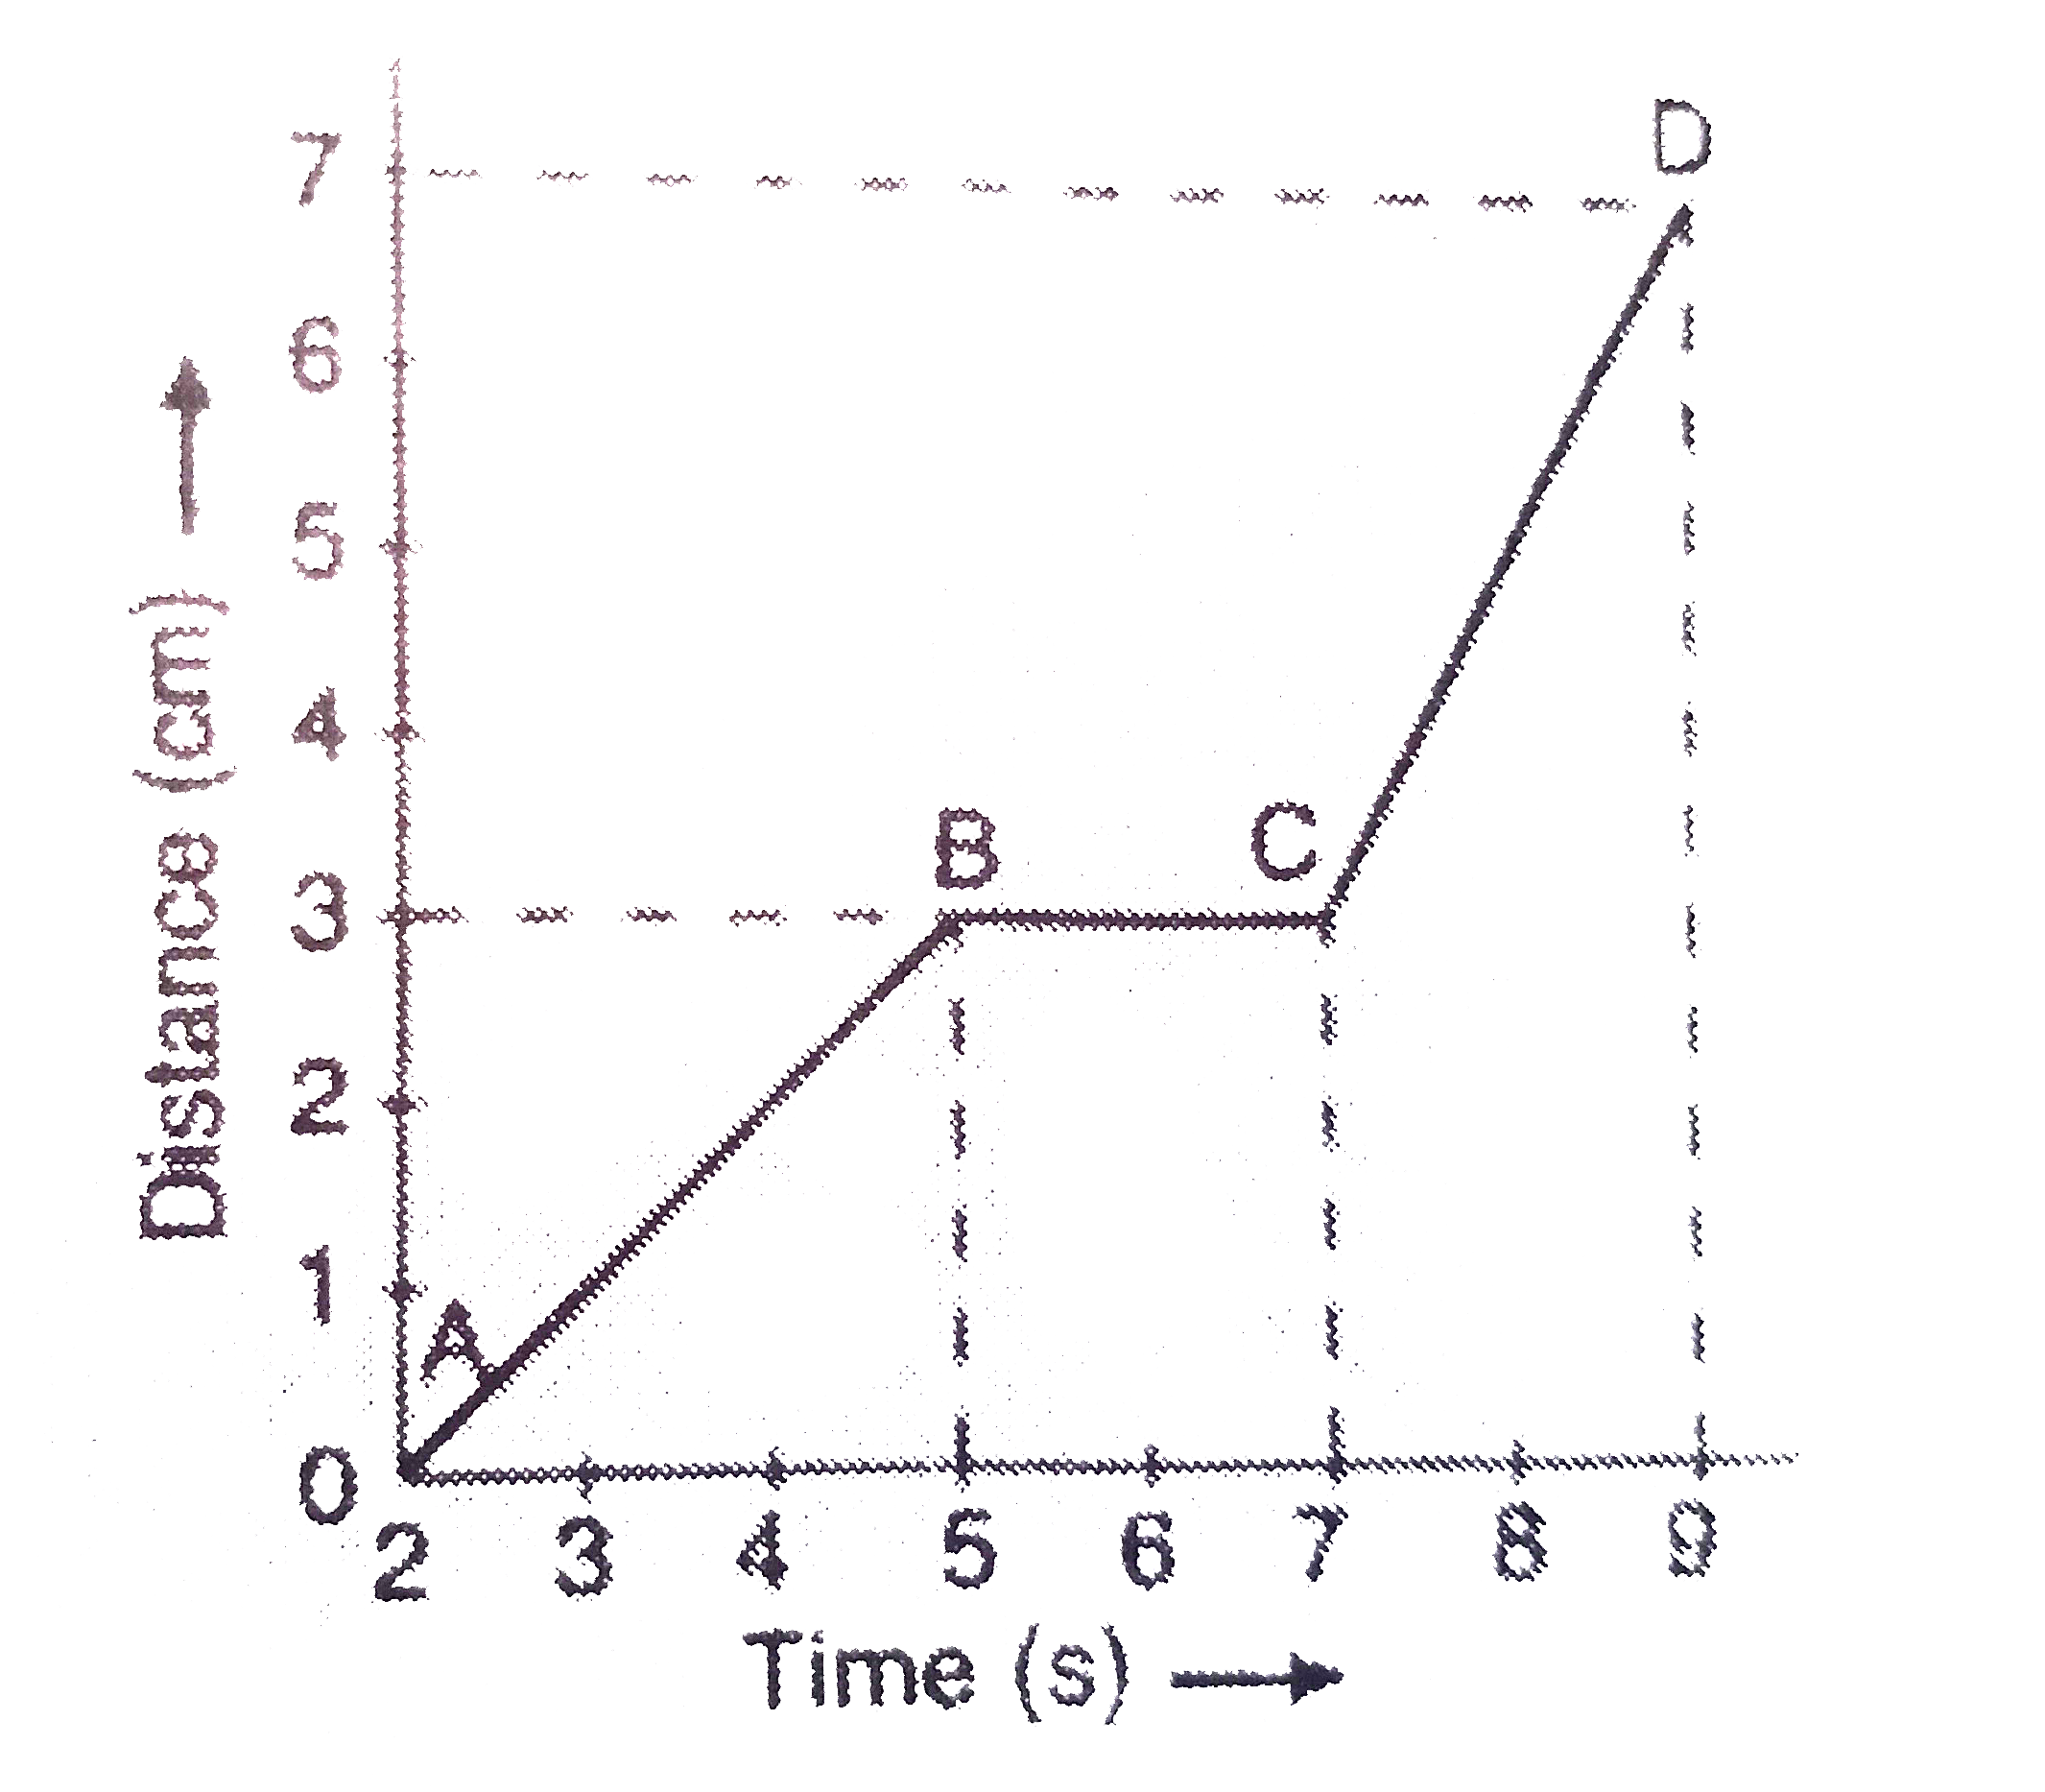
The graph given alongside shows the positions of a body at different times. Calculate the speed of the body as it moves from :
(i) A to B,
(ii) B to C, and
(iii) C to D.
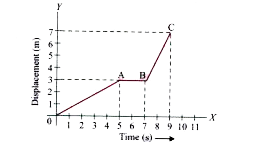
View SolutionIn the figure, the displacement of a body is shown at different instants of time.
(i) Calculate the velocity of the body as it moves for (a) 0s to 5 s, (b) 5 s to 7 s, and (c) 7 s to 9 s.
(ii) Also, calculate the average velocity during the time interval 7 s to 9 s.
View Solution
Knowledge Check
The following figure shows the velocity time graph of a body. According to this at the point B-
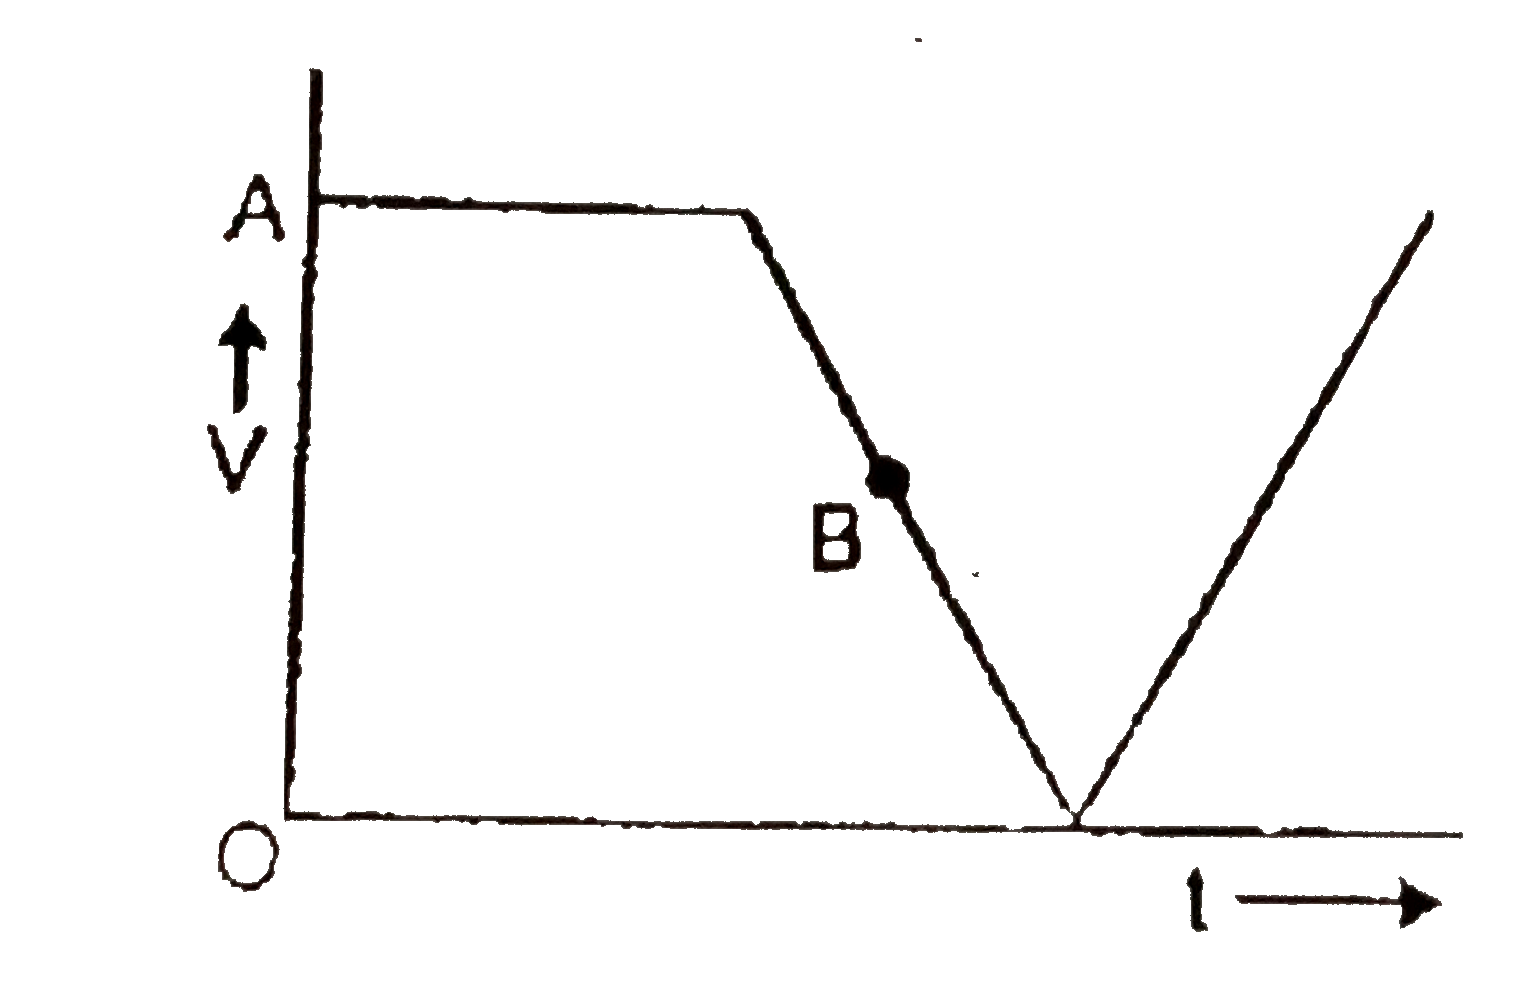 AThe force is zeroBThe force is in the direction of the motionCThe force is in opposite direction of the motionDIt is only the gravitational force
Figure shows position-time graph of two cars A and B.
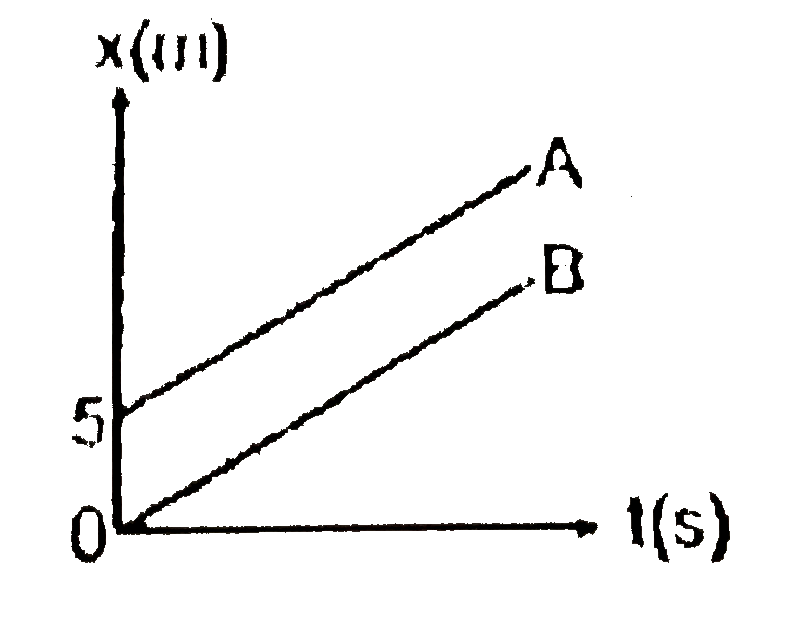 ACar A is faster than car B.BCar B is faster than car A.CBoth cars are moving with same velocity.DBoth cars have positive acceleration.
The following figure-1.105 shows the velocity-time graph ofa body. According to this, at the point B:
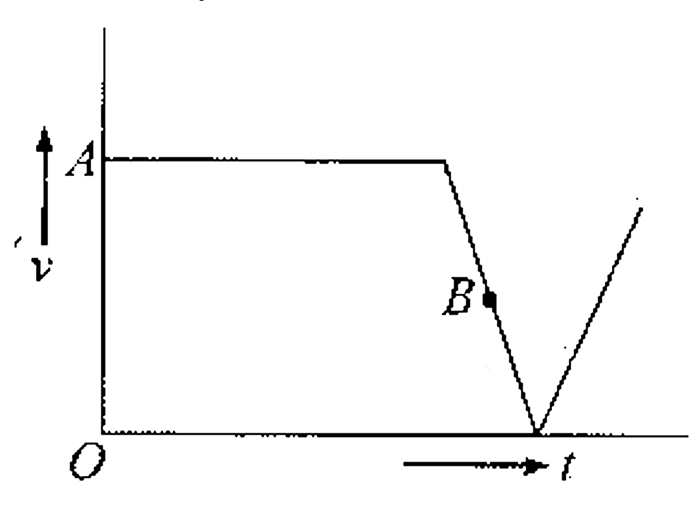 AThe force is zeroBThe force is in the direction of the motionCThe force is in opposite direction of the motionDIt is only the gravitational force
The speed time graph of a body of mass 50kg is shown in (figure). Calculate the force acting in the body
(i)from 0 to 4s (ii)from 4 to 6s

View SolutionThe speed time graph of a body of mass 300g is shown in (fugure). Calculate the force actiong on the body.
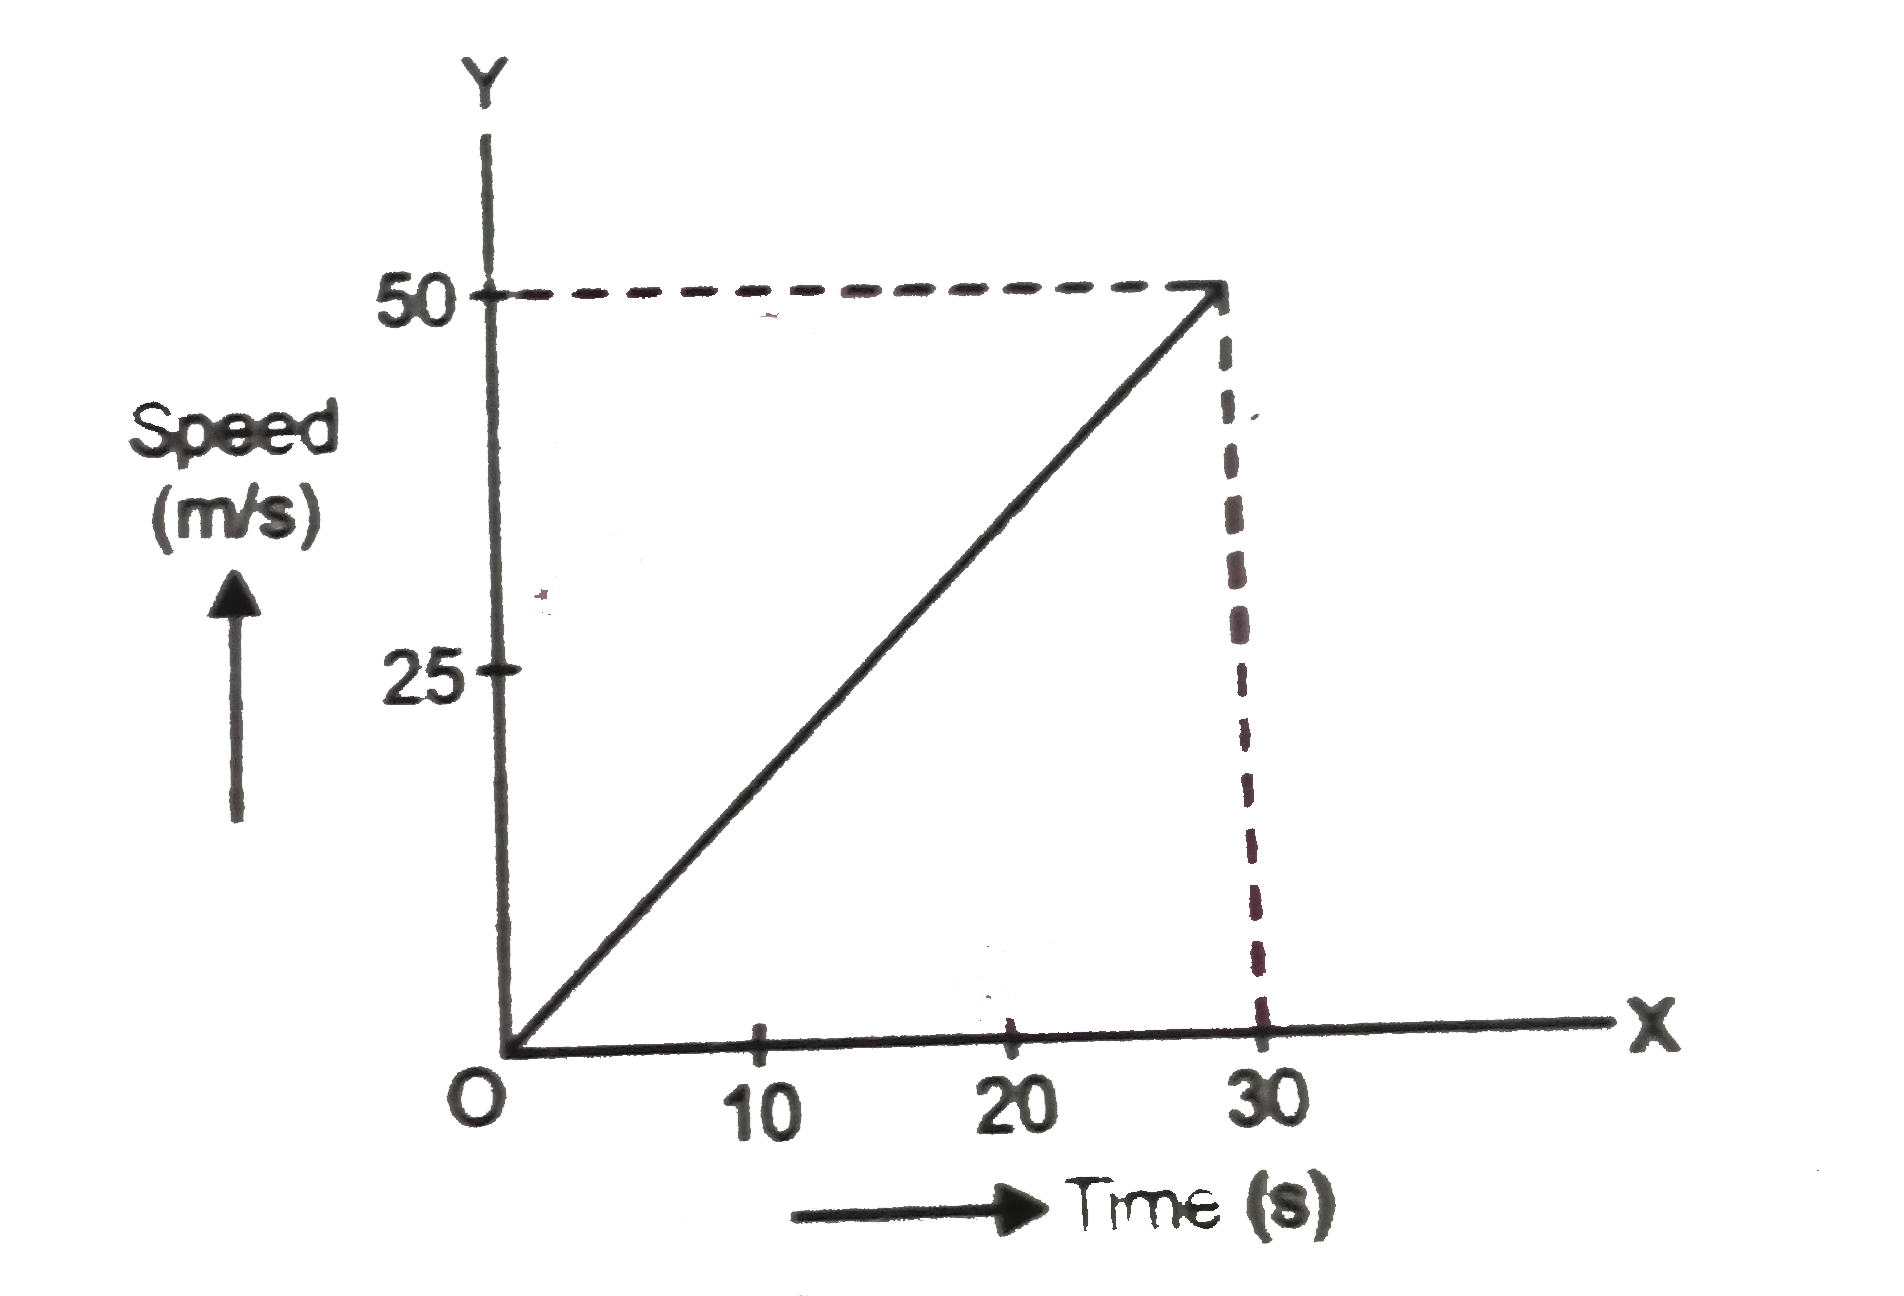
View SolutionWhat can you calculate from speed-time graph of a body ?
View SolutionIn the given table Column I shows the different values of masses of the body. Column II shows the different values of angular speed of the body and Column III shows the radius of circle in which the body moves.
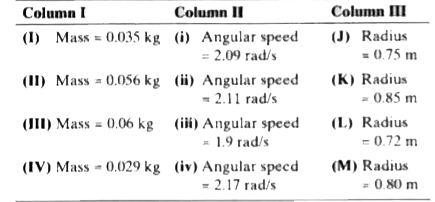
Which combination has 0.13N as the centrepetal force?
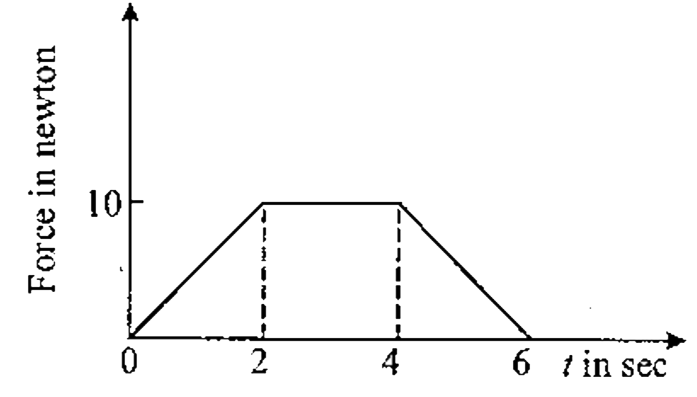
View SolutionThe following figure-1.116 shows the time and applied force graph for a body. What will be the momentum gained by the body in 6 seconds :
View Solution
