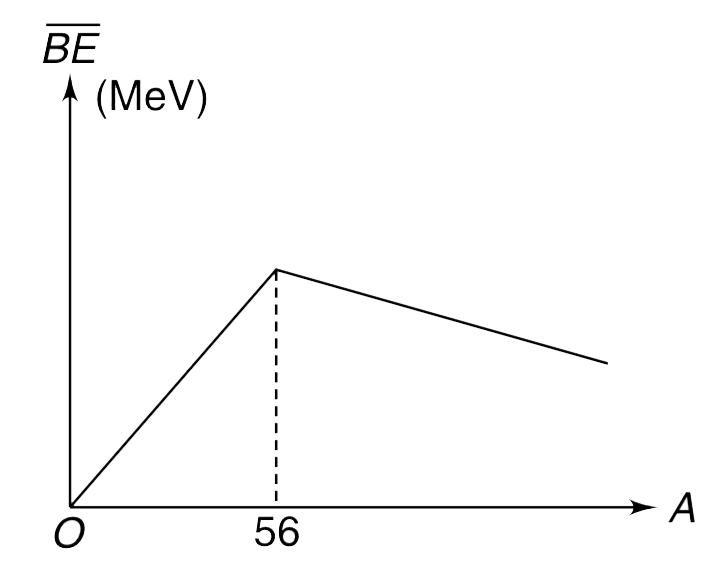
The graph of binding energy per nucleon versus mass number (A) for various nuclei has been approximated as made up of two linear components as shown in figure. The slope of line for is 0.16 and slope of line for is -0.012. the binding energy of nucleus is 11 times the value predicted by the shown graph due to its very stable structure. Estimate the minimum mass number (A) of a nucleus for it to exhibit alpha decay.
The correct Answer is:216
Step by step video, text & image solution for The graph of binding energy per nucleon (overlineBE) versus mass number (A) for various nuclei has been approximated as made up of two linear components as shown in figure. The slope of line for 0ltAlt56 is 0.16 and slope of line for A56 is -0.012. the binding energy of ._(2)^(4)He nucleus is 11 times the value predicted by the shown graph due to its very stable structure. Estimate the minimum mass number (A) of a nucleus for it to exhibit alpha decay. by Physics experts to help you in doubts & scoring excellent marks in Class 12 exams.
Updated on:21/07/2023Topper's Solved these Questions
Similar Questions
Knowledge Check
The value of binding energy per nucleon is
Amore for light nucleiBmore for heavy nucleiCmore for medium nucleiDequal for all nucleiThe highest binding energy per nucleon will be for
AFeBH2CO2DUThe graph between the binding energy per nucleon (E) and atomic mass number (A) is as-
A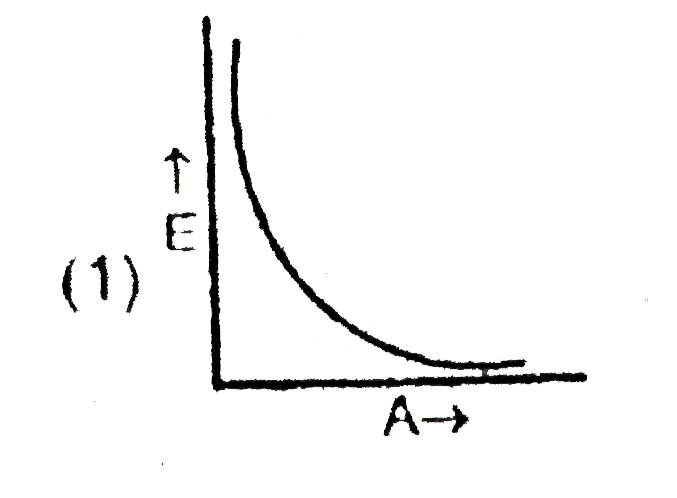 B
B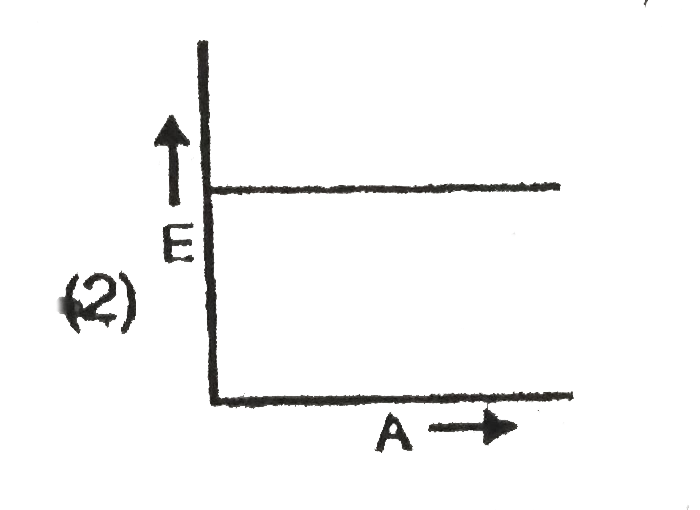 C
C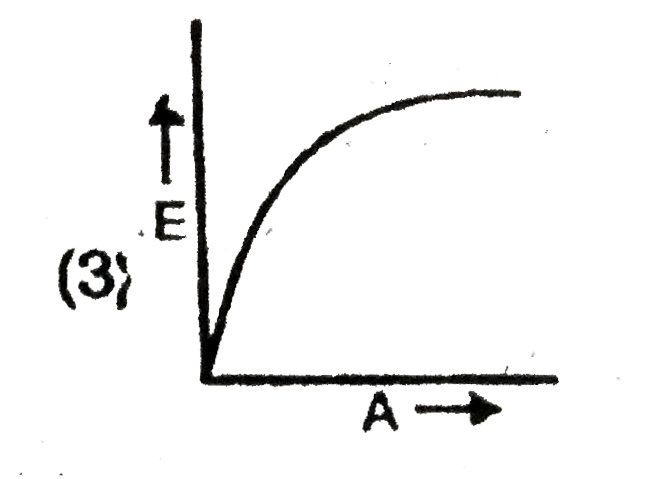 D
D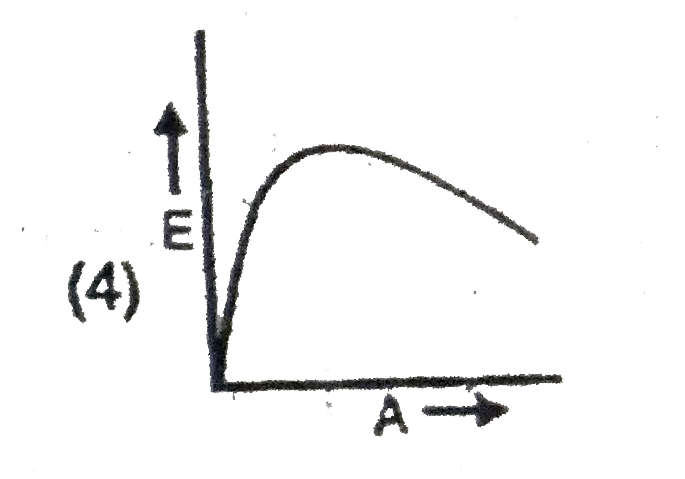
Binding energy per nucleon relation with mass number
View SolutionThe binding energy per nucleon of nucleus is a measure of its.
View SolutionThe average binding energy per nucleon is maximum for the nucleus
View SolutionMaximum value of binding energy per nucleon for most stable nuclei is
View SolutionThe value of binding energy per nucleon is maximum for the elements having the mass number
View Solution
