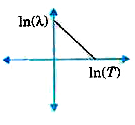
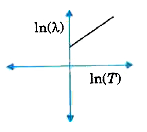
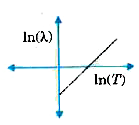
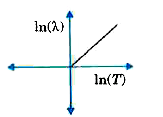
The graph showing the relation between de Broglie wavelength λ of particle and its temperature T is


The correct Answer is:A
To solve the problem of finding the relationship between the de Broglie wavelength (λ) of a particle and its temperature (T), we will follow these steps:
1. Understand de Broglie Wavelength:
The de Broglie wavelength (λ) of a particle is given by the formula:
λ=hp
where h is Planck's constant and p is the momentum of the particle.
2. Relate Momentum to Kinetic Energy:
The momentum p can be expressed in terms of kinetic energy (KE):
KE=p22m⟹p=√2m⋅KE
3. Substitute Kinetic Energy:
From the kinetic theory of gases, the average kinetic energy of a particle is given by:
KE=32kT
where k is the Boltzmann constant and T is the absolute temperature. Substituting this into the momentum equation gives:
p=√2m⋅32kT=√3mkT
4. Substitute Momentum Back into Wavelength:
Now substitute p back into the de Broglie wavelength equation:
λ=h√3mkT
5. Rearranging the Equation:
This can be rearranged to show that:
λ∝1√T
which implies:
λ=h√3mk⋅1√T
Here, h√3mk is a constant.
6. Taking Natural Logarithm:
Taking the natural logarithm of both sides gives:
ln(λ)=−12ln(T)+ln(h√3mk)
This can be rearranged to:
ln(λ)=−12ln(T)+C
where C=ln(h√3mk).
7. Identifying the Graph:
The equation ln(λ)=−12ln(T)+C represents a straight line with:
- Slope m=−12 (negative slope)
- Intercept C (positive value)
Therefore, when plotting ln(λ) against ln(T), we expect a straight line with a negative slope.
Conclusion:
The graph showing the relation between the de Broglie wavelength λ of a particle and its temperature T will be a straight line with a negative slope.
The de Broglie wavelength (λ) of a particle is given by the formula:
λ=hp
where h is Planck's constant and p is the momentum of the particle.
The momentum p can be expressed in terms of kinetic energy (KE):
KE=p22m⟹p=√2m⋅KE
From the kinetic theory of gases, the average kinetic energy of a particle is given by:
KE=32kT
where k is the Boltzmann constant and T is the absolute temperature. Substituting this into the momentum equation gives:
p=√2m⋅32kT=√3mkT
Now substitute p back into the de Broglie wavelength equation:
λ=h√3mkT
This can be rearranged to show that:
λ∝1√T
which implies:
λ=h√3mk⋅1√T
Here, h√3mk is a constant.
Taking the natural logarithm of both sides gives:
ln(λ)=−12ln(T)+ln(h√3mk)
This can be rearranged to:
ln(λ)=−12ln(T)+C
where C=ln(h√3mk).
The equation ln(λ)=−12ln(T)+C represents a straight line with:
- Slope m=−12 (negative slope)
- Intercept C (positive value)
The graph showing the relation between the de Broglie wavelength λ of a particle and its temperature T will be a straight line with a negative slope.
Topper's Solved these Questions
- BOOK - MODERN PUBLICATIONCHAPTER - DUAL NATURE OF RADIATION AND MATTER EXERCISE - COMPETITION FILE (OBJECTIVE TYPE QUESTIONS ( B - Multiple Choice Questions) (AIPMT/NEET & Other State Boards for Medical Entrance))26videos
DUAL NATURE OF RADIATION AND MATTER
- BOOK - MODERN PUBLICATIONCHAPTER - DUAL NATURE OF RADIATION AND MATTER EXERCISE - COMPETITION FILE (OBJECTIVE TYPE QUESTIONS ( B - Multiple Choice Questions) (JEE (Main) & Other State Boards for Engineering entrance))18videos
DUAL NATURE OF RADIATION AND MATTER
- BOOK - MODERN PUBLICATIONCHAPTER - DUAL NATURE OF RADIATION AND MATTER EXERCISE - Revision Exercises (Numerical Problems)20videos
DUAL NATURE OF RADIATION AND MATTER
- BOOK - MODERN PUBLICATIONCHAPTER - CURRENT ELECTRICITYEXERCISE - Chapter Practice Test15videos
CURRENT ELECTRICITY
- BOOK - MODERN PUBLICATIONCHAPTER - ELECTRIC CHARGES AND FIELDS EXERCISE - Chapter Practice Test15videos
ELECTRIC CHARGES AND FIELDS
Similar Questions
Draw a graph showing the variation of de Broglie wavelength of a particle of charge q and mass m with accelerating potential. Proton and deuteron have the same de Broglie wavelengths. Explain which has more kinetic energy.
View SolutionWhat is the de-Broglie wavelength of a neutron at absolute temperature T K ?
View Solution
Knowledge Check
- Question 1 - Select One
The de-Broglie wavelength λ
Ais proportional to massBis proportional to impulseCInversely proportional to impulseDdoes not depend on impulse - Question 2 - Select One
The de Broglie wavelength λ of a particle
Ais proportional to massBis proportional to impluseCis inversely proportional to impulseDdoes not depend on impulse - Question 3 - Select One
The de Broglie wavelength λ of a particle
Ais proportional to massBis proportional to impluseCis inversely proportional to impulseDdoes not depend on impulse
(a) Draw a graph showing the variation of de-Broglie wavelength of a particle of charge 'q' and mass 'm' with accelerating potential 'V'.
(b) Proton and deuteron have the same de-Broglie wavelength. Explain which has more kinetic enegy.View SolutionPlot a graph showing variation of a de Broglie wavelength (λ) associated with a charged particle of mass m, verses 1/√V, where V is the potential difference thrugh which the particle is accelerated. How does this graph give us the information the magnitude the magnitude of the charge of the particle ?
View SolutionThe de Broglie wavelength associated with particle is
View SolutionThe de Broglie wavelength (λ) of a particle is related to its kinetic energy E as
View SolutionThe de Broglie wavelength relates to applied voltage as:
View Solution

