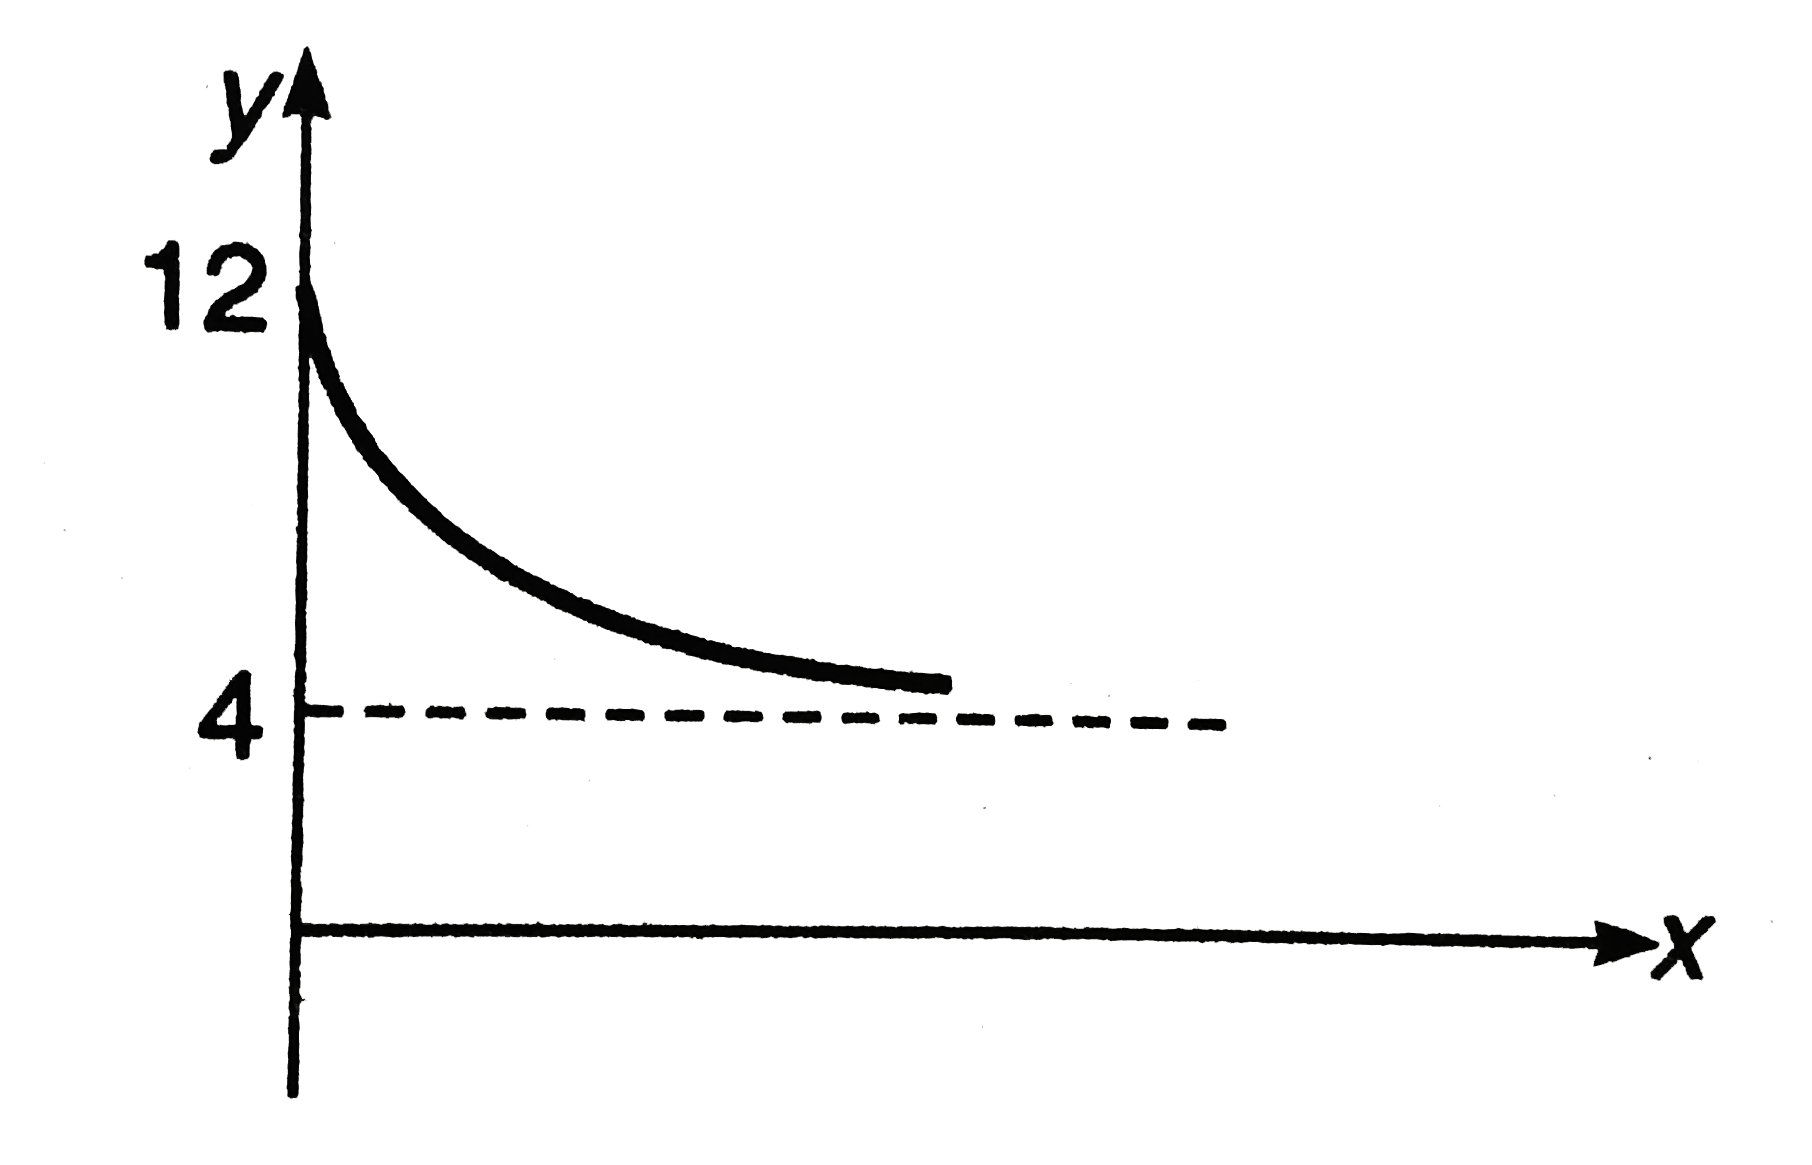
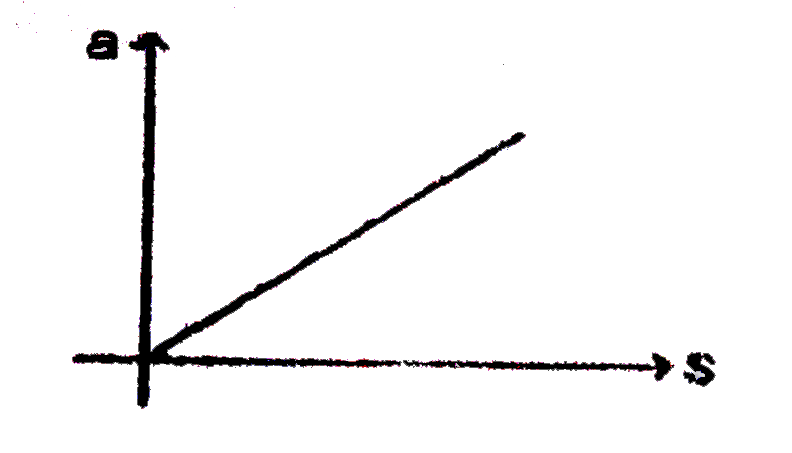
The graph shown in figure is exponential. Write down the equation corresponding to the graph.
The correct Answer is:A, C, D
Step by step video & image solution for The graph shown in figure is exponential. Write down the equation corresponding to the graph. by Physics experts to help you in doubts & scoring excellent marks in Class 11 exams.
Updated on:21/07/2023Topper's Solved these Questions
Similar Questions
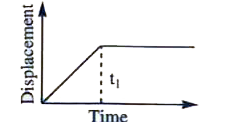
The x-t graph shown in figure represents

View SolutionThe x-t graph shown in figure represents.
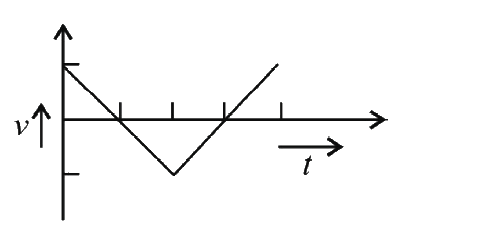
View SolutionThe graph in figure shows the velocity v versus time t for a body. Which of the graphs shown in figure represents the correesponding acceleration versus time graphs ?
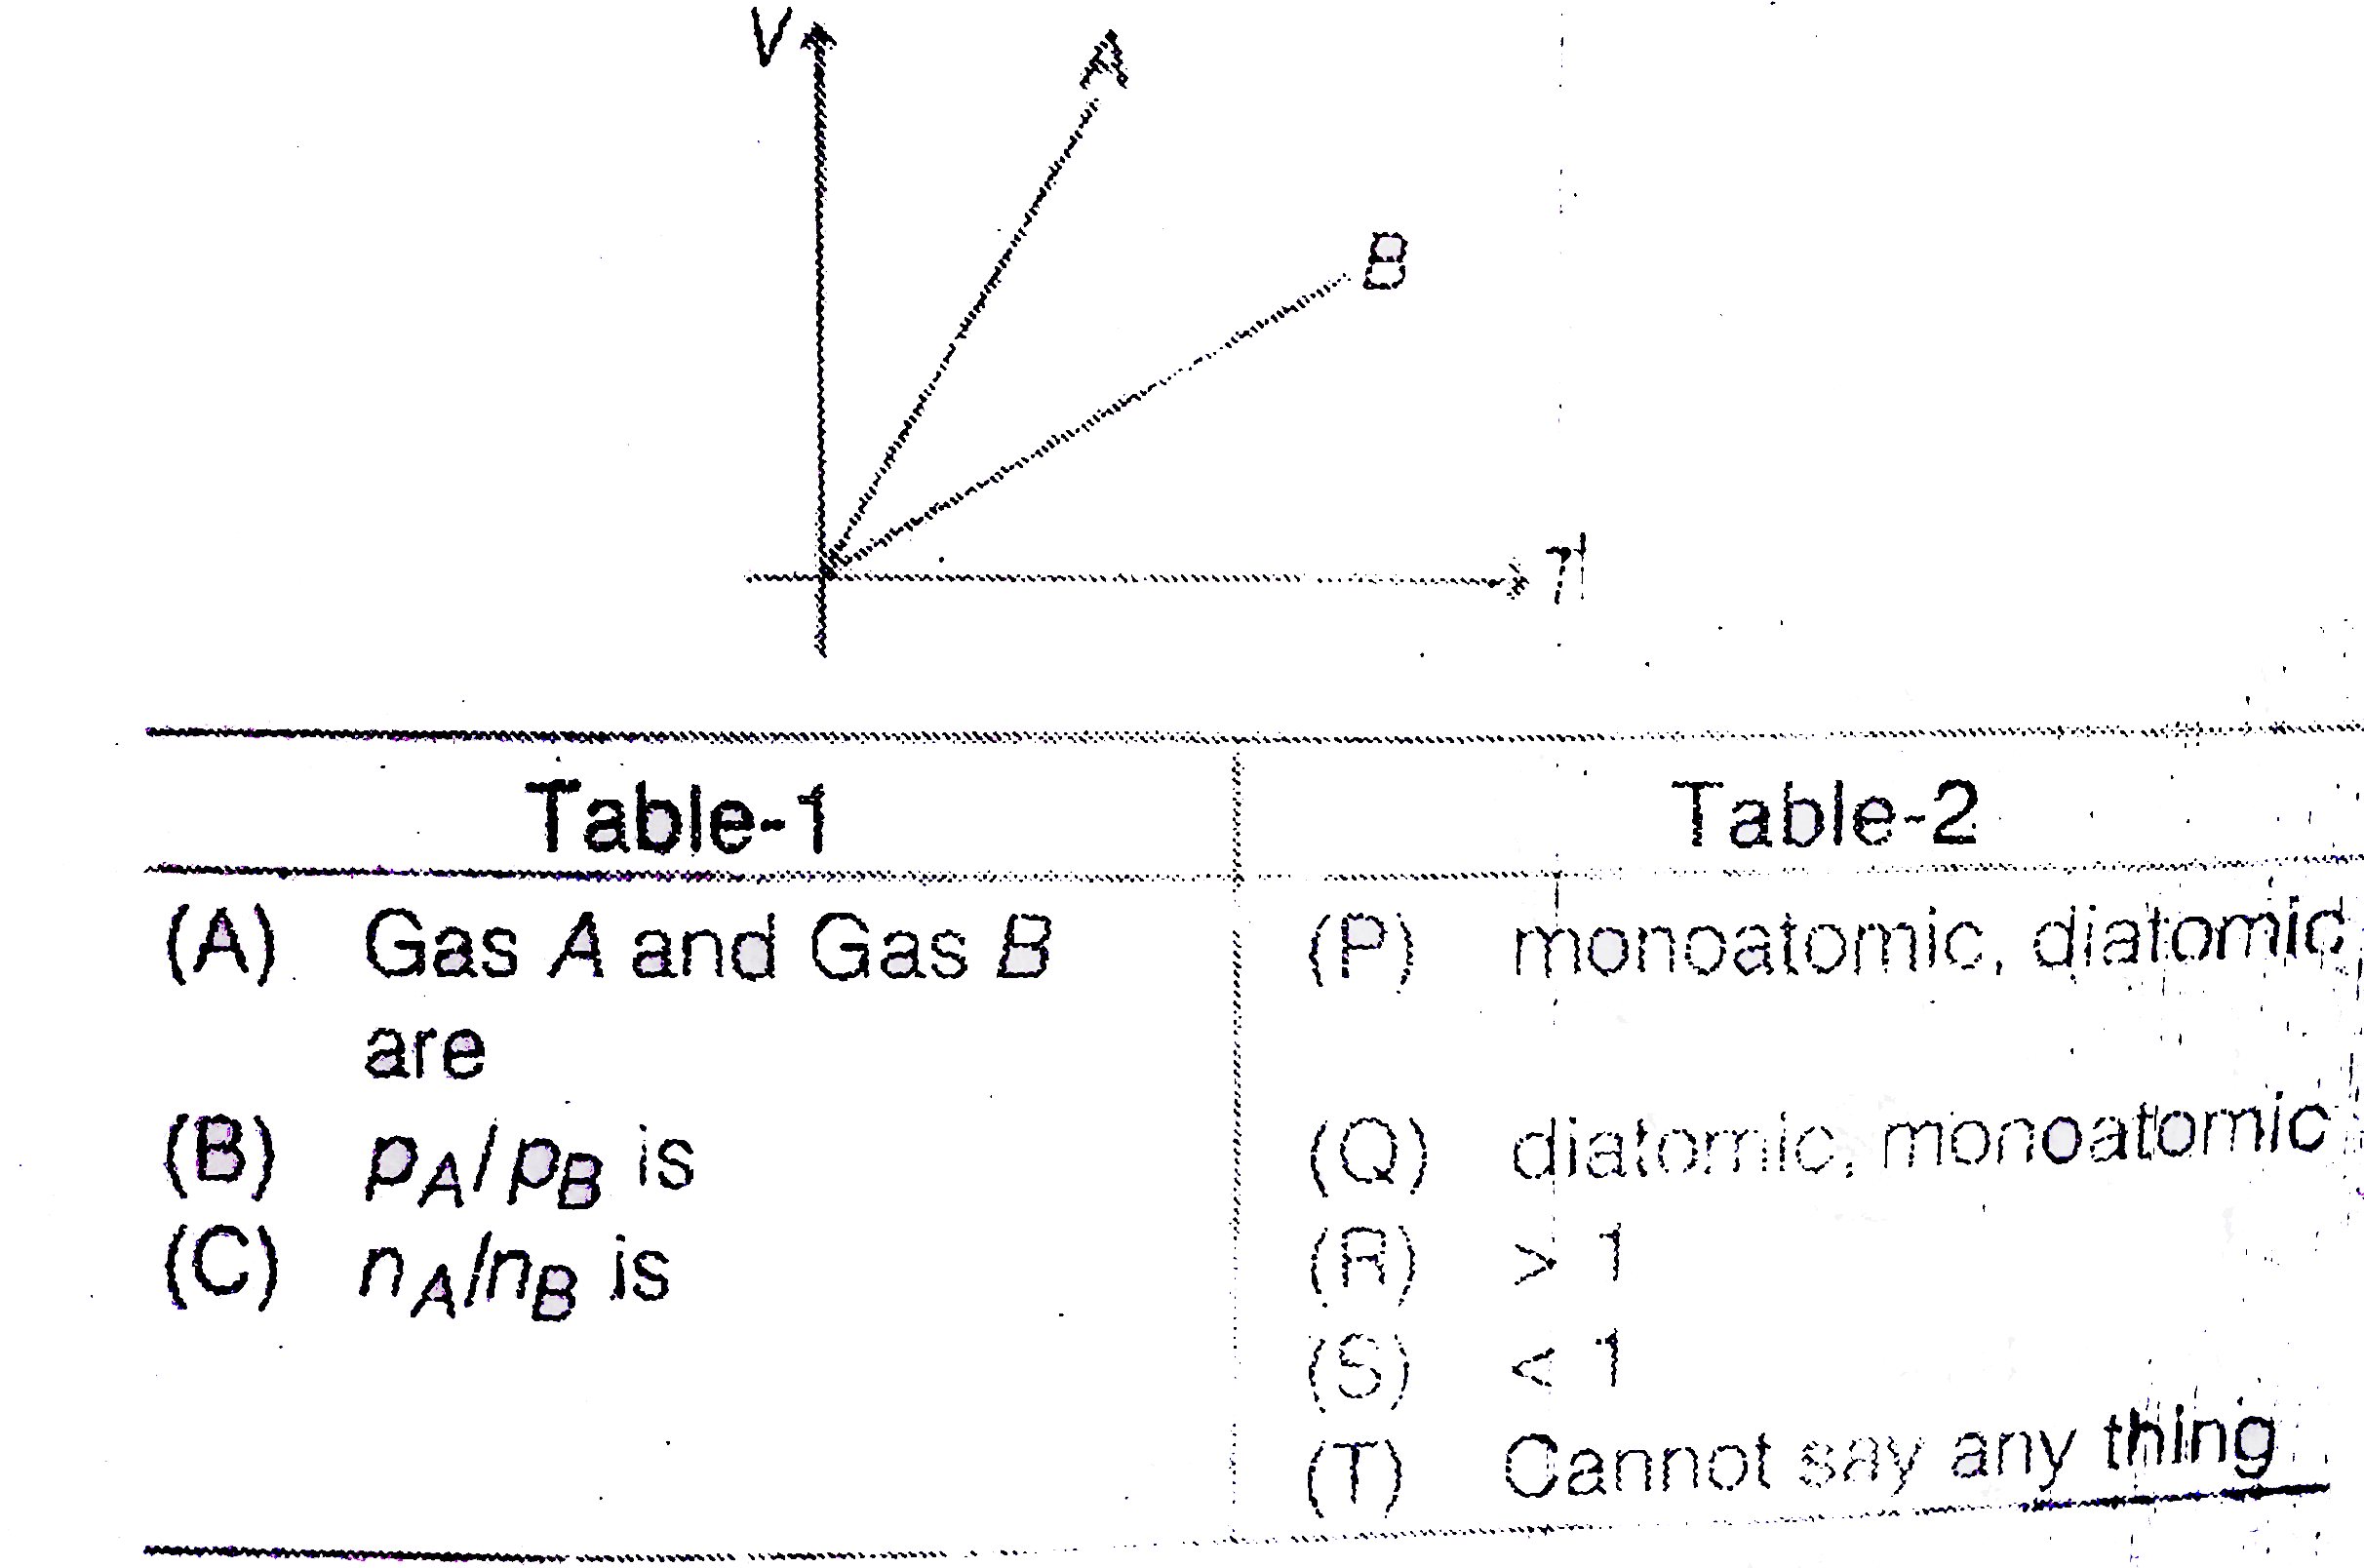
View SolutionIn the V-T graph shown in figure match the following.
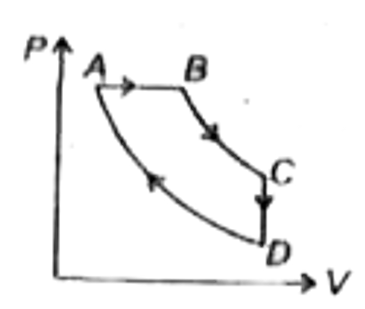
View SolutionFor P-V diagram of a thermodynamic cycle as shown in figure,process BC and DA are isothermal. Which of the corresponding graphs is correct?
View SolutionFor the graphs given below, write down their x−y equations

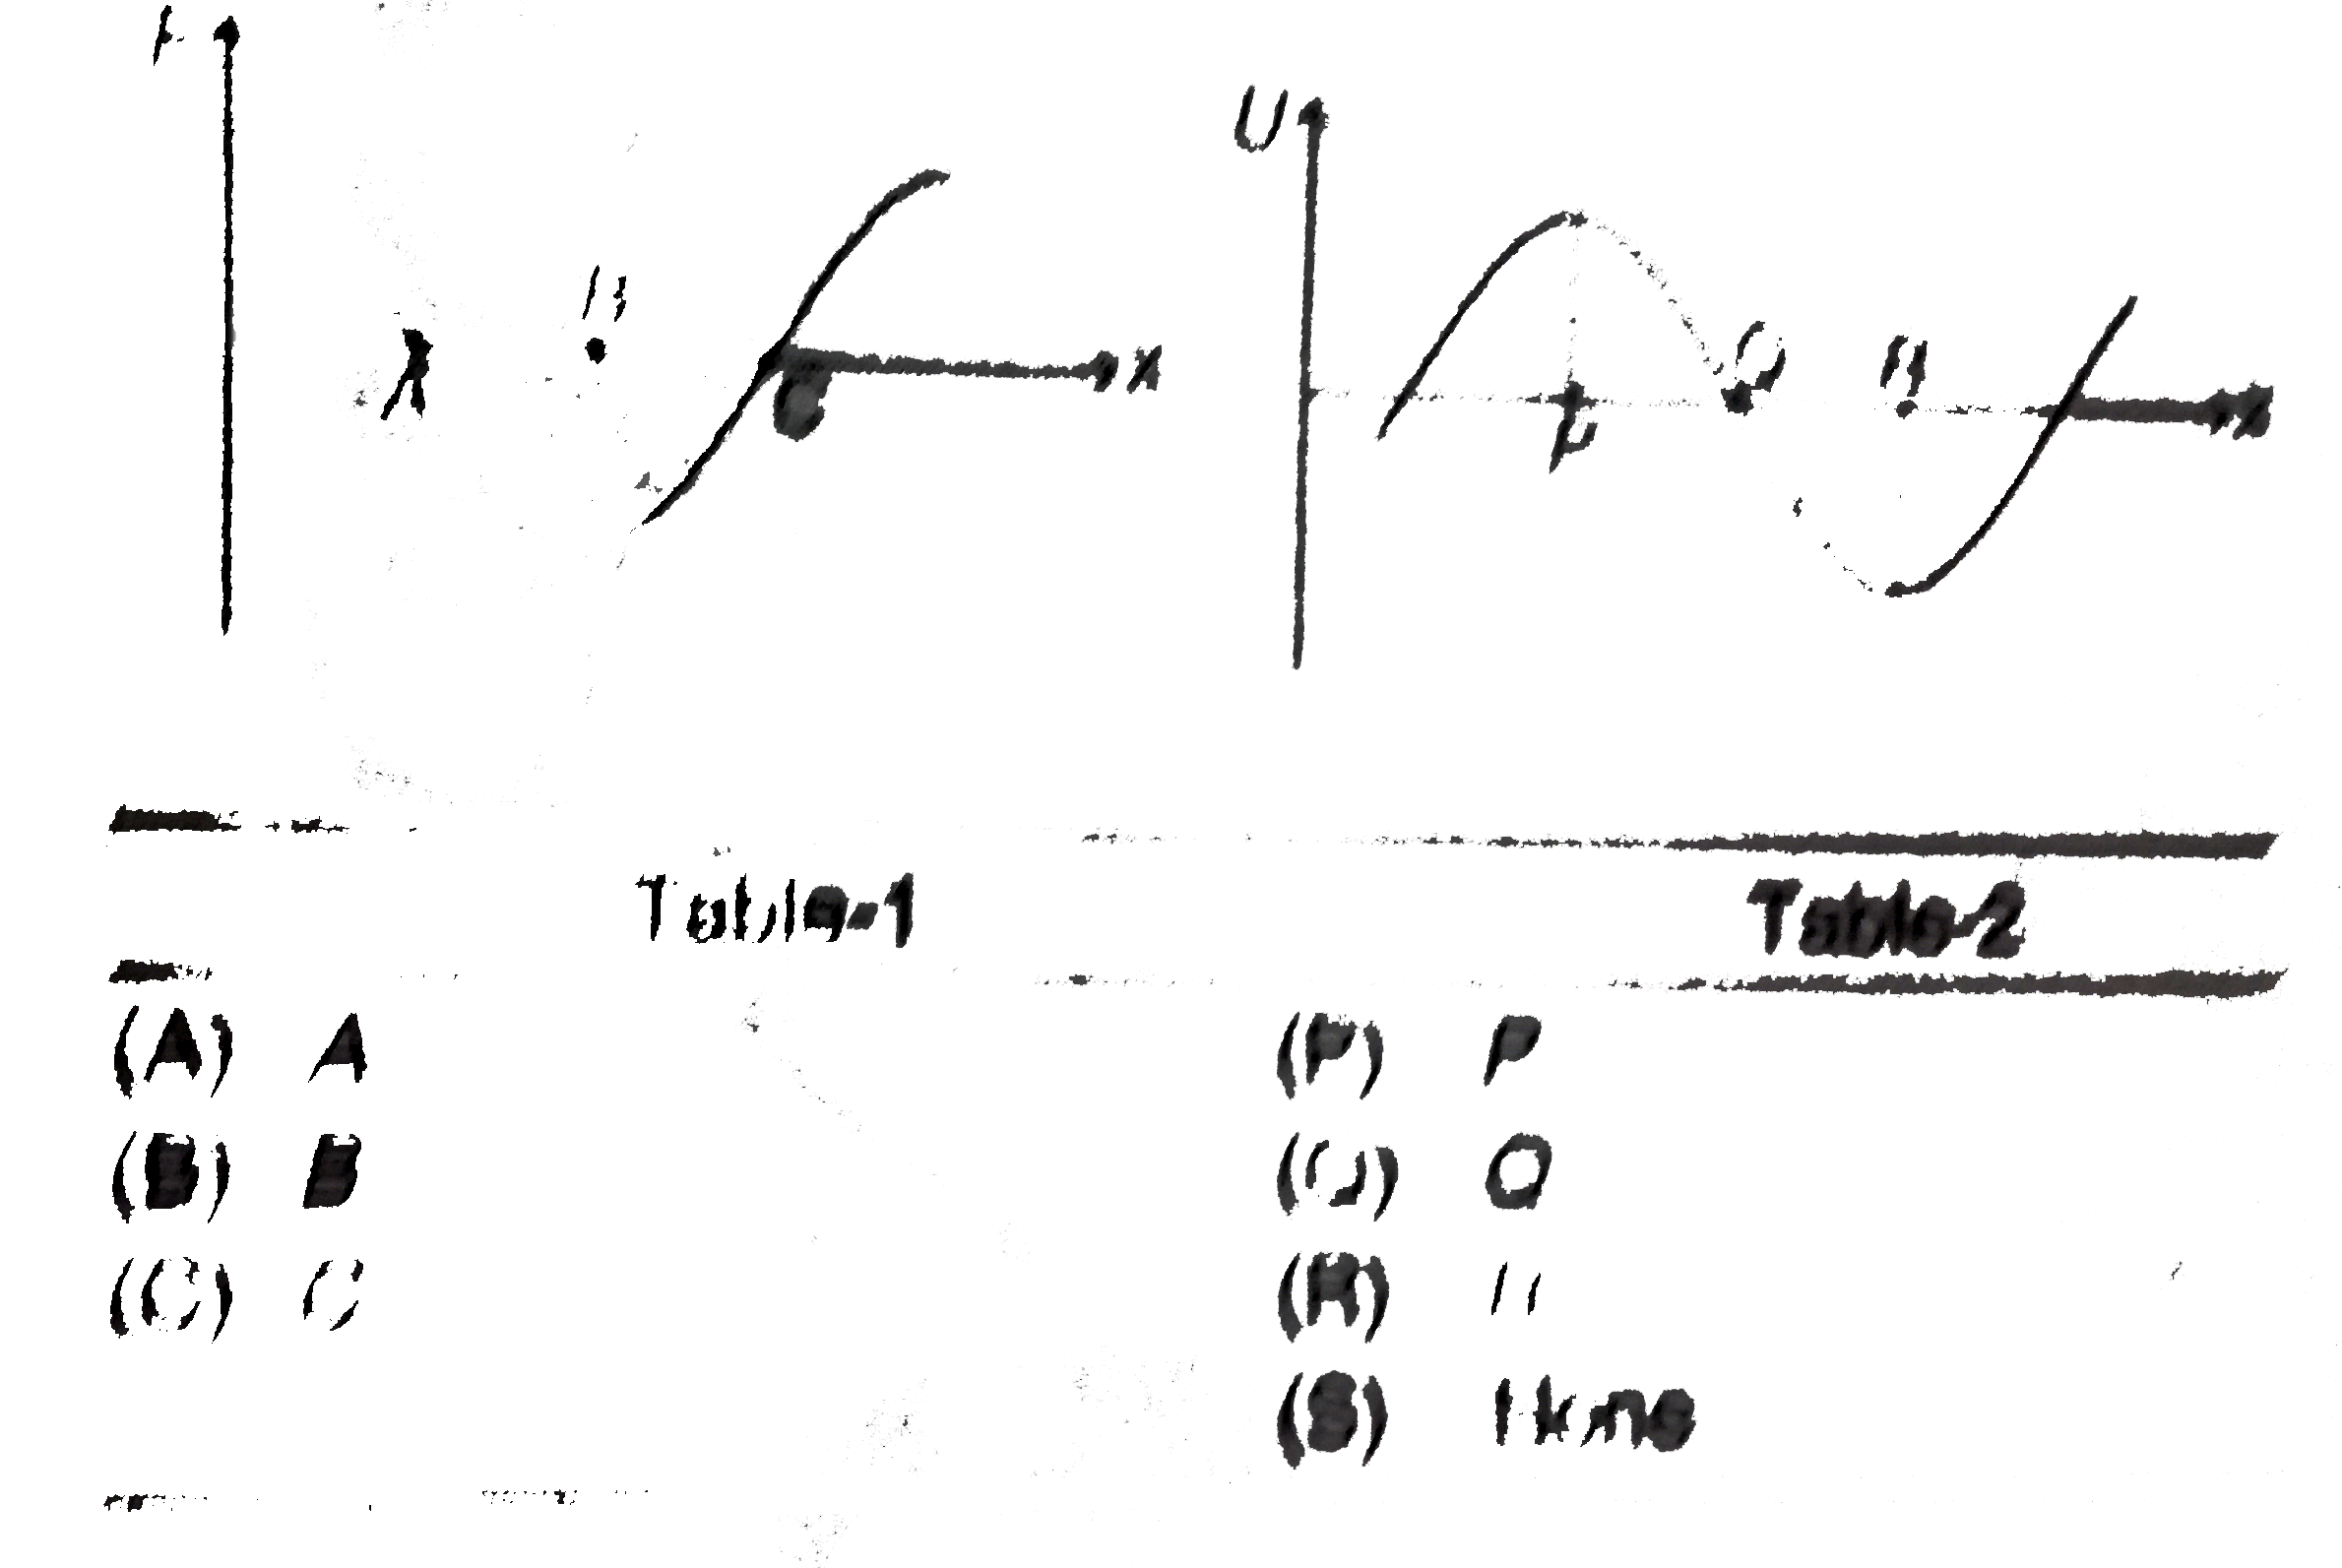
View SolutionF-x and corresponding U-x graphs are as shown in figure. Three point A, B and C in F-x graph may be corresponding to P, Q and R in the U-x graph. Match the following
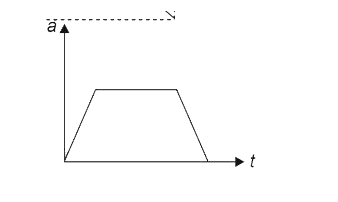
View SolutionAcceleration versus time graph of a particle moving in a straight line is as shown in adjoining figure. If initially particle was at rest. Then corresponding kinetic energy versus time graph will be :
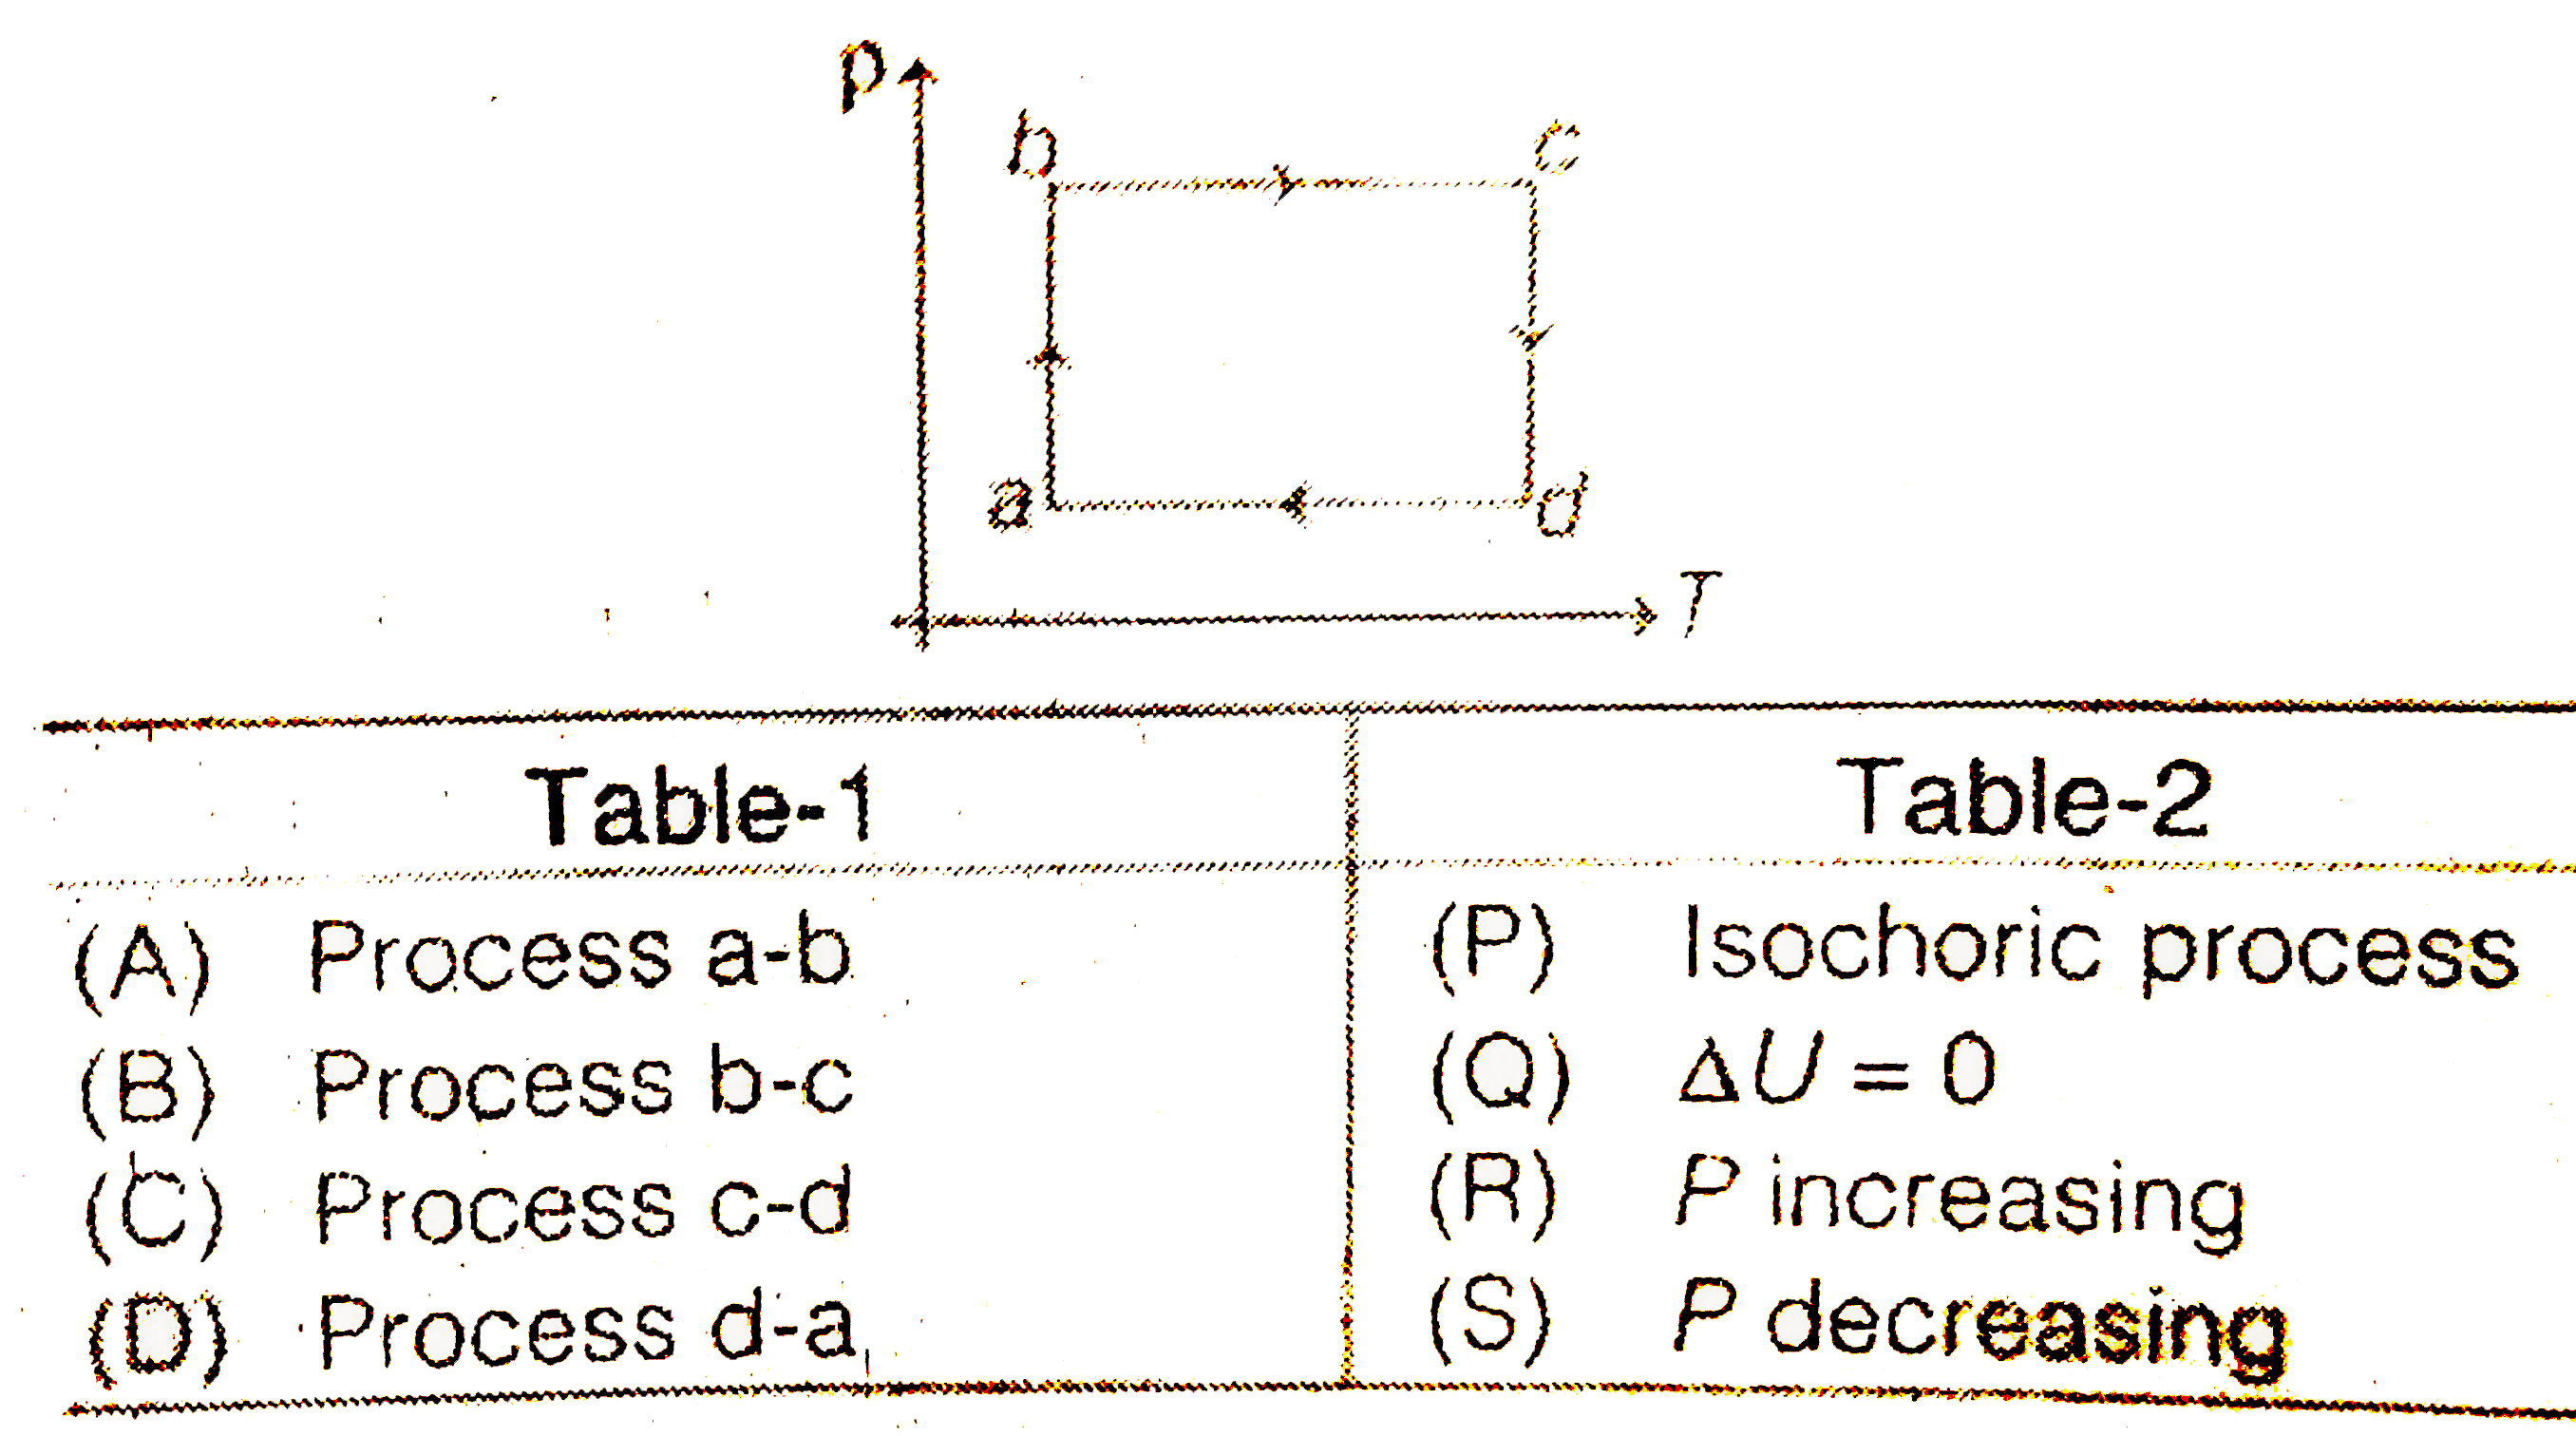
View SolutionIn the ρ-T graph shown in figure, match the following.
View SolutionAcceleration (a) -displacement (s) graph of a particle moving in a straight line is as shown in the figure. The initial velocity of the particle is zero. The v−s graph of the particle would be
View Solution
