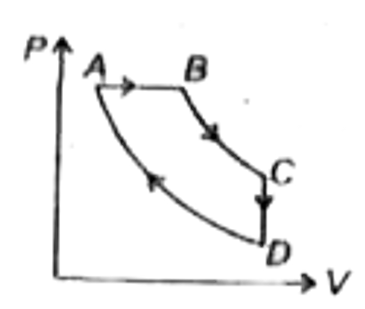
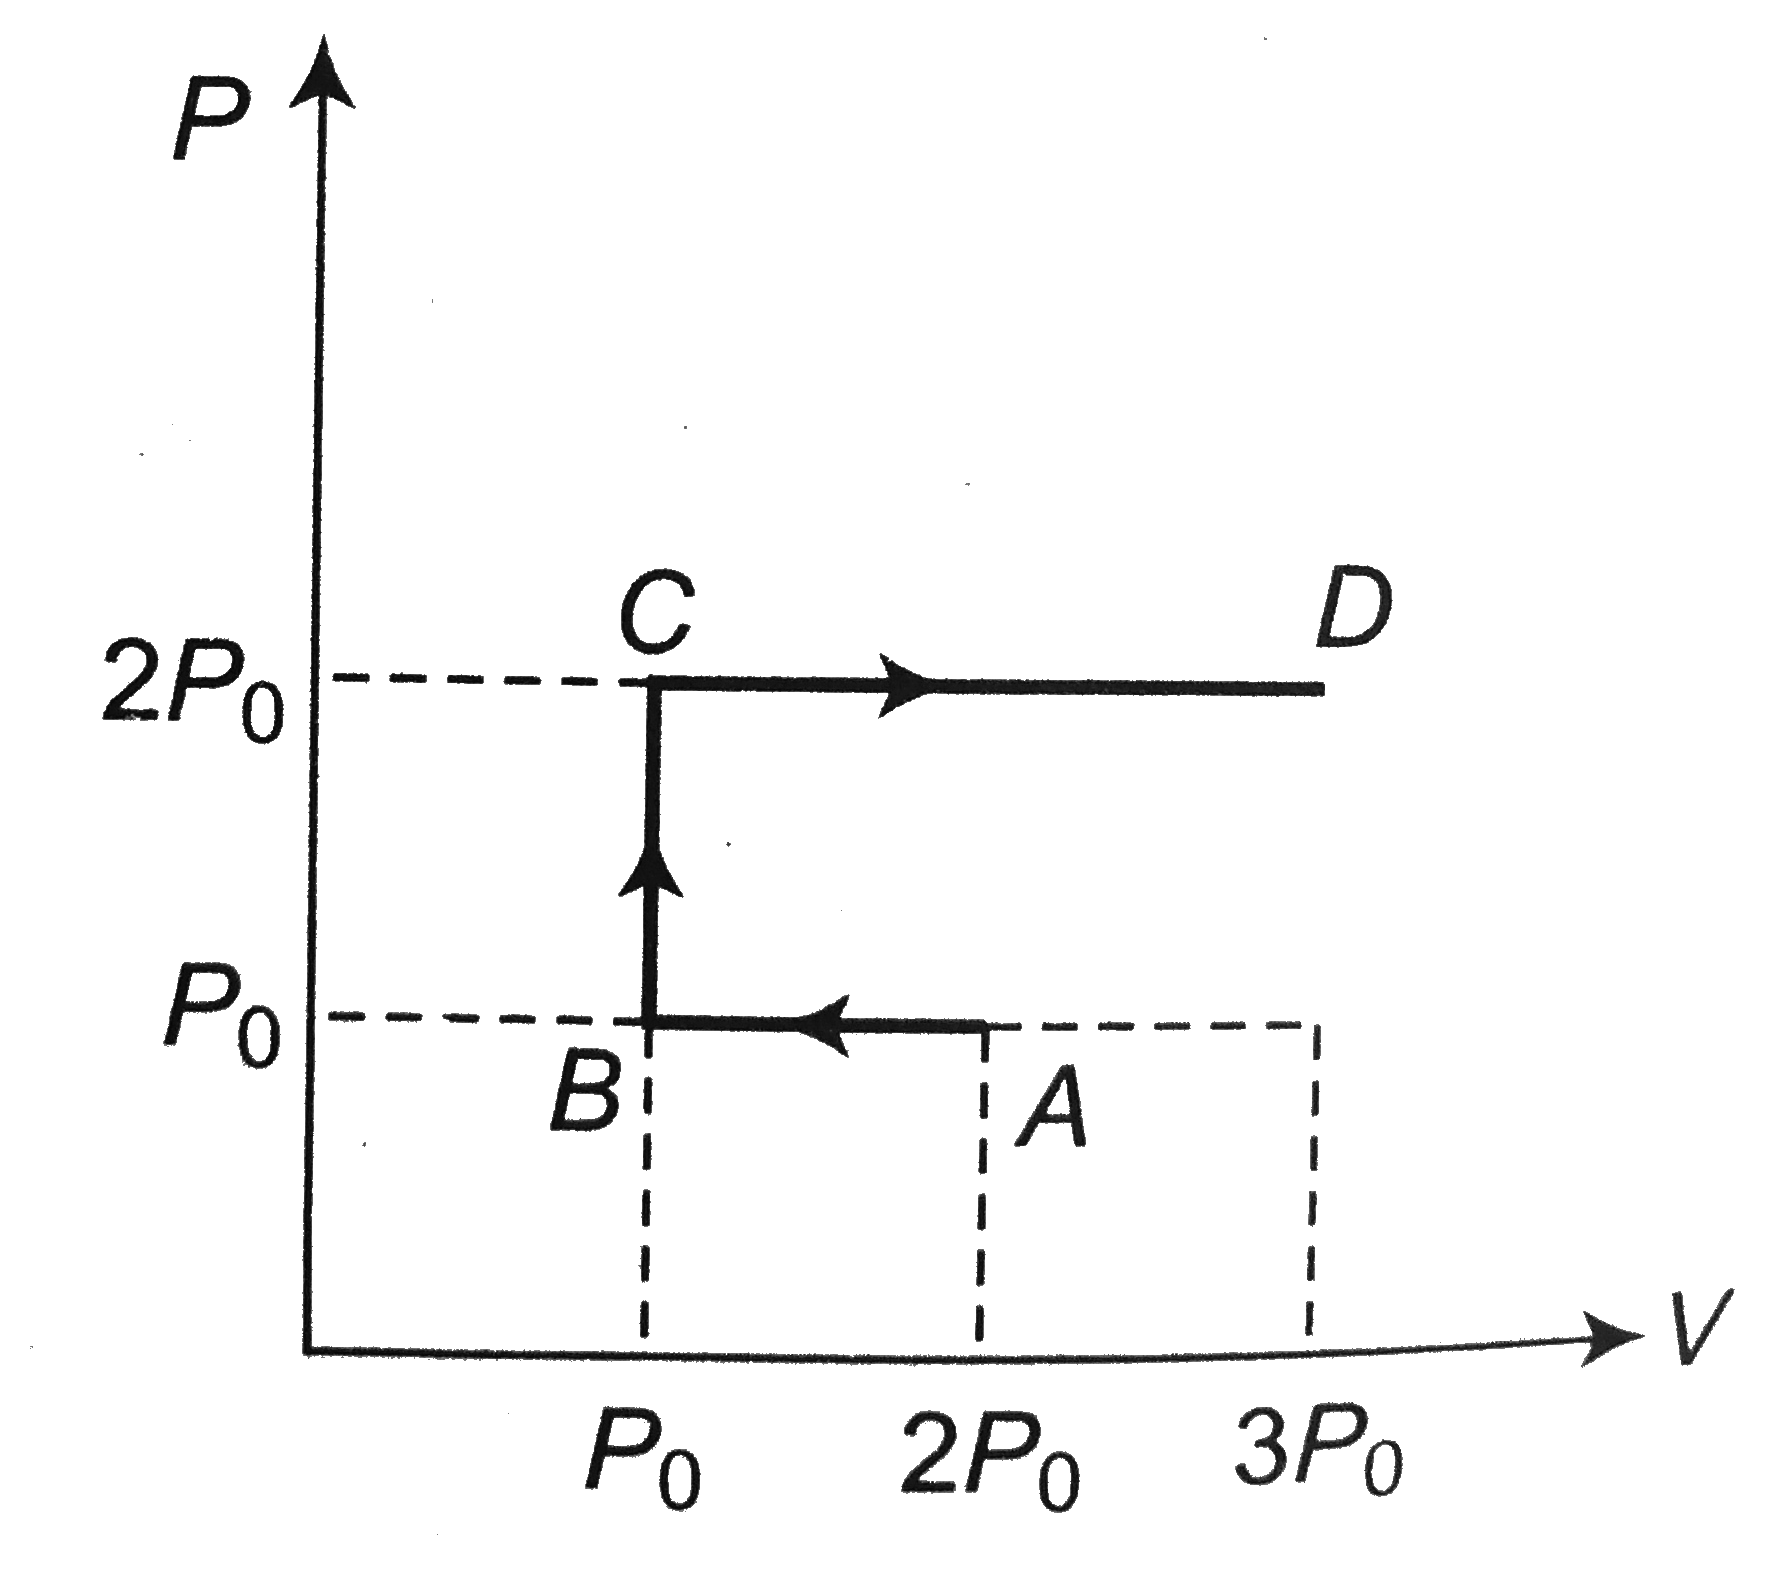
For P-V diagram of a thermodynamic cycle as shown in figure,process BC and DA are isothermal. Which of the corresponding graphs is correct?
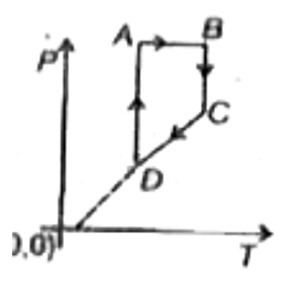
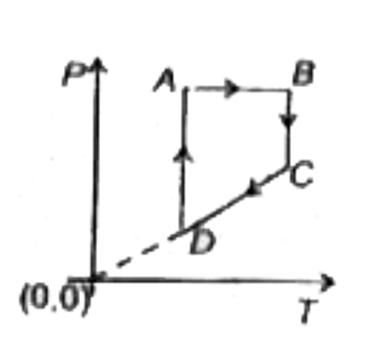
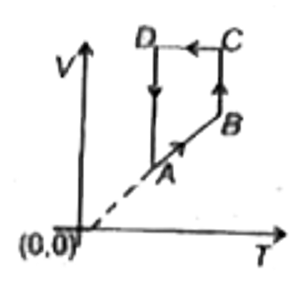
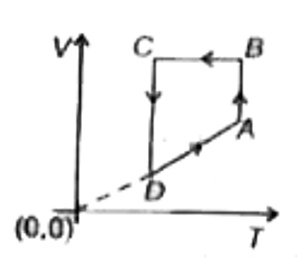
The correct Answer is:B
Step by step video & image solution for For P-V diagram of a thermodynamic cycle as shown in figure,process BC and DA are isothermal. Which of the corresponding graphs is correct? by Physics experts to help you in doubts & scoring excellent marks in Class 12 exams.
Updated on:21/07/2023Topper's Solved these Questions
- THERMODYNAMICSBOOK - AAKASH INSTITUTE ENGLISHCHAPTER - THERMODYNAMICSEXERCISE - ASSIGNMENT (SECTION -B) (Objective Type Questions)
30 Videos
- THERMODYNAMICSBOOK - AAKASH INSTITUTE ENGLISHCHAPTER - THERMODYNAMICSEXERCISE - ASSIGNMENT (SECTION -C) (Previous Year Questions)
63 Videos
- THERMODYNAMICSBOOK - AAKASH INSTITUTE ENGLISHCHAPTER - THERMODYNAMICSEXERCISE - EXERCISE
20 Videos
- THERMAL PROPERTIES OF MATTERBOOK - AAKASH INSTITUTE ENGLISHCHAPTER - THERMAL PROPERTIES OF MATTEREXERCISE - Assignment (Section-J) Akash Challengers Questions
7 Videos
- UNITS AND MEASUREMENTSBOOK - AAKASH INSTITUTE ENGLISHCHAPTER - UNITS AND MEASUREMENTSEXERCISE - ASSIGNMENT (SECTION - D)
15 Videos
Similar Questions
During the thermodynamic process shown in figure for an ideal gas
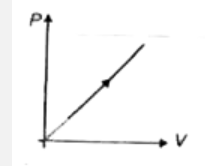
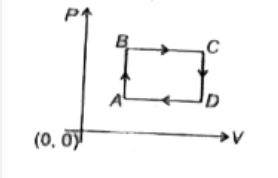
View SolutionThe figure shows P-V diagram of a thermodynamic cycle. Which corresponding curve is correct ?
View SolutionThe PT diagram for an ideal gas is shown in the figure, where AC is an adiabatic process, find the corresponding PV diagram.
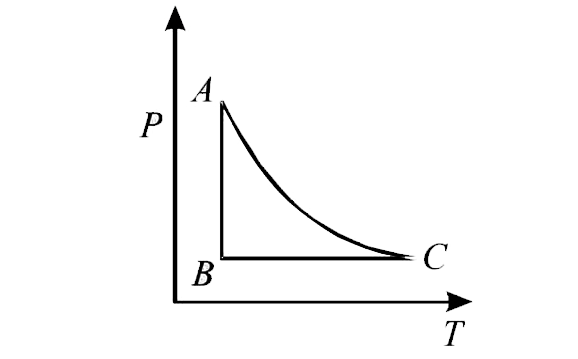
View SolutionThe PT diagram for an ideal gas is shown in the figure, where AC is an adiabatic process, find the corresponding PV diagram.

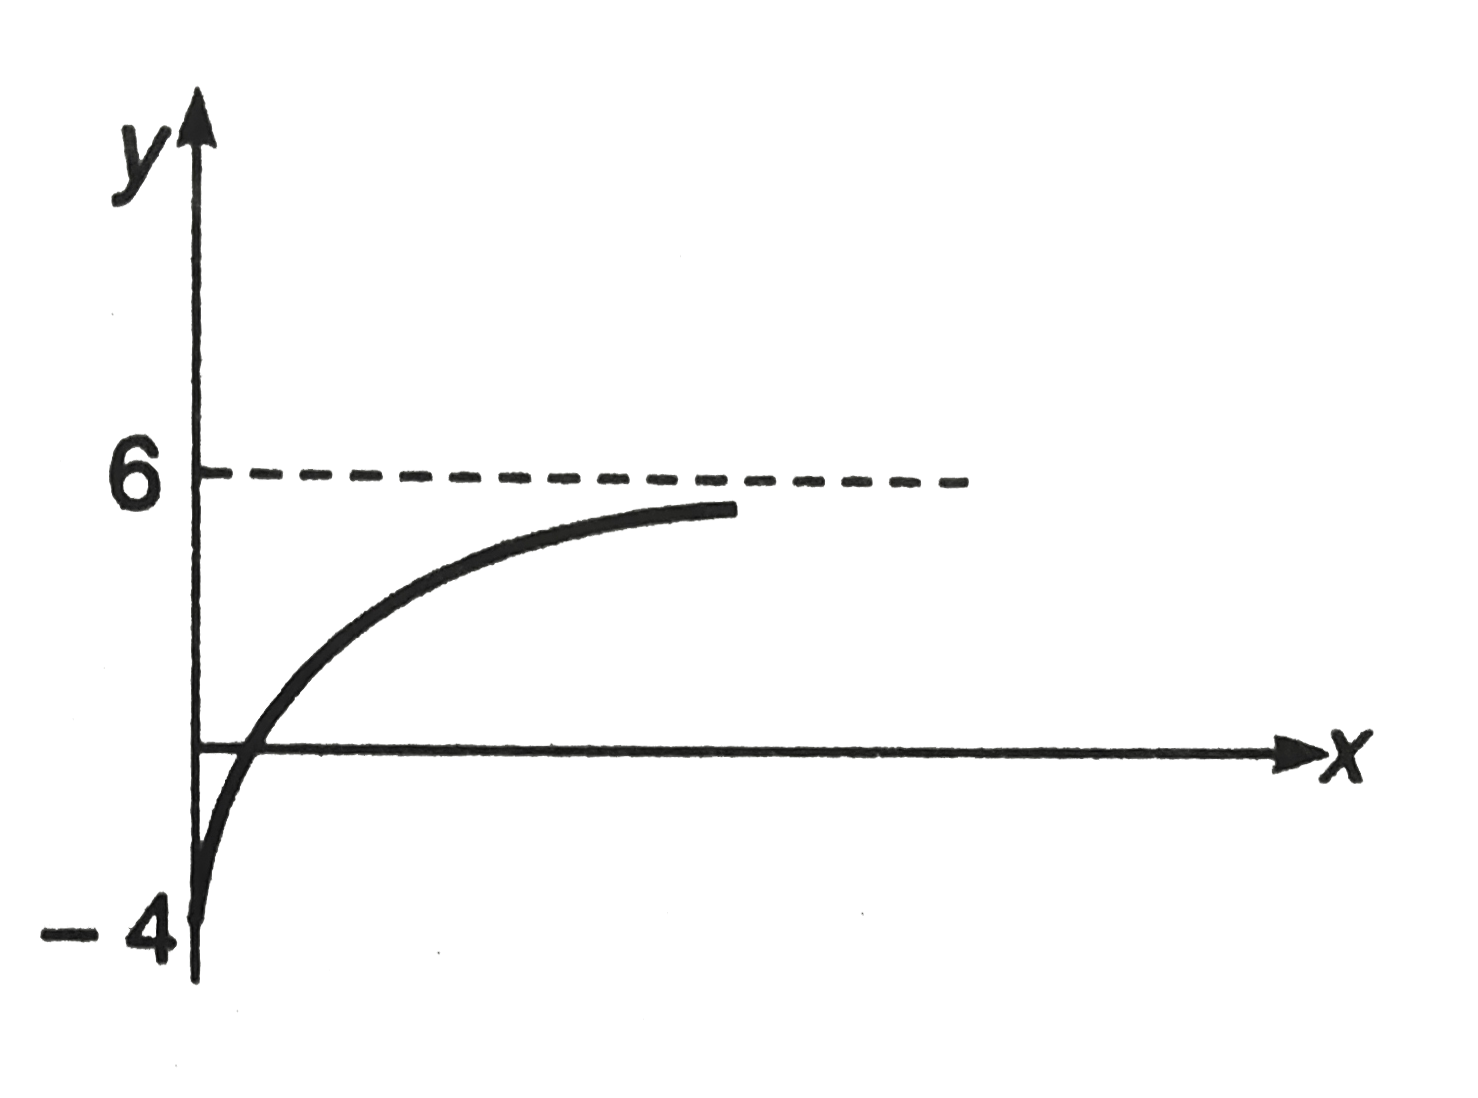
View SolutionThe graph shown in figure is exponential. Write down the equation corresponding to the graph.
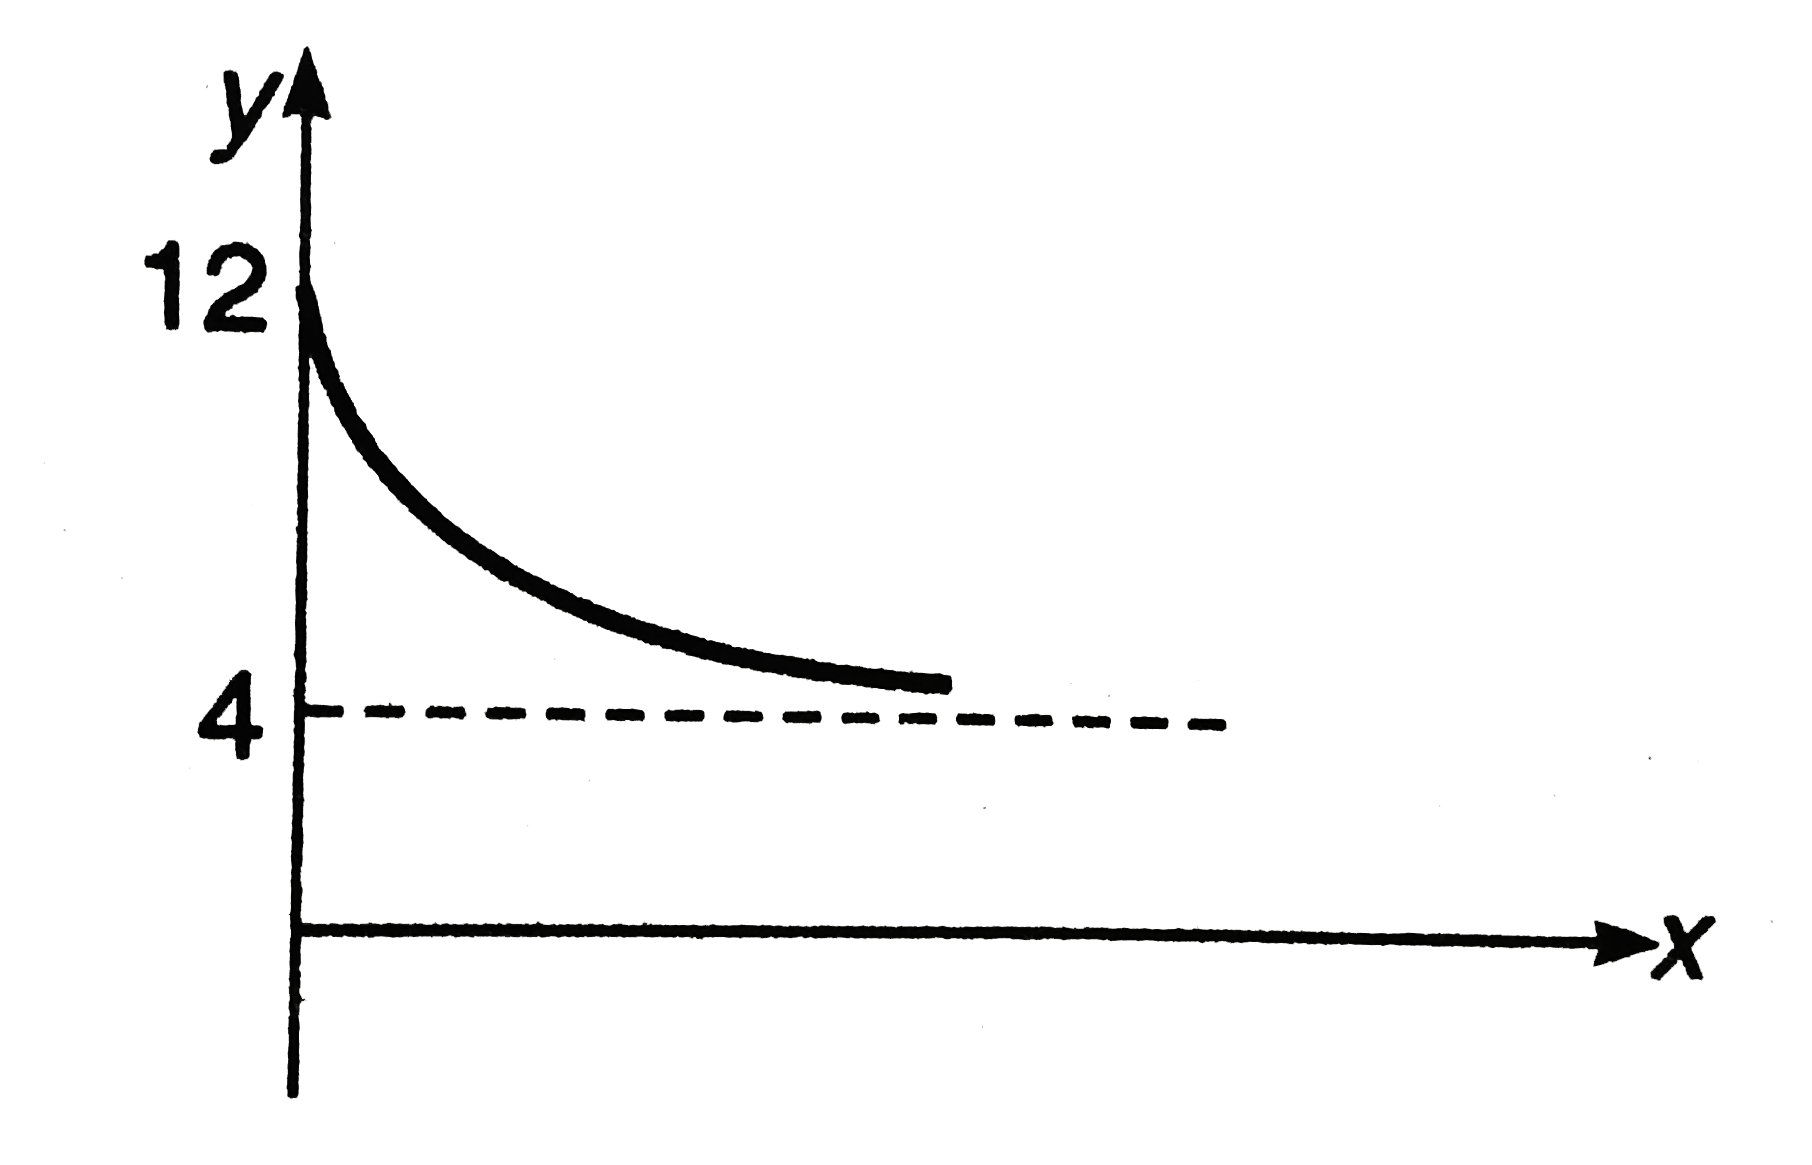
View SolutionThe graph shown in figure is exponential. Write down the equation corresponding to the graph.
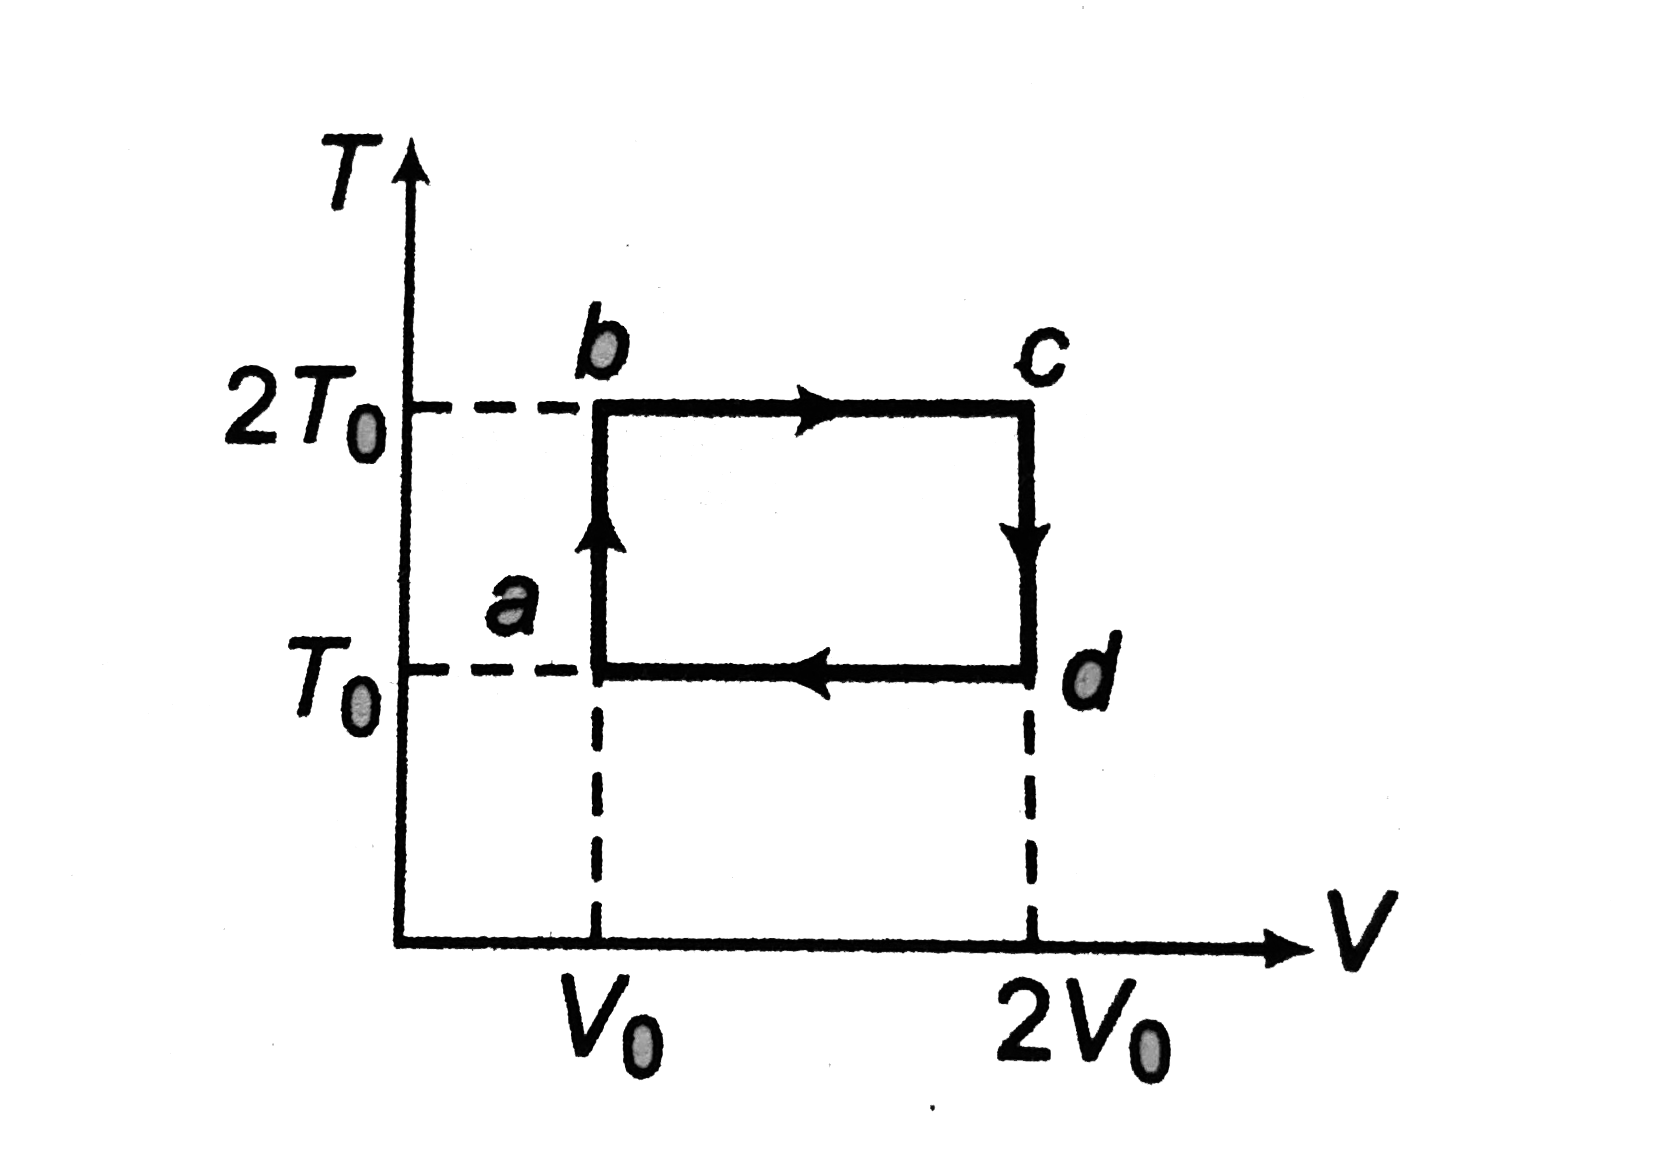
View SolutionT-V diagram of two moles of a monoatomic gas is as shown in figure.
For the process abcda choose the correct options given below
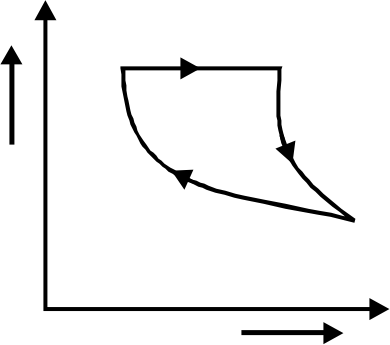
View SolutionFor a given thermodynamic cyclic process, P−V indicator diagram is as shown in the figure. Process AB,BC&CA are isobaric, & isothermal respectively. Then which of the following curve represent correc V−T indicator diagram for the process ABCA?
View SolutionP−V diagram of an ideal gas is as shown in figure. Work done by the gas in process ABCD is
View SolutionA cyclie process ABCA is shwon in a V−T diagram. The corresponding P−V diagram is

View Solution
