The graph shows the variation in magnetic flux ϕ(t) with time through a coil. Which of the statements given below in not correct?
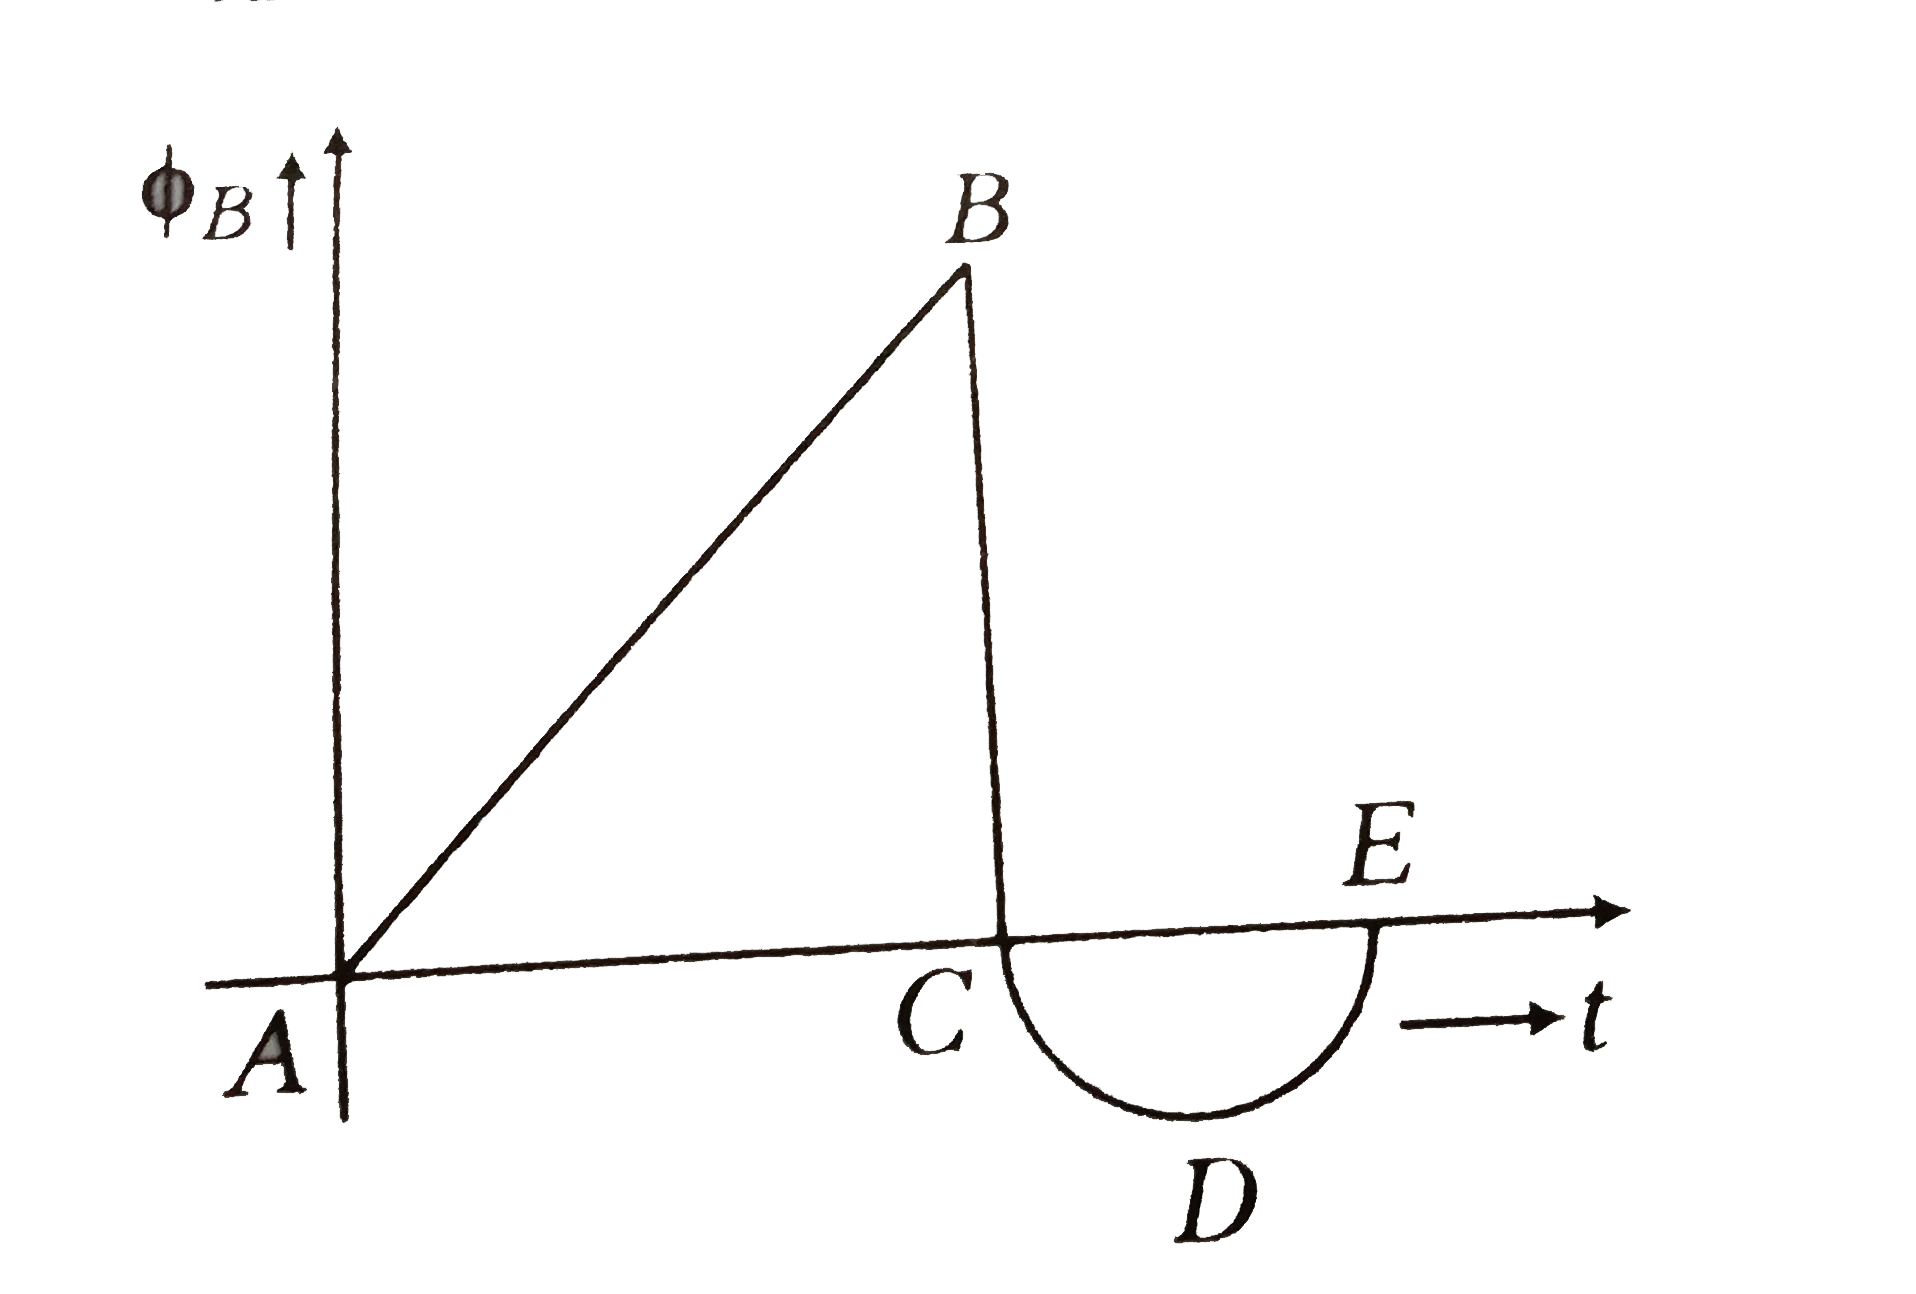
The magnitude of the induced e.m.f. is maximum between B and C
There is change in the direction as well as magnitude of induced e.m.f. between A and C
The induced e.m.f. is not zero at B
There is a change in the direction as well as magnitude of the induced e.m.f. between B and D

The correct Answer is:C
At point B, the flux ϕ is maximum ∴dϕ=0
∴E=∣∣∣dϕdt∣∣∣=0
∴ The induced e.m.f. at B is zero.
(c) is the wrong statement.
Topper's Solved these Questions
- ELECTROMAGNETIC INDUCTION AND ALTERNATING CURRENTS BOOK - MARVEL PUBLICATIONCHAPTER - ELECTROMAGNETIC INDUCTION AND ALTERNATING CURRENTS EXERCISE - TEST YOUR GRASP - 16
30 Videos
- ELASTICITYBOOK - MARVEL PUBLICATIONCHAPTER - ELASTICITYEXERCISE - Test Your Grasp - 5
15 Videos
- ELECTRONS AND PHOTONS BOOK - MARVEL PUBLICATIONCHAPTER - ELECTRONS AND PHOTONS EXERCISE - TEST YOUR GRASP - 17
15 Videos
Similar Questions
Knowledge Check
The graph shows the variation in magnetic flux ϕ(t) with time through a coil. Which of the statements given below is not correct?
 AThere is a change in the direction as well as magnitude of the induced emf between B and DBThe magnitude of the induced emf is maximum between B and CCThere is a change in the direction as well as magnitude of induced emf between A and CDThe induced emf is zero at B
The graph Shows the variation in magnetic flux ϕ(t) with time through a coil. Which of the statements given below is not correct
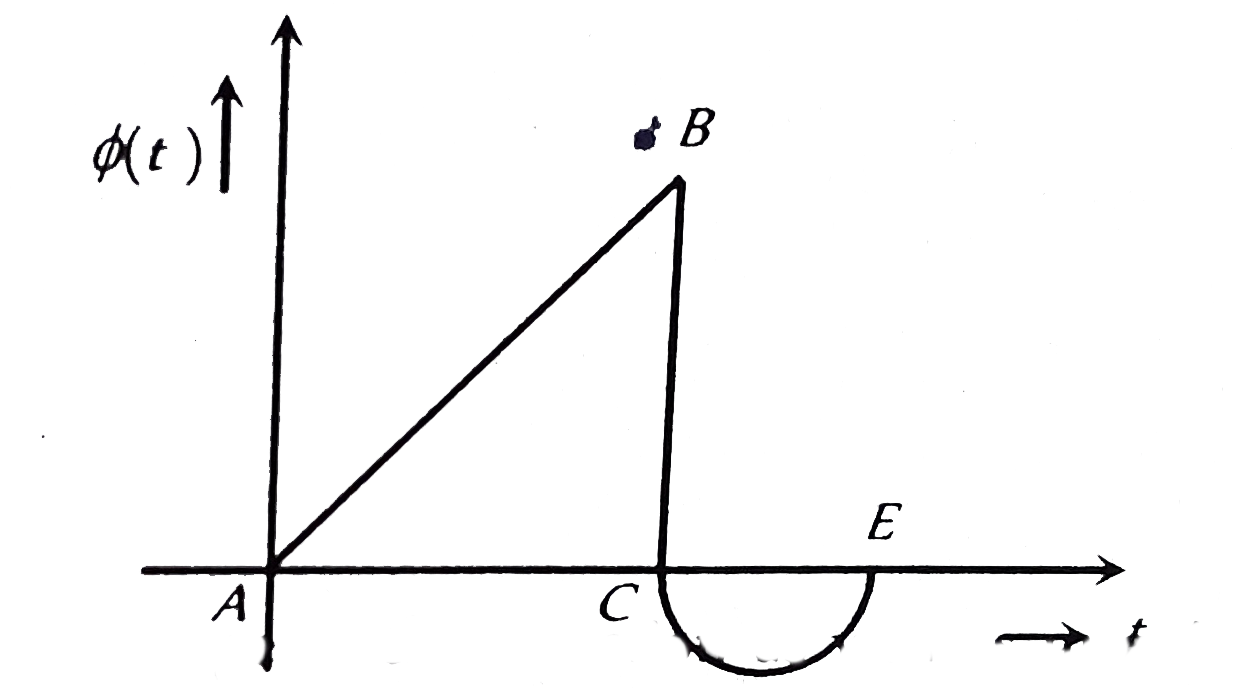 AThere is a change in the direction as well as magnitude of the induced emf between B and DBThe magnitude of the induced emf is maximum between B and CCThere is a change in the direction as well as magnitude of induced emf between A and CDThe induced emf is zero at B
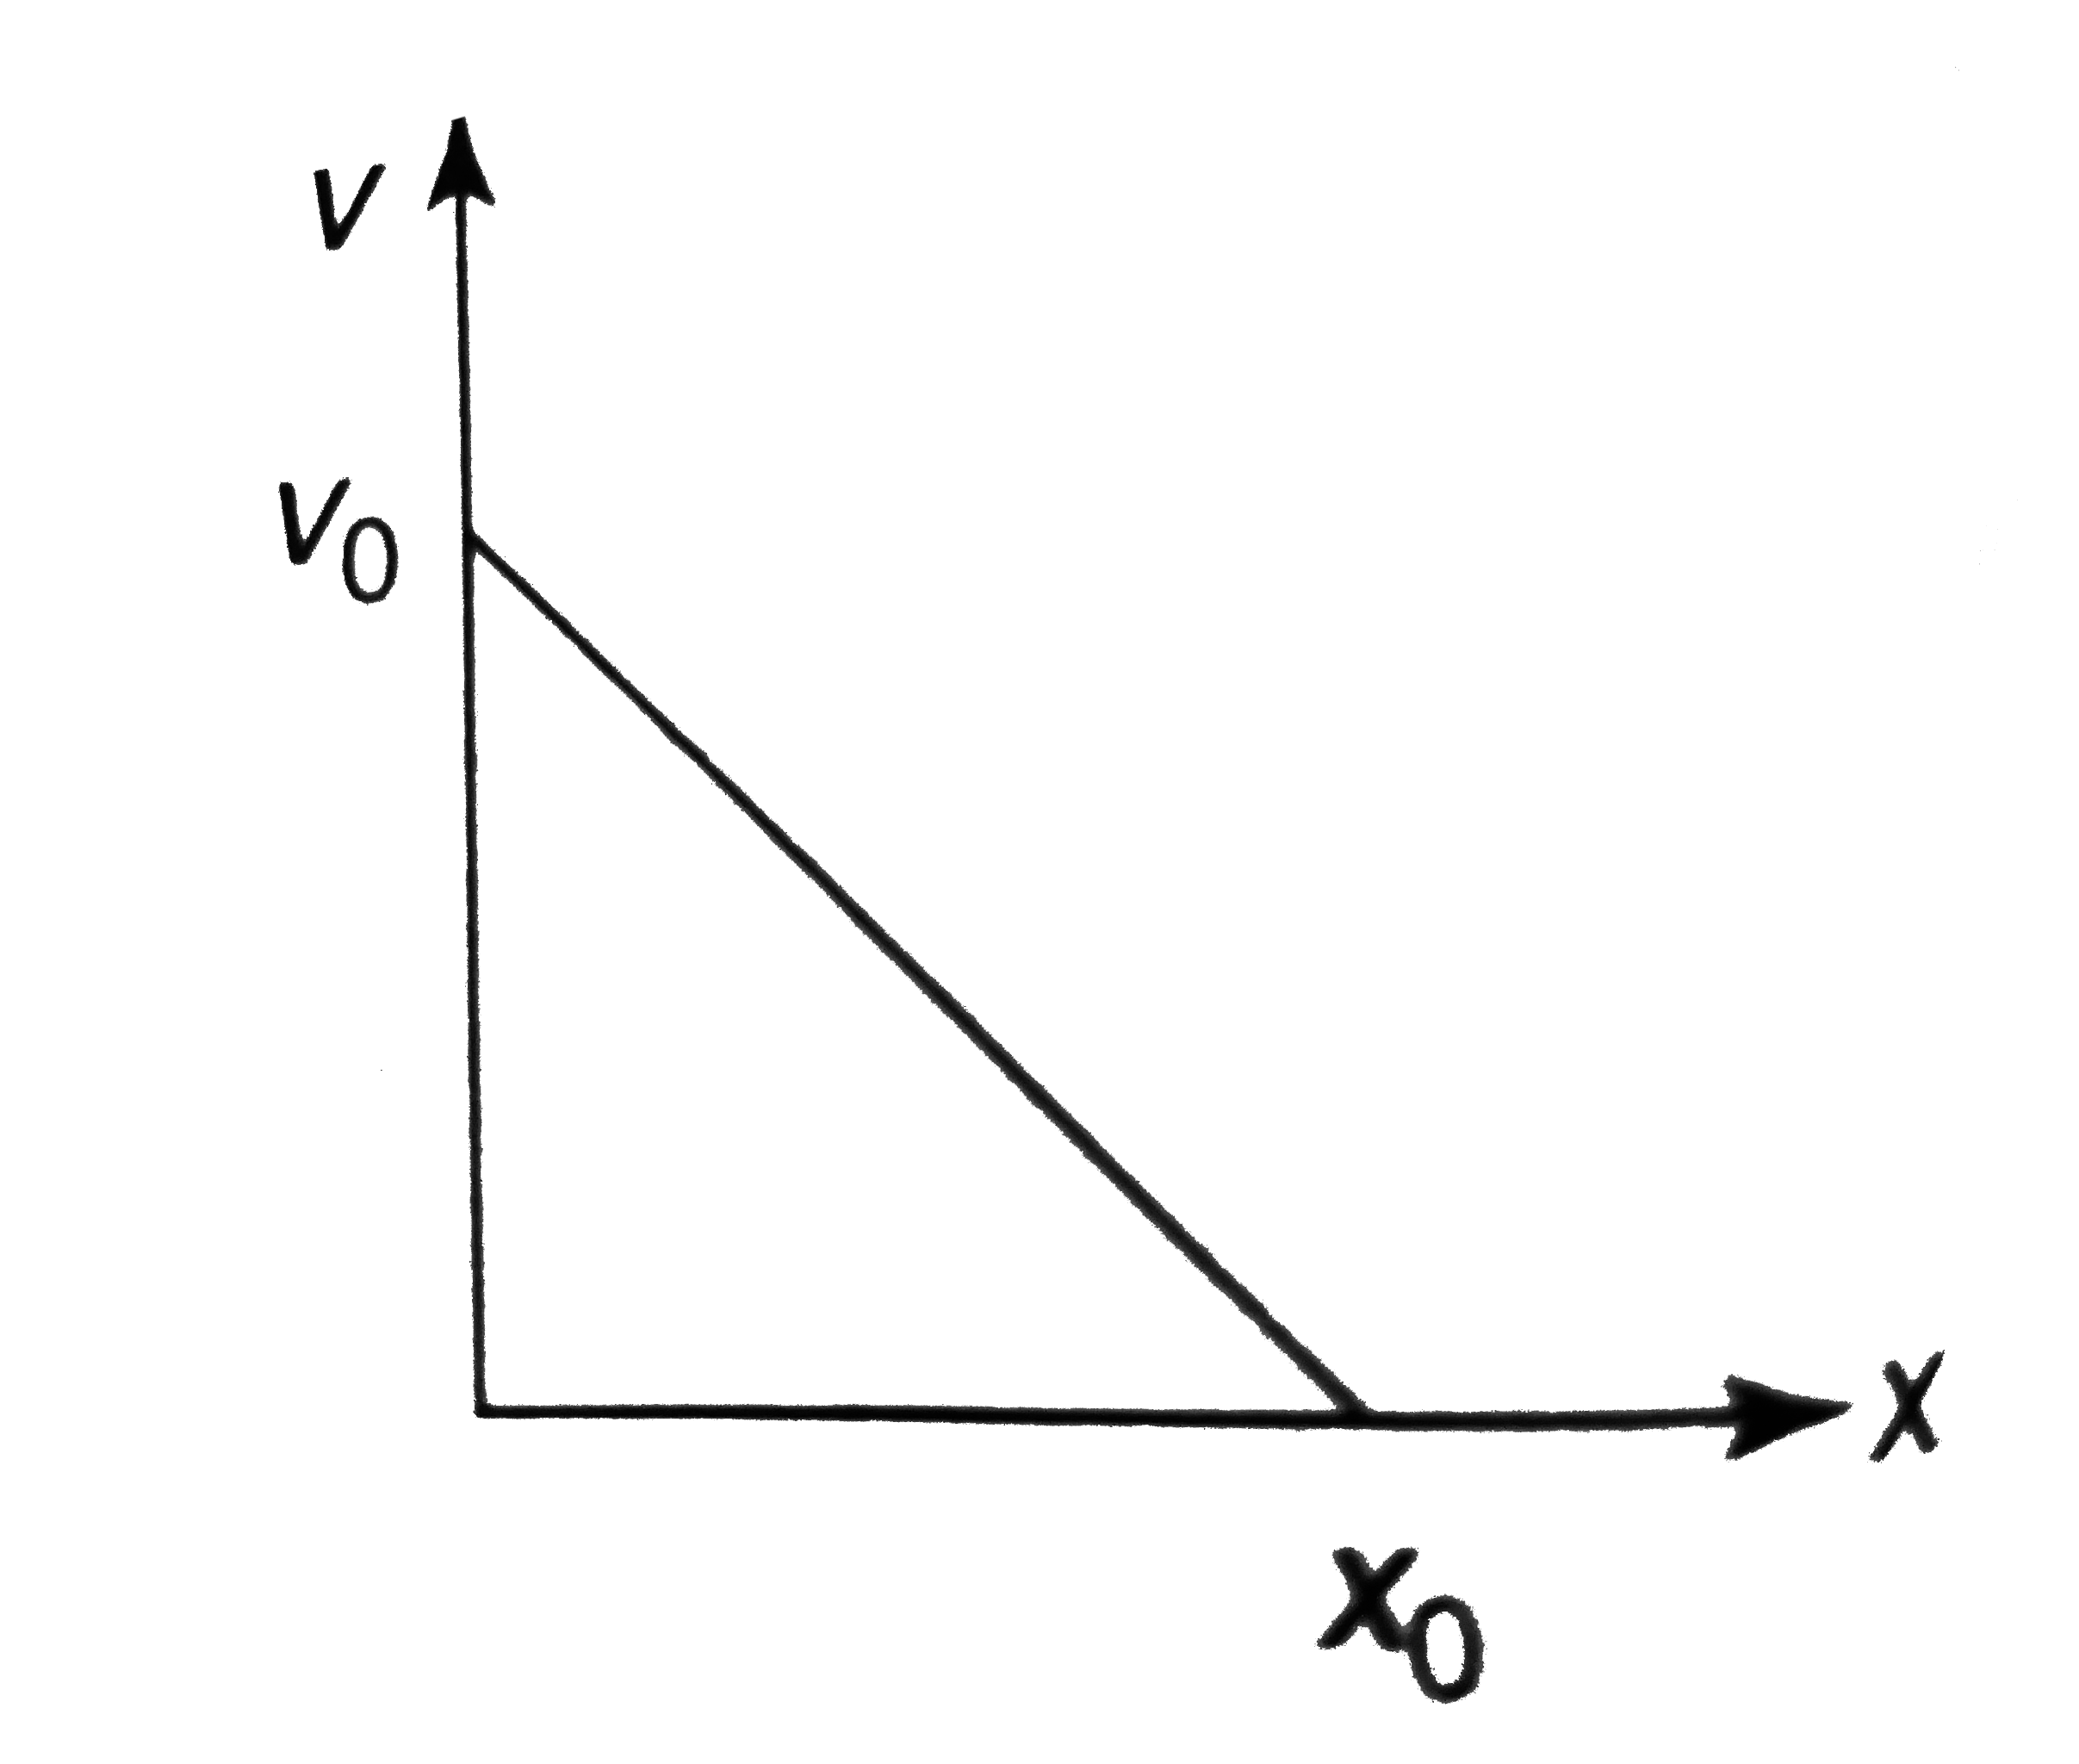
The given graph shows the variation of velocity with displacement. Which one of the graphs given below correctly represents the variation of acceleration with displacement ?
 A
A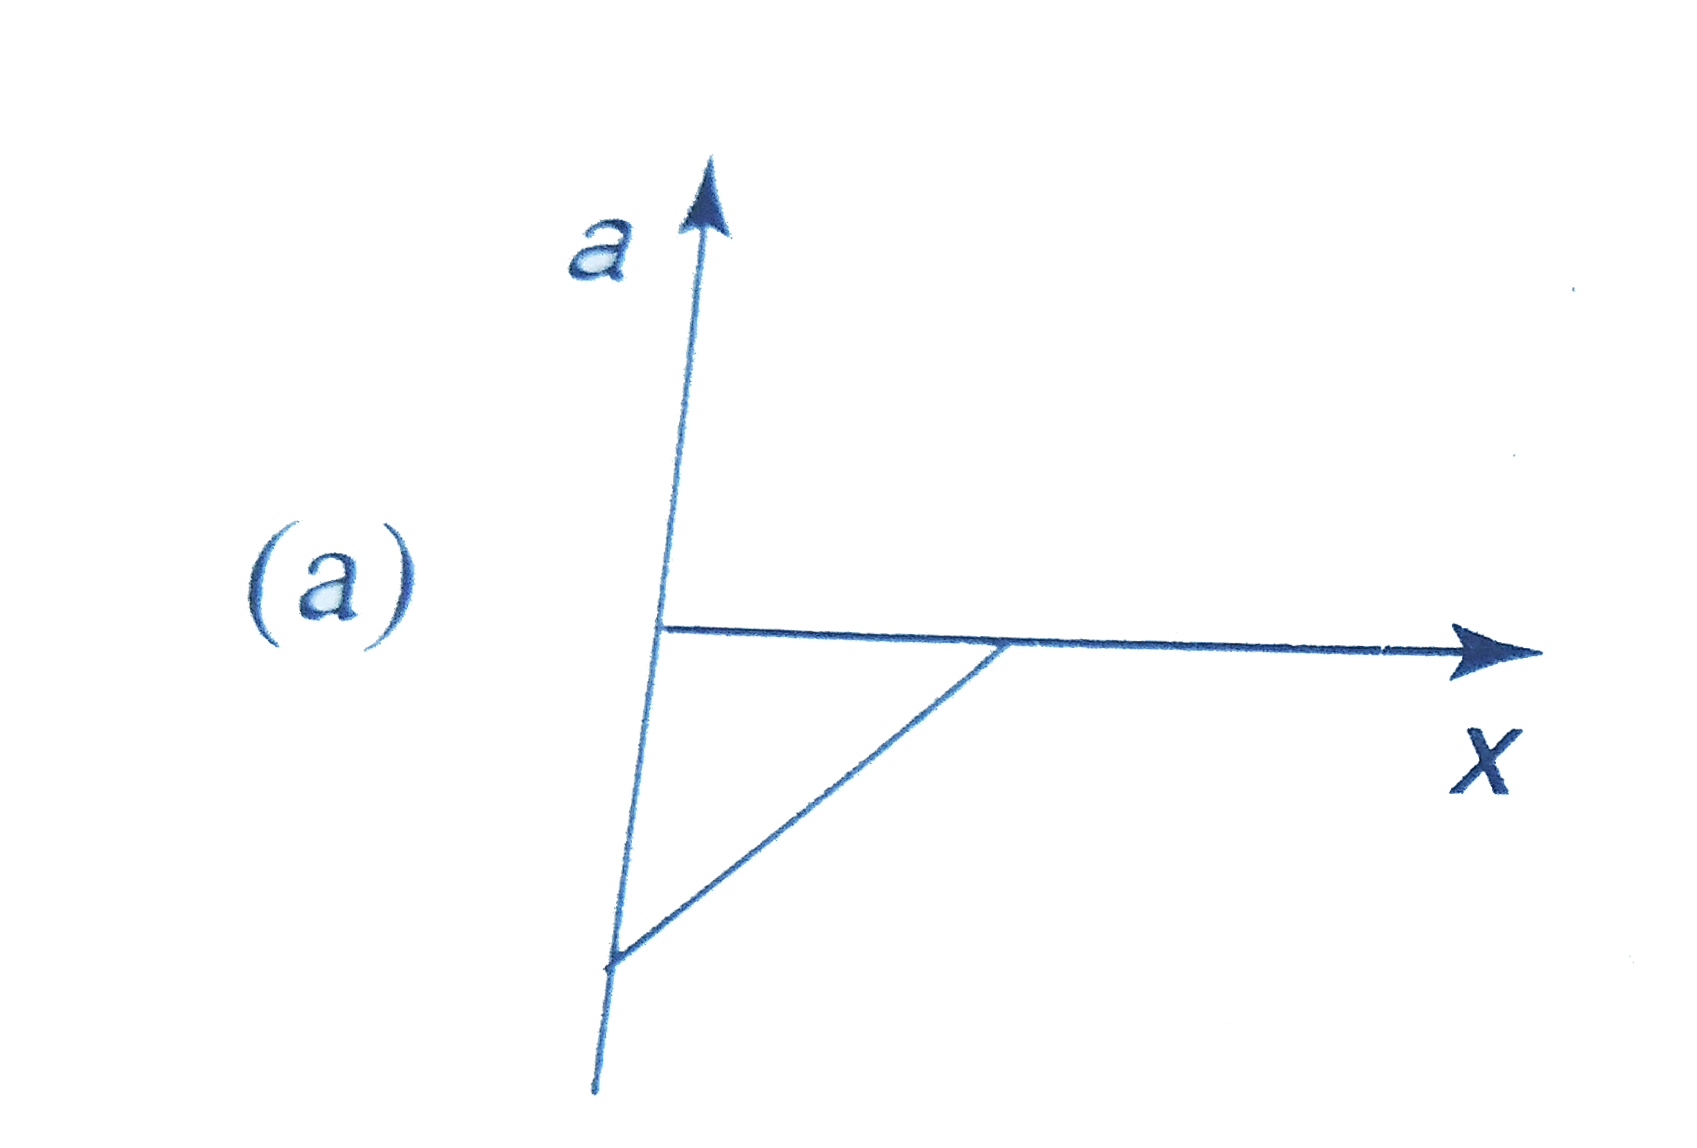 B
B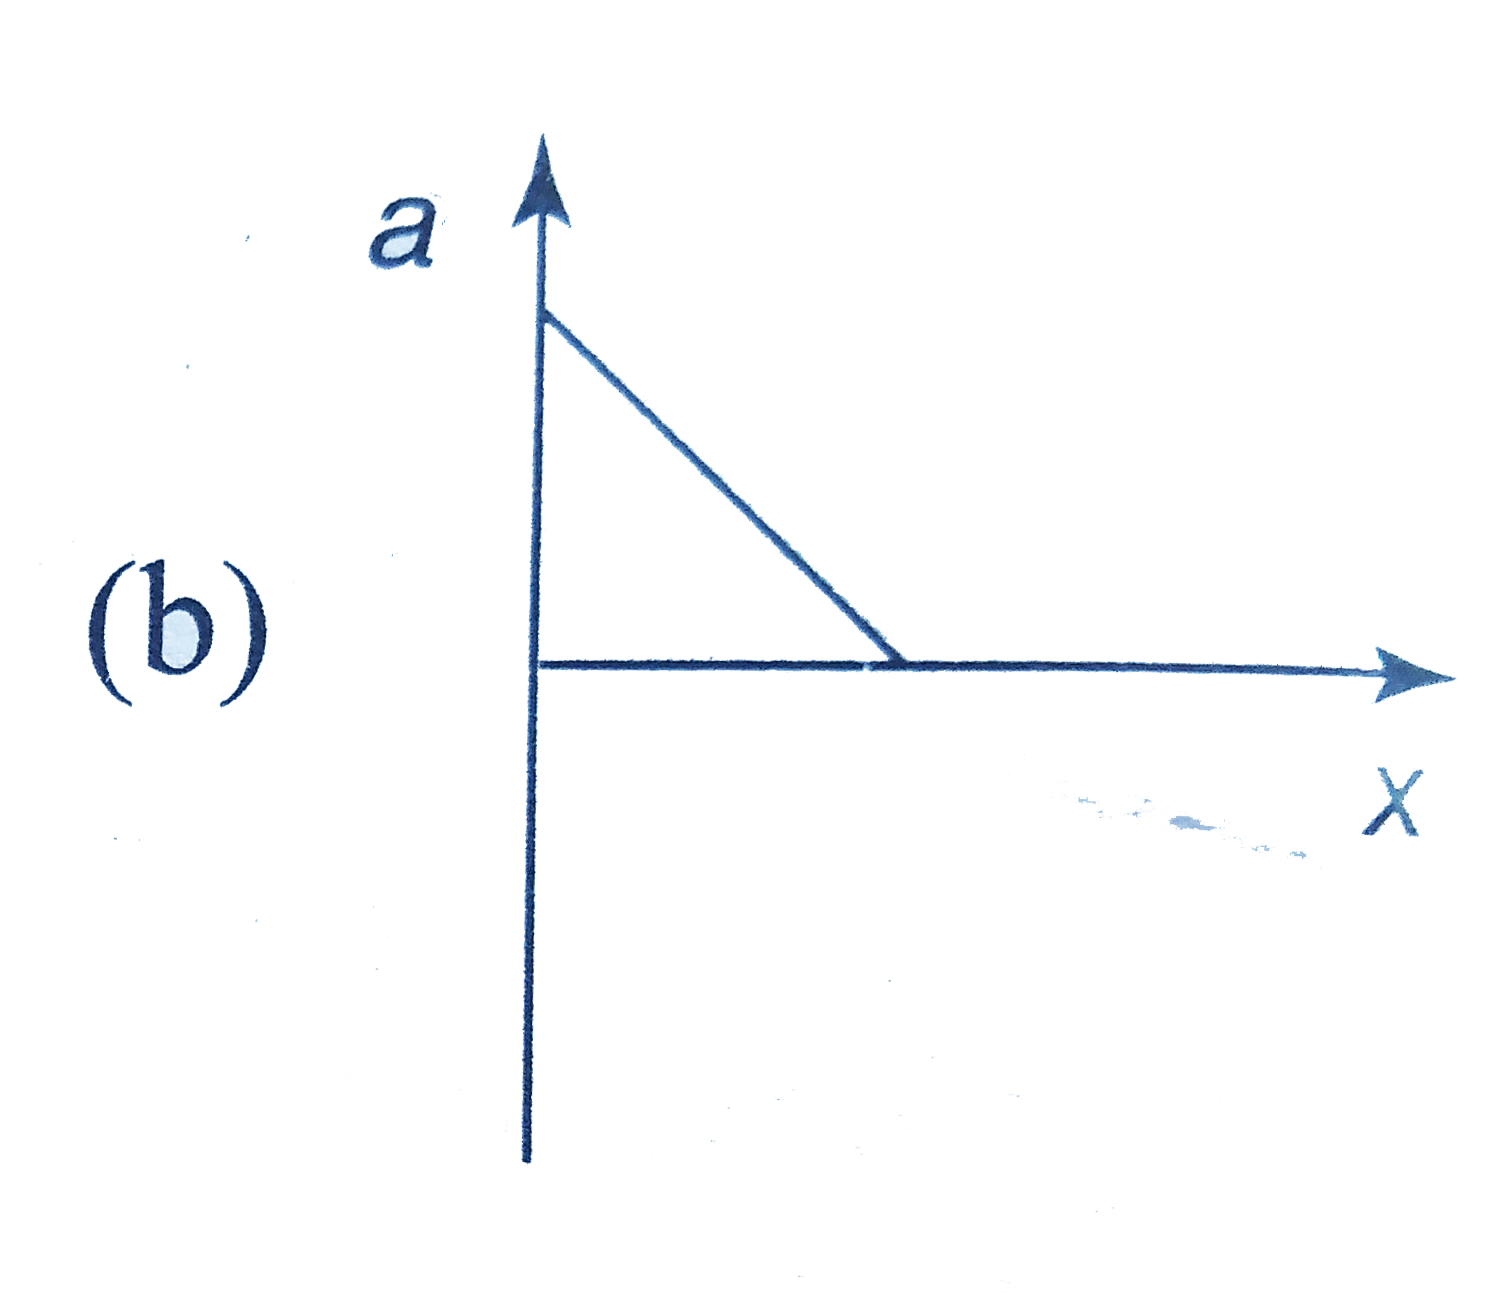 .C
.C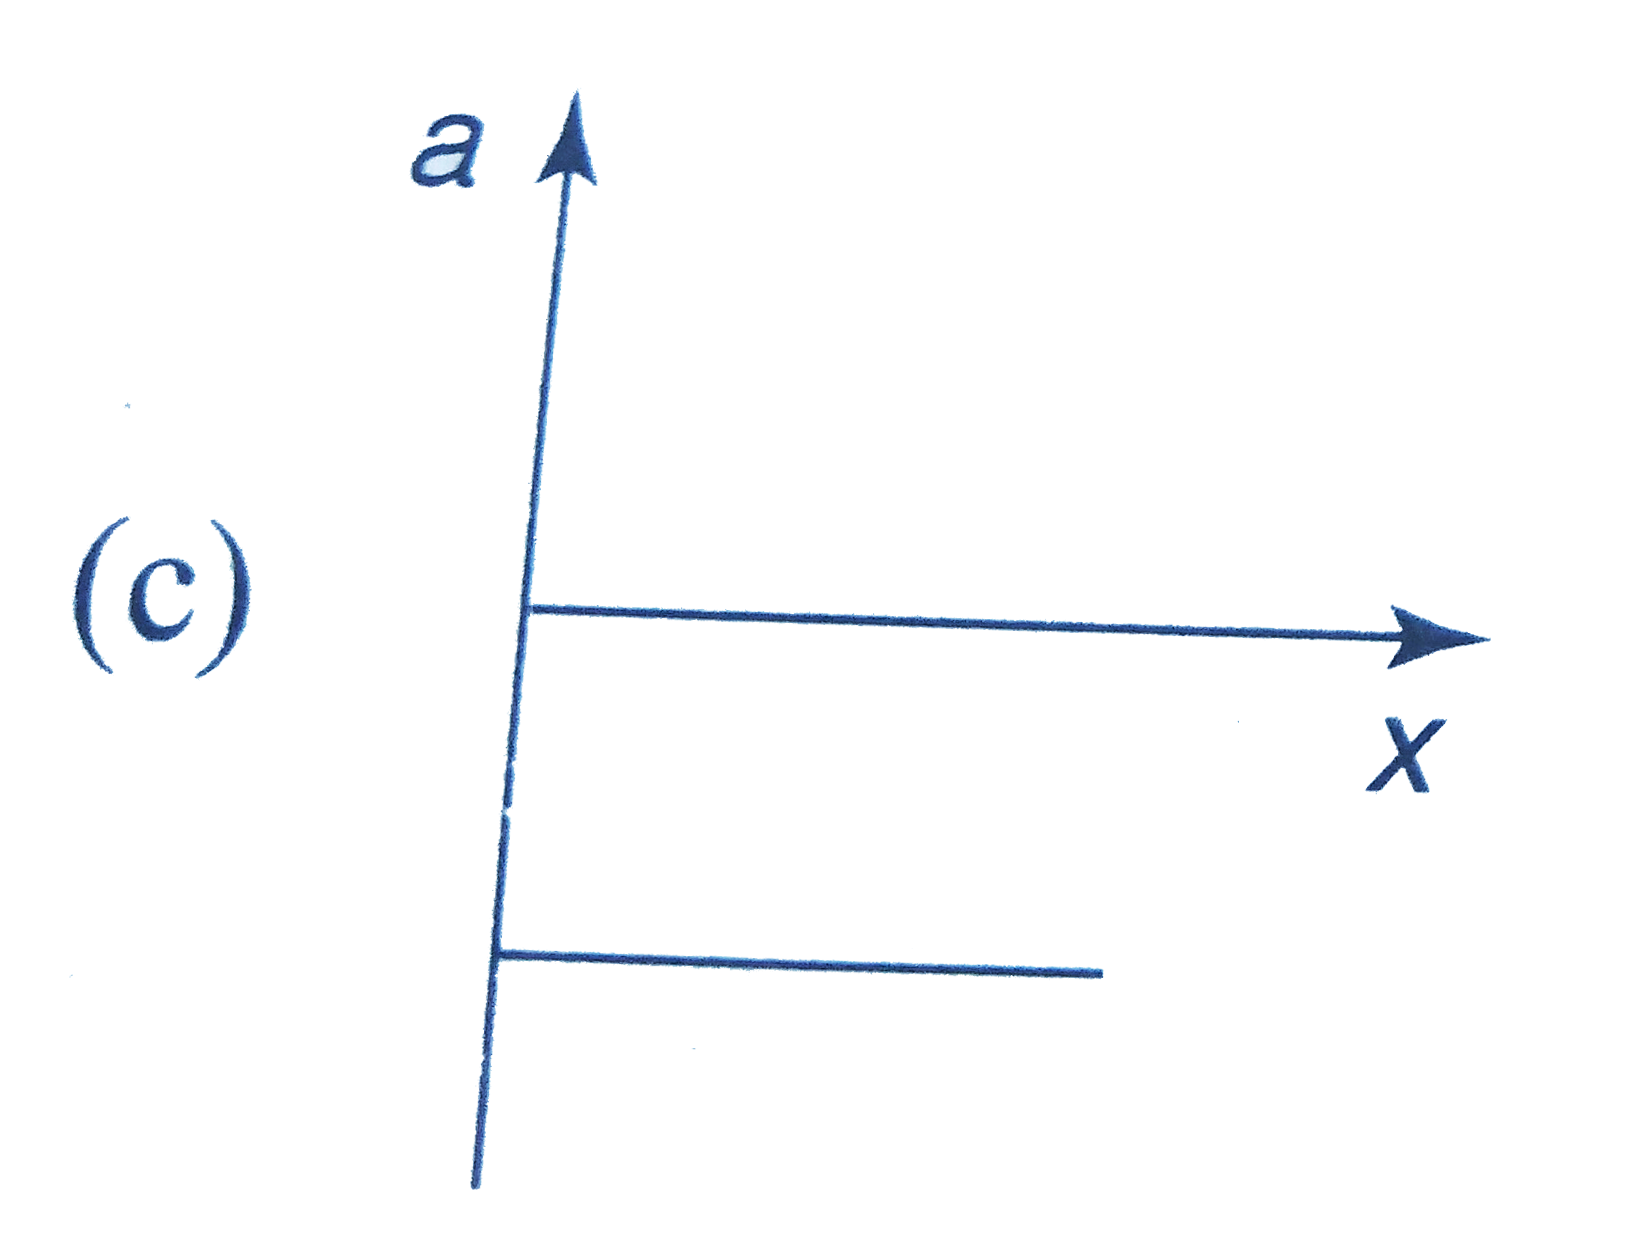 .D
.D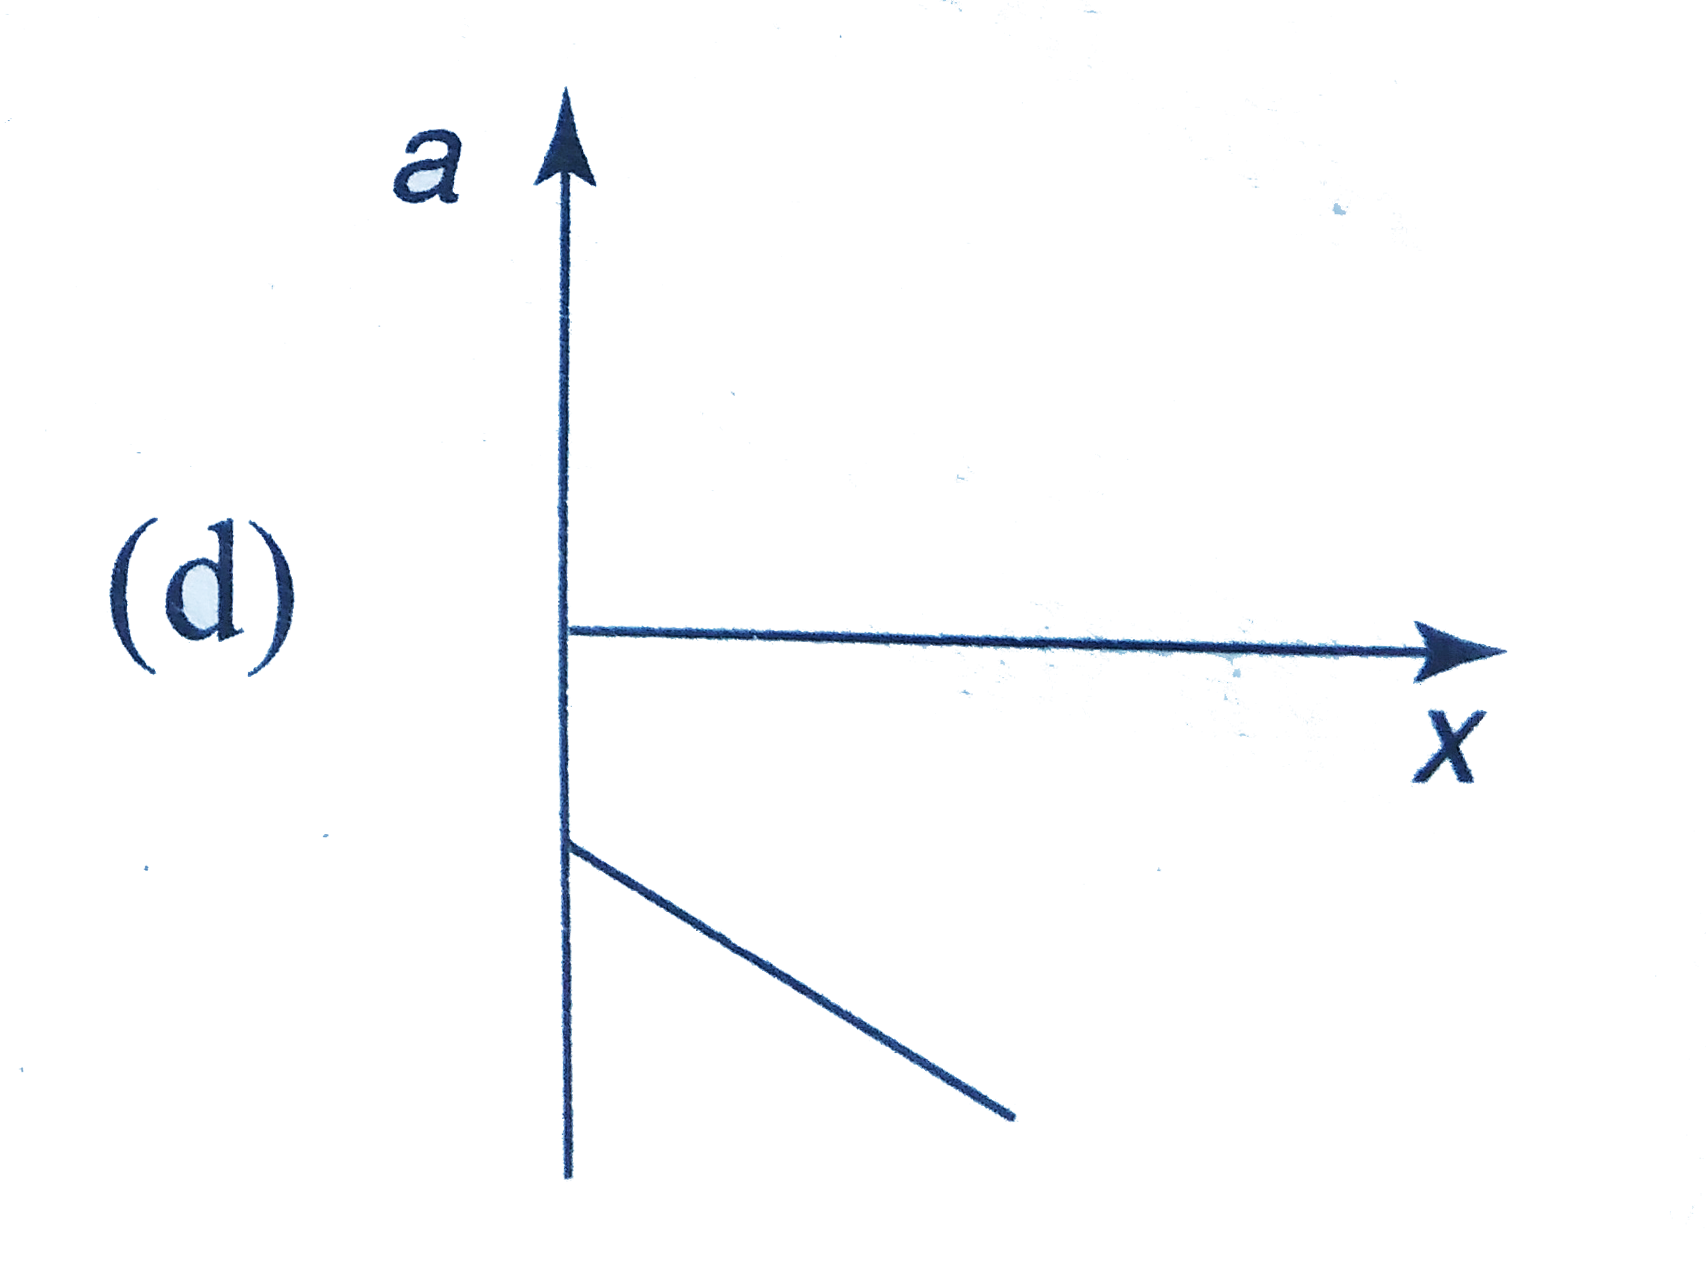 .
.
The graph shown the variation with times t of the velocity v of an object . Which one of the following graphs best represents the variation of acceleration a of the object with time t?

View SolutionThe magnetic flux linked with a coil is ϕ and the emf induced in it is e.
View SolutionLet magnetic flux be ϕB , induced emf be ξ and power P. All the three quantities related with each other, that is, if we vary the magnetic flux, induced emf and power change according the variation of magnetic flux. In the given table, Column I shows the variation of magnetic flux, Column II shows the effect on induced emf and Column III shows the effect on power.
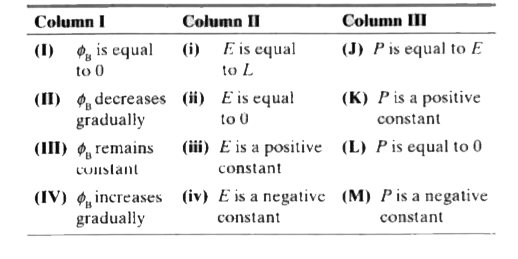
What are the conditions for a coil entering the magnetic field?
View SolutionConsider a rectangular coil of wire carrying constant current I, forming a magnetic dipole. The magnetic flux through an infinite plane that contains the rectangular coil and excluding the rectangular area is given byϕ. magnetic flux through the area of the rectangular area is given by ϕ. Which of the following option is correct?
View SolutionLet magnetic flux be ϕB , induced emf be ξ and power P. All the three quantities related with each other, that is, if we vary the magnetic flux, induced emf and power change according the variation of magnetic flux. In the given table, Column I shows the variation of magnetic flux, Column II shows the effect on induced emf and Column III shows the effect on power.
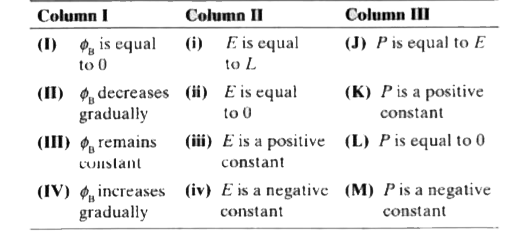
What are the conditions for a coil out of the field?
View Solution
